image

Thermometer Market Report Scope & Overview:

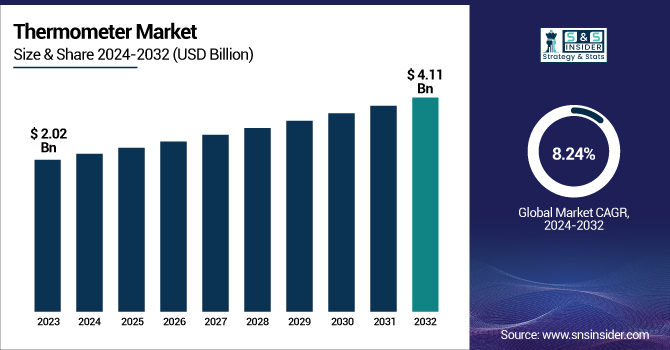
The Thermometer Market Size was valued at USD 2.02 Billion in 2023 and is expected to reach USD 4.11 Billion by 2032 and grow at a CAGR of 8.24% over the forecast period 2024-2032. This report identifies the increasing incidence and prevalence of fever conditions, fueling the need for advanced temperature-measuring devices. The research examines trends in innovation, such as the creation of smart and AI-based thermometers that provide real-time monitoring, mobile app connectivity, and improved accuracy. It also explores changing consumer attitudes, where heightened health consciousness and convenience are shaping purchasing behavior, with more preference for contactless infrared thermometers and digital ones over the traditional mercury-based types. The influence of e-commerce is also explored, as online channels continue to increase product availability and shape purchasing behavior.

Market Dynamics

Drivers

  • Growing Demand for Accurate and Contactless Temperature Monitoring

The growth in the thermometers market is fueled by heightened health awareness, growing infectious diseases, and expanding use of digital and infrared thermometers. Due to the growing number of fever-related illnesses such as influenza, COVID-19, and dengue, the sale of precise and contactless thermometers has accelerated sharply. During the COVID-19 pandemic, for example, sales of infrared thermometers accelerated worldwide by more than 300% as they became widely used in public places, workplaces, and hospitals. Moreover, innovation in smart thermometers with Bluetooth and app connectivity, like Kinsa Smart Thermometers, has transformed personal healthcare by allowing real-time tracking of data. The increasing trend of remote patient monitoring has also supported market growth, as healthcare providers increasingly prescribe smart thermometers for home healthcare. In addition, government regulations against mercury thermometers in many nations to address environmental and health issues have created consumer demand for mercury-free digital thermometers. Applications outside the healthcare sector, including food safety and HVAC (heating, ventilation, and air conditioning) industries, have also contributed to thermometer use for regulatory purposes. The growing use of AI-based temperature sensors in medical and industrial sectors also drives the market. In total, the need for accurate, non-invasive, and intelligent thermometers will increase, supporting the market's long-term growth prospects.

Restraints

  • High Cost of Advanced Thermometers and Lack of Awareness in Developing Regions

Even with robust market growth, the prohibitive cost of advanced thermometers is a primary constraint, holding back their adoption, particularly in price-sensitive markets. Smart and infrared thermometers, which provide quick and non-contact temperature readings, can be 2-3 times more expensive than conventional digital thermometers. This price difference renders them less affordable in low-income countries, where mercury or simple digital thermometers are still in widespread use. Moreover, the low awareness and accessibility in rural and underdeveloped regions limit market penetration. Numerous consumers are not aware of the advantages of infrared and intelligent thermometers, which results in sustained use of older mercury-based devices even after regulatory prohibitions. Accuracy issues with non-contact thermometers are another restraint. Research has indicated that infrared thermometers may occasionally provide inconsistent readings as a result of environmental conditions like humidity and changes in ambient temperatures. Additionally, restricted battery life and maintenance problems with digital thermometers present further issues, necessitating constant replacement or recalibration. Some medical professionals are also wary of the validity of ear and forehead thermometers, opting instead for conventional oral or rectal thermometers to obtain accurate results. These all contribute to preventing market growth, especially in areas where affordability and accessibility are key impediments.

Opportunities

  • The thermometer market is witnessing significant opportunities driven by technological advancements and expanding applications beyond healthcare.

Technologies like AI-enabled thermometers, temperature sensors that can be worn, and IoT-enabled smart thermometers are transforming temperature measurement. Smart thermometers like the Withings Thermo offer real-time monitoring, remote sharing of data, and fever pattern analysis, improving consumer and healthcare usability. Moreover, the increasing use of non-contact thermometers in food safety, industrial monitoring, and veterinary medicine is creating new revenue opportunities. For example, the food industry more widely employs infrared thermometers to achieve safety compliance with regulations, achieving proper storage and cooking temperatures. The HVAC industry depends similarly on digital thermometers for the efficiency of systems and management of energy. The growth of telemedicine and remote monitoring of healthcare is another significant opportunity. With the growth of virtual healthcare, there is growing demand for networked thermometers that are able to connect with mobile apps and with hospital systems. Moreover, government programs promoting public health sensitivity and medical equipment funding in educational institutions, places of work, and public areas further fuel the market potential. The growing integration of e-commerce platforms is increasingly making sophisticated thermometers available across global consumers as well. Due to ongoing developments and expanding fields of application, the thermometer industry is expected to experience steady expansion across various categories.

Challenges

  • One of the biggest challenges in the thermometer market is the proliferation of counterfeit products, which affects consumer trust and brand reputation.

The market has witnessed an increase in low-quality, unregulated thermometers, especially in online stores. Most of these devices give false readings, do not have required regulatory approvals (e.g., FDA and CE certifications), and are unsafe. Research shows that as much as 30% of non-contact infrared thermometers available in some markets might not be of medical-grade accuracy. This results in misdiagnosis and impacts the credibility of digital thermometers in the healthcare sector. Another hurdle is compliance with regulations since countries have diverse requirements on the accuracy and safety of thermometers. The companies have to deal with complicated certification procedures to attain universal standards of quality, thus adding costs of production and market entry hurdles. Furthermore, there is still competition from conventional thermometers in poor countries where mercury thermometers continue to be utilized even when banned. Another constant issue is sensor calibration and data validity in digital and intelligent thermometers, as fluctuations in environmental conditions can influence performance. In the absence of proper regulation and public education, the market has problems ensuring product uniformity, consumer trust, and mass use of sophisticated thermometer technology.

Segmentation Analysis

By Product

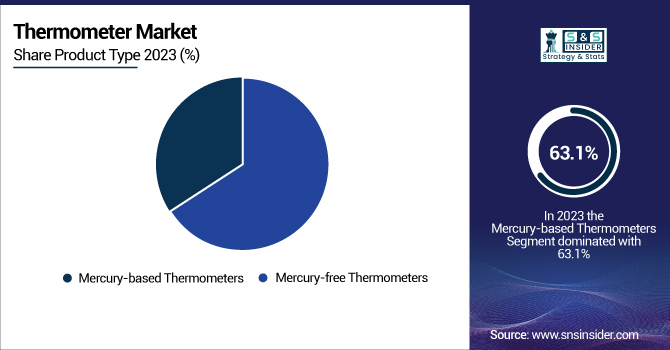
The mercury-free thermometers segment led the market in 2023, holding the highest revenue share of 63.1%. Increased knowledge of the environmental and health risks posed by mercury, as well as the imposition of strict laws prohibiting or limiting the use of mercury-based thermometers in most nations, was a key driver of this leadership. Furthermore, the heightened usage of digital and infrared thermometers in both medical and non-medical use also boosted demand for mercury-free products.

The mercury-free thermometers category is also anticipated to be the fastest-growing segment in the forecast period. The fast transition towards safer, more precise, and environmental-friendly temperature measurement solutions has impelled widespread adoption. The increase in demand for digital and infrared thermometers for use in healthcare, food safety, and industry has further spurred market growth.

By Application

The Medical segment was the largest revenue generator in 2023, with a market share of 27.1%. The growing incidence of infectious diseases, higher hospital visits, and extensive use of thermometers in home care environments were major drivers of this dominance. Moreover, the post-COVID-19 pandemic period maintained the demand for precise and non-contact temperature monitoring equipment, supporting the segment's market leadership.

The industrial sector is likely to witness the maximum growth rate over the forecast period. The growing requirement for temperature measurement in manufacturing, HVAC, and energy industries has propelled the demand for sophisticated industrial thermometers. In addition, stringent safety and quality control regulations in industries like pharmaceuticals, automotive, and metallurgy have promoted the use of infrared and digital thermometers in industries.

Regional Analysis

North America accounted for 33.9% of total revenues in the global thermometer market in 2023, which is due to well-developed healthcare infrastructure, high disease prevention awareness, and mass utilization of digital and infrared thermometers. The leading country in the market was the United States because of the growing requirement for home-use thermometers, common flu outbursts, and government policies favoring mercury-free devices. The availability of industry leaders like Braun, Exergen, and Kinsa further enhanced the market position of the region. Moreover, the accessibility of thermometers from retail pharmacies, online websites, and hospital supply chains has increased accessibility and sales.

Europe accounted for a high market share due to stringent regulatory policies prohibiting mercury thermometers, increasing healthcare costs, and an increasing demand for sophisticated temperature-measuring devices. Concurrently, the Asia-Pacific (APAC) region was the fastest-growing with China, India, and Japan driving growth. The mounting demand for thermometers in hospitals, home healthcare, and industrial uses has been a key driver. In addition, initiatives from the government to enhance public health infrastructure, outbreaks of diseases, and growth in online and offline retailing channels have driven the sale of thermometers. Growing demand for smart and non-contact infrared thermometers is a key trend that will form the future dynamics of the regional market.

Key Players and Their Thermometer Products

  • Medline Industries, Inc. – Medline Digital Oral Thermometer, Medline No-Touch Forehead Thermometer

  • Welch Allyn – Welch Allyn SureTemp Plus 690, Welch Allyn Braun ThermoScan PRO 6000

  • Medtronic – Covidien Genius 3 Tympanic Thermometer

  • OMRON Corporation – OMRON MC-720 Infrared Forehead Thermometer, OMRON Eco Temp Digital Thermometer

  • American Diagnostics Corporation (ADC) – ADC Adtemp 429 Non-Contact Infrared Thermometer, ADC Adtemp 413 Digital Stick Thermometer

  • 3M Company – 3M Tempa•DOT Disposable Thermometers

  • Microlife Corporation – Microlife NC 200 Non-Contact Thermometer, Microlife MT 850 Digital Thermometer

  • Briggs Healthcare – HealthSmart Digital Thermometer, HealthSmart Non-Contact Infrared Thermometer

  • Exergen Corporation – Exergen Temporal Artery Thermometer TAT-5000, Exergen Smart Glow Thermometer

  • Terumo Corporation – Terumo Digital Thermometer C202, Terumo Electronic Thermometer ET-C232P

Recent Developments

  • In March 2025, Govee reduced the price of its WiFi Hygrometer Thermometer Sensor (3-Pack), now available for under USD 19 per unit. This price drop enhances affordability for consumers seeking smart temperature and humidity monitoring solutions.

  • In May 2022, Exergen Corporation introduced the TAT-2000 Temporal Artery Thermometer, which is specifically tailored for the Indian market, at the Medical Fair in Mumbai. The company specializes in non-invasive temperature measurement instruments, providing greater accuracy, cost-effectiveness, and ease of use while providing greater reliability.

Thermometer Market Report Scope:

Report Attributes Details
Market Size in 2023 USD 2.02 billion     
Market Size by 2032 USD 4.11 billion  
CAGR CAGR of 8.24% From 2024 to 2032
Base Year 2023
Forecast Period 2024-2032
Historical Data 2020-2022
Report Scope & Coverage Market Size, Segments Analysis, Competitive  Landscape, Regional Analysis, DROC & SWOT Analysis, Forecast Outlook
Key Segments • By Product [Mercury-based Thermometers, Mercury-free Thermometers (Infrared Radiation Thermometers, Digital Thermometers, Others)]
• By Application [Medical, Industrial, Food, Laboratory, Others]
Regional Analysis/Coverage North America (US, Canada, Mexico), Europe (Eastern Europe [Poland, Romania, Hungary, Turkey, Rest of Eastern Europe] Western Europe] Germany, France, UK, Italy, Spain, Netherlands, Switzerland, Austria, Rest of Western Europe]), Asia Pacific (China, India, Japan, South Korea, Vietnam, Singapore, Australia, Rest of Asia Pacific), Middle East & Africa (Middle East [UAE, Egypt, Saudi Arabia, Qatar, Rest of Middle East], Africa [Nigeria, South Africa, Rest of Africa], Latin America (Brazil, Argentina, Colombia, Rest of Latin America)
Company Profiles Medline Industries, Inc., Welch Allyn, Medtronic, OMRON Corporation, American Diagnostics Corporation (ADC), 3M Company, Microlife Corporation, Briggs Healthcare, Exergen Corporation, Terumo Corporation.

Frequently Asked Questions

Ans: The Thermometer market is anticipated to grow at a CAGR of 8.24% from 2024 to 2032.

Ans: The market is expected to reach USD 4.11 billion by 2032, increasing from USD 2.02 billion in 2023.

Ans: The growth in the thermometers market is fueled by heightened health awareness, growing infectious diseases, and expanding use of digital and infrared thermometers.

Ans: High Cost of Advanced Thermometers and Lack of Awareness in Developing Regions.

Ans: North America dominated the Thermometer market.

Table of content

1. Introduction

1.1 Market Definition

1.2 Scope (Inclusion and Exclusions)

1.3 Research Assumptions

2. Executive Summary

2.1 Market Overview

2.2 Regional Synopsis

2.3 Competitive Summary

3. Research Methodology

3.1 Top-Down Approach

3.2 Bottom-up Approach

3.3. Data Validation

3.4 Primary Interviews

4. Market Dynamics Impact Analysis

4.1 Market Driving Factors Analysis

4.1.2 Drivers

4.1.2 Restraints

4.1.3 Opportunities

4.1.4 Challenges

4.2 PESTLE Analysis

4.3 Porter’s Five Forces Model

5. Statistical Insights and Trends Reporting

5.1 Incidence and Prevalence of Fever-related Conditions (2023)

5.2 Innovation Trends: Smart and AI-enabled Thermometers

5.3 Consumer Preferences and Buying Behavior (2023-2032)

6. Competitive Landscape

6.1 List of Major Companies, By Region

6.2 Market Share Analysis, By Region

6.3 Service Benchmarking

6.3.1 Service specifications and features

6.3.2 Pricing

6.4 Strategic Initiatives

6.4.1 Marketing and promotional activities

6.4.2 Distribution and Supply Chain Strategies

6.4.3 Expansion plans and new Service launches

6.4.4 Strategic partnerships and collaborations

6.5 Technological Advancements

6.6 Market Positioning and Branding

7. Thermometer Market Segmentation, by Product  

71 Chapter Overview

     7.2 Mercury-based Thermometers

             7.2.1 Mercury-based Thermometers Market Trends Analysis (2020-2032)

7.2.2 Mercury-based Thermometers Market Size Estimates and Forecasts to 2032 (USD Billion)

7.3 Mercury-free Thermometers

             7.3.1 Mercury-free Thermometers Market Trends Analysis (2020-2032)

7.3.2 Mercury-free Thermometers Market Size Estimates and Forecasts to 2032 (USD Billion)

7.3.3 Infrared Radiation Thermometers

             7.3.3.1 Infrared Radiation Thermometers Market Trends Analysis (2020-2032)

7.3.3.2 Infrared Radiation Thermometers Market Size Estimates and Forecasts to 2032 (USD Billion)

7.3.4 Digital Thermometers

             7.3.4.1 Digital Thermometers Market Trends Analysis (2020-2032)

7.3.4.2 Digital Thermometers Market Size Estimates and Forecasts to 2032 (USD Billion)

7.3.5 Others

             7.3.5.1 Others Market Trends Analysis (2020-2032)

7.3.5.2 Others Market Size Estimates and Forecasts to 2032 (USD Billion)

 8. Thermometer Market Segmentation, by Application

    1. Chapter Overview

     8.2 Medical

             8.2.1 Medical Market Trends Analysis (2020-2032)

8.2.2 Medical Market Size Estimates and Forecasts to 2032 (USD Billion)

    8.3 Industrial

8.3.1 Industrial Market Trends Analysis (2020-2032)

              8.3.2 Industrial Market Size Estimates and Forecasts to 2032 (USD Billion)

8.4 Food

8.4.1 Food Market Trends Analysis (2020-2032)

              8.4.2 Food Market Size Estimates and Forecasts to 2032 (USD Billion)

8.5 Laboratory

8.5.1 Laboratory Market Trends Analysis (2020-2032)

              8.5.2 Laboratory Market Size Estimates and Forecasts to 2032 (USD Billion)

8.6 Others

8.6.1 Others Market Trends Analysis (2020-2032)

              8.6.2 Others Market Size Estimates and Forecasts to 2032 (USD Billion)

9. Regional Analysis

9.1 Chapter Overview

9.2 North America

9.2.1 Trends Analysis

9.2.2 North America Thermometer Market Estimates and Forecasts, by Country (2020-2032) (USD Billion)

9.2.3 North America Thermometer Market Estimates and Forecasts, by Product (2020-2032) (USD Billion) 

9.2.4 North America Thermometer Market Estimates and Forecasts, by Application (2020-2032) (USD Billion)

9.2.5 USA

9.2.5.1 USA Thermometer Market Estimates and Forecasts, by Product (2020-2032) (USD Billion)

9.2.5.2 USA Thermometer Market Estimates and Forecasts, by Application (2020-2032) (USD Billion)

9.2.6 Canada

9.2.6.1 Canada Thermometer Market Estimates and Forecasts, by Product (2020-2032) (USD Billion)

9.2.6.2 Canada Thermometer Market Estimates and Forecasts, by Application (2020-2032) (USD Billion)

9.2.7 Mexico

9.2.7.1 Mexico Thermometer Market Estimates and Forecasts, by Product (2020-2032) (USD Billion)

9.2.7.2 Mexico Thermometer Market Estimates and Forecasts, by Application (2020-2032) (USD Billion)

9.3 Europe

9.3.1 Eastern Europe

9.3.1.1 Trends Analysis

9.3.1.2 Eastern Europe Thermometer Market Estimates and Forecasts, by Country (2020-2032) (USD Billion)

9.3.1.3 Eastern Europe Thermometer Market Estimates and Forecasts, by Product (2020-2032) (USD Billion) 

9.3.1.4 Eastern Europe Thermometer Market Estimates and Forecasts, by Application (2020-2032) (USD Billion)

9.3.1.5 Poland

9.3.1.5.1 Poland Thermometer Market Estimates and Forecasts, by Product (2020-2032) (USD Billion)

9.3.1.5.2 Poland Thermometer Market Estimates and Forecasts, by Application (2020-2032) (USD Billion)

9.3.1.6 Romania

9.3.1.6.1 Romania Thermometer Market Estimates and Forecasts, by Product (2020-2032) (USD Billion)

9.3.1.6.2 Romania Thermometer Market Estimates and Forecasts, by Application (2020-2032) (USD Billion)

9.3.1.7 Hungary

9.3.1.7.1 Hungary Thermometer Market Estimates and Forecasts, by Product (2020-2032) (USD Billion)

9.3.1.7.2 Hungary Thermometer Market Estimates and Forecasts, by Application (2020-2032) (USD Billion)

9.3.1.8 Turkey

9.3.1.8.1 Turkey Thermometer Market Estimates and Forecasts, by Product (2020-2032) (USD Billion)

9.3.1.8.2 Turkey Thermometer Market Estimates and Forecasts, by Application (2020-2032) (USD Billion)

9.3.1.9 Rest of Eastern Europe

9.3.1.9.1 Rest of Eastern Europe Thermometer Market Estimates and Forecasts, by Product (2020-2032) (USD Billion)

9.3.1.9.2 Rest of Eastern Europe Thermometer Market Estimates and Forecasts, by Application (2020-2032) (USD Billion)

9.3.2 Western Europe

9.3.2.1 Trends Analysis

9.3.2.2 Western Europe Thermometer Market Estimates and Forecasts, by Country (2020-2032) (USD Billion)

9.3.2.3 Western Europe Thermometer Market Estimates and Forecasts, by Product (2020-2032) (USD Billion) 

9.3.2.4 Western Europe Thermometer Market Estimates and Forecasts, by Application (2020-2032) (USD Billion)

9.3.2.5 Germany

9.3.2.5.1 Germany Thermometer Market Estimates and Forecasts, by Product (2020-2032) (USD Billion)

9.3.2.5.2 Germany Thermometer Market Estimates and Forecasts, by Application (2020-2032) (USD Billion)

9.3.2.6 France

9.3.2.6.1 France Thermometer Market Estimates and Forecasts, by Product (2020-2032) (USD Billion)

9.3.2.6.2 France Thermometer Market Estimates and Forecasts, by Application (2020-2032) (USD Billion)

9.3.2.7 UK

9.3.2.7.1 UK Thermometer Market Estimates and Forecasts, by Product (2020-2032) (USD Billion)

9.3.2.7.2 UK Thermometer Market Estimates and Forecasts, by Application (2020-2032) (USD Billion)

9.3.2.8 Italy

9.3.2.8.1 Italy Thermometer Market Estimates and Forecasts, by Product (2020-2032) (USD Billion)

9.3.2.8.2 Italy Thermometer Market Estimates and Forecasts, by Application (2020-2032) (USD Billion)

9.3.2.9 Spain

9.3.2.9.1 Spain Thermometer Market Estimates and Forecasts, by Product (2020-2032) (USD Billion)

9.3.2.9.2 Spain Thermometer Market Estimates and Forecasts, by Application (2020-2032) (USD Billion)

9.3.2.10 Netherlands

9.3.2.10.1 Netherlands Thermometer Market Estimates and Forecasts, by Product (2020-2032) (USD Billion)

9.3.2.10.2 Netherlands Thermometer Market Estimates and Forecasts, by Application (2020-2032) (USD Billion)

9.3.2.11 Switzerland

9.3.2.11.1 Switzerland Thermometer Market Estimates and Forecasts, by Product (2020-2032) (USD Billion)

9.3.2.11.2 Switzerland Thermometer Market Estimates and Forecasts, by Application (2020-2032) (USD Billion)

9.3.2.12 Austria

9.3.2.12.1 Austria Thermometer Market Estimates and Forecasts, by Product (2020-2032) (USD Billion)

9.3.2.12.2 Austria Thermometer Market Estimates and Forecasts, by Application (2020-2032) (USD Billion)

9.3.2.13 Rest of Western Europe

9.3.2.13.1 Rest of Western Europe Thermometer Market Estimates and Forecasts, by Product (2020-2032) (USD Billion)

9.3.2.13.2 Rest of Western Europe Thermometer Market Estimates and Forecasts, by Application (2020-2032) (USD Billion)

9.4 Asia Pacific

9.4.1 Trends Analysis

9.4.2 Asia Pacific Thermometer Market Estimates and Forecasts, by Country (2020-2032) (USD Billion)

9.4.3 Asia Pacific Thermometer Market Estimates and Forecasts, by Product (2020-2032) (USD Billion) 

9.4.4 Asia Pacific Thermometer Market Estimates and Forecasts, by Application (2020-2032) (USD Billion)

9.4.5 China

9.4.5.1 China Thermometer Market Estimates and Forecasts, by Product (2020-2032) (USD Billion)

9.4.5.2 China Thermometer Market Estimates and Forecasts, by Application (2020-2032) (USD Billion)

9.4.6 India

9.4.5.1 India Thermometer Market Estimates and Forecasts, by Product (2020-2032) (USD Billion)

9.4.5.2 India Thermometer Market Estimates and Forecasts, by Application (2020-2032) (USD Billion)

9.4.5 Japan

9.4.5.1 Japan Thermometer Market Estimates and Forecasts, by Product (2020-2032) (USD Billion)

9.4.5.2 Japan Thermometer Market Estimates and Forecasts, by Application (2020-2032) (USD Billion)

9.4.6 South Korea

9.4.6.1 South Korea Thermometer Market Estimates and Forecasts, by Product (2020-2032) (USD Billion)

9.4.6.2 South Korea Thermometer Market Estimates and Forecasts, by Application (2020-2032) (USD Billion)

9.4.7 Vietnam

9.4.7.1 Vietnam Thermometer Market Estimates and Forecasts, by Product (2020-2032) (USD Billion)

9.2.7.2 Vietnam Thermometer Market Estimates and Forecasts, by Application (2020-2032) (USD Billion)

9.4.8 Singapore

9.4.8.1 Singapore Thermometer Market Estimates and Forecasts, by Product (2020-2032) (USD Billion)

9.4.8.2 Singapore Thermometer Market Estimates and Forecasts, by Application (2020-2032) (USD Billion)

9.4.9 Australia

9.4.9.1 Australia Thermometer Market Estimates and Forecasts, by Product (2020-2032) (USD Billion)

9.4.9.2 Australia Thermometer Market Estimates and Forecasts, by Application (2020-2032) (USD Billion)

9.4.10 Rest of Asia Pacific

9.4.10.1 Rest of Asia Pacific Thermometer Market Estimates and Forecasts, by Product (2020-2032) (USD Billion)

9.4.10.2 Rest of Asia Pacific Thermometer Market Estimates and Forecasts, by Application (2020-2032) (USD Billion)

9.5 Middle East and Africa

9.5.1 Middle East

9.5.1.1 Trends Analysis

9.5.1.2 Middle East Thermometer Market Estimates and Forecasts, by Country (2020-2032) (USD Billion)

9.5.1.3 Middle East Thermometer Market Estimates and Forecasts, by Product (2020-2032) (USD Billion) 

9.5.1.4 Middle East Thermometer Market Estimates and Forecasts, by Application (2020-2032) (USD Billion)

9.5.1.5 UAE

9.5.1.5.1 UAE Thermometer Market Estimates and Forecasts, by Product (2020-2032) (USD Billion)

9.5.1.5.2 UAE Thermometer Market Estimates and Forecasts, by Application (2020-2032) (USD Billion)

9.5.1.6 Egypt

9.5.1.6.1 Egypt Thermometer Market Estimates and Forecasts, by Product (2020-2032) (USD Billion)

9.5.1.6.2 Egypt Thermometer Market Estimates and Forecasts, by Application (2020-2032) (USD Billion)

9.5.1.7 Saudi Arabia

9.5.1.7.1 Saudi Arabia Thermometer Market Estimates and Forecasts, by Product (2020-2032) (USD Billion)

9.5.1.7.2 Saudi Arabia Thermometer Market Estimates and Forecasts, by Application (2020-2032) (USD Billion)

9.5.1.8 Qatar

9.5.1.8.1 Qatar Thermometer Market Estimates and Forecasts, by Product (2020-2032) (USD Billion)

9.5.1.8.2 Qatar Thermometer Market Estimates and Forecasts, by Application (2020-2032) (USD Billion)

9.5.1.9 Rest of Middle East

9.5.1.9.1 Rest of Middle East Thermometer Market Estimates and Forecasts, by Product (2020-2032) (USD Billion)

9.5.1.9.2 Rest of Middle East Thermometer Market Estimates and Forecasts, by Application (2020-2032) (USD Billion)

9.5.2 Africa

9.5.2.1 Trends Analysis

9.5.2.2 Africa Thermometer Market Estimates and Forecasts, by Country (2020-2032) (USD Billion)

9.5.2.3 Africa Thermometer Market Estimates and Forecasts, by Product (2020-2032) (USD Billion) 

9.5.2.4 Africa Thermometer Market Estimates and Forecasts, by Application (2020-2032) (USD Billion)

9.5.2.5 South Africa

9.5.2.5.1 South Africa Thermometer Market Estimates and Forecasts, by Product (2020-2032) (USD Billion)

9.5.2.5.2 South Africa Thermometer Market Estimates and Forecasts, by Application (2020-2032) (USD Billion)

9.5.2.6 Nigeria

9.5.2.6.1 Nigeria Thermometer Market Estimates and Forecasts, by Product (2020-2032) (USD Billion)

9.5.2.6.2 Nigeria Thermometer Market Estimates and Forecasts, by Application (2020-2032) (USD Billion)

9.6 Latin America

9.6.1 Trends Analysis

9.6.2 Latin America Thermometer Market Estimates and Forecasts, by Country (2020-2032) (USD Billion)

9.6.3 Latin America Thermometer Market Estimates and Forecasts, by Product (2020-2032) (USD Billion) 

9.6.4 Latin America Thermometer Market Estimates and Forecasts, by Application (2020-2032) (USD Billion)

9.6.5 Brazil

9.6.5.1 Brazil Thermometer Market Estimates and Forecasts, by Product (2020-2032) (USD Billion)

9.6.5.2 Brazil Thermometer Market Estimates and Forecasts, by Application (2020-2032) (USD Billion)

9.6.6 Argentina

9.6.6.1 Argentina Thermometer Market Estimates and Forecasts, by Product (2020-2032) (USD Billion)

9.6.6.2 Argentina Thermometer Market Estimates and Forecasts, by Application (2020-2032) (USD Billion)

9.6.7 Colombia

9.6.7.1 Colombia Thermometer Market Estimates and Forecasts, by Product (2020-2032) (USD Billion)

9.6.7.2 Colombia Thermometer Market Estimates and Forecasts, by Application (2020-2032) (USD Billion)

9.6.8 Rest of Latin America

9.6.8.1 Rest of Latin America Thermometer Market Estimates and Forecasts, by Product (2020-2032) (USD Billion)

9.6.8.2 Rest of Latin America Thermometer Market Estimates and Forecasts, by Application (2020-2032) (USD Billion)

10. Company Profiles

10.1 Medline Industries, Inc.

10.1.1 Company Overview

10.1.2 Financial

10.1.3 Products/ Services Offered

10.1.4 SWOT Analysis

10.2 Welch Allyn

10.2.1 Company Overview

10.2.2 Financial

10.2.3 Products/ Services Offered

10.2.4 SWOT Analysis

10.3 Medtronic

10.3.1 Company Overview

10.3.2 Financial

10.3.3 Products/ Services Offered

10.3.4 SWOT Analysis

10.4 OMRON Corporation

10.4.1 Company Overview

10.4.2 Financial

10.4.3 Products/ Services Offered

10.4.4 SWOT Analysis

10.5 American Diagnostics Corporation (ADC)

10.5.1 Company Overview

10.5.2 Financial

10.5.3 Products/ Services Offered

10.5.4 SWOT Analysis

10.6 3M Company

10.6.1 Company Overview

10.6.2 Financial

10.6.3 Products/ Services Offered

10.6.4 SWOT Analysis

10.7 Microlife Corporation

10.7.1 Company Overview

10.7.2 Financial

10.7.3 Products/ Services Offered

10.7.4 SWOT Analysis

10.8 Briggs Healthcare

10.8.1 Company Overview

10.8.2 Financial

10.8.3 Products/ Services Offered

10.8.4 SWOT Analysis

10.9 Exergen Corporation

10.9.1 Company Overview

10.9.2 Financial

10.9.3 Products/ Services Offered

10.9.4 SWOT Analysis

10.10 Terumo Corporation

10.10.1 Company Overview

10.10.2 Financial

10.10.3 Products/ Services Offered

10.10.4 SWOT Analysis

11. Use Cases and Best Practices

12. Conclusion

An accurate research report requires proper strategizing as well as implementation. There are multiple factors involved in the completion of good and accurate research report and selecting the best methodology to compete the research is the toughest part. Since the research reports we provide play a crucial role in any company’s decision-making process, therefore we at SNS Insider always believe that we should choose the best method which gives us results closer to reality. This allows us to reach at a stage wherein we can provide our clients best and accurate investment to output ratio.

Each report that we prepare takes a timeframe of 350-400 business hours for production. Starting from the selection of titles through a couple of in-depth brain storming session to the final QC process before uploading our titles on our website we dedicate around 350 working hours. The titles are selected based on their current market cap and the foreseen CAGR and growth.


The 5 steps process:

Step 1: Secondary Research:

Secondary Research or Desk Research is as the name suggests is a research process wherein, we collect data through the readily available information. In this process we use various paid and unpaid databases which our team has access to and gather data through the same. This includes examining of listed companies’ annual reports, Journals, SEC filling etc. Apart from this our team has access to various associations across the globe across different industries. Lastly, we have exchange relationships with various university as well as individual libraries.

Secondary Research

Step 2: Primary Research

When we talk about primary research, it is a type of study in which the researchers collect relevant data samples directly, rather than relying on previously collected data.  This type of research is focused on gaining content specific facts that can be sued to solve specific problems. Since the collected data is fresh and first hand therefore it makes the study more accurate and genuine.

We at SNS Insider have divided Primary Research into 2 parts.

Part 1 wherein we interview the KOLs of major players as well as the upcoming ones across various geographic regions. This allows us to have their view over the market scenario and acts as an important tool to come closer to the accurate market numbers. As many as 45 paid and unpaid primary interviews are taken from both the demand and supply side of the industry to make sure we land at an accurate judgement and analysis of the market.

This step involves the triangulation of data wherein our team analyses the interview transcripts, online survey responses and observation of on filed participants. The below mentioned chart should give a better understanding of the part 1 of the primary interview.

Primary Research

Part 2: In this part of primary research the data collected via secondary research and the part 1 of the primary research is validated with the interviews from individual consultants and subject matter experts.

Consultants are those set of people who have at least 12 years of experience and expertise within the industry whereas Subject Matter Experts are those with at least 15 years of experience behind their back within the same space. The data with the help of two main processes i.e., FGDs (Focused Group Discussions) and IDs (Individual Discussions). This gives us a 3rd party nonbiased primary view of the market scenario making it a more dependable one while collation of the data pointers.

Step 3: Data Bank Validation

Once all the information is collected via primary and secondary sources, we run that information for data validation. At our intelligence centre our research heads track a lot of information related to the market which includes the quarterly reports, the daily stock prices, and other relevant information. Our data bank server gets updated every fortnight and that is how the information which we collected using our primary and secondary information is revalidated in real time.

Data Bank Validation

Step 4: QA/QC Process

After all the data collection and validation our team does a final level of quality check and quality assurance to get rid of any unwanted or undesired mistakes. This might include but not limited to getting rid of the any typos, duplication of numbers or missing of any important information. The people involved in this process include technical content writers, research heads and graphics people. Once this process is completed the title gets uploader on our platform for our clients to read it.

Step 5: Final QC/QA Process:

This is the last process and comes when the client has ordered the study. In this process a final QA/QC is done before the study is emailed to the client. Since we believe in giving our clients a good experience of our research studies, therefore, to make sure that we do not lack at our end in any way humanly possible we do a final round of quality check and then dispatch the study to the client.

Key Segments

By Product

  • Mercury-based Thermometers

  • Mercury-free Thermometers

    • Infrared Radiation Thermometers

    • Digital Thermometers

    • Others

By Application

  • Medical

  • Industrial

  • Food

  • Laboratory

  • Others

Request for Segment Customization as per your Business Requirement: Segment Customization Request

Regional Coverage:

North America

  • US

  • Canada

  • Mexico

Europe

  • Eastern Europe

    • Poland

    • Romania

    • Hungary

    • Turkey

    • Rest of Eastern Europe

  • Western Europe

    • Germany

    • France

    • UK

    • Italy

    • Spain

    • Netherlands

    • Switzerland

    • Austria

    • Rest of Western Europe

Asia Pacific

  • China

  • India

  • Japan

  • South Korea

  • Vietnam

  • Singapore

  • Australia

  • Rest of Asia Pacific

Middle East & Africa

  • Middle East

    • UAE

    • Egypt

    • Saudi Arabia

    • Qatar

    • Rest of Middle East

  • Africa

    • Nigeria

    • South Africa

    • Rest of Africa

Latin America

  • Brazil

  • Argentina

  • Colombia

  • Rest of Latin America

Request for Country Level Research Report: Country Level Customization Request

Available Customization

With the given market data, SNS Insider offers customization as per the company’s specific needs. The following customization options are available for the report:

  • Detailed Volume Analysis

  • Criss-Cross segment analysis (e.g. Product X Application)

  • Competitive Product Benchmarking

  • Geographic Analysis

  • Additional countries in any of the regions

  • Customized Data Representation

  • Detailed analysis and profiling of additional market players


  •            5000 (33% Discount)


  •            8950 (40% Discount)


  •            3050 (23% Discount)

Start a Conversation

Hi! Click one of our member below to chat on Phone