Thermoelectric Materials Market Size:
Get More Information on Thermoelectric Materials Market - Request Sample Report
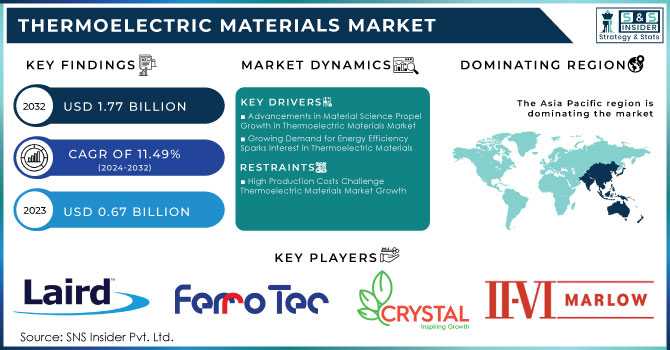
Thermoelectric Materials Market was valued at USD 0.67 billion in 2023 and is expected to reach USD 1.77 billion by 2032, growing at a CAGR of 11.49% from 2024-2032.
In many industries, there is an immediate demand for heat energy waste recovery with thermoelectric materials. Each year about 276 trillion British thermal units (TBtu) of heat is wasted throughout the U.S. from industrial processes that require heat at temperatures greater than 300°F—an even higher value of 1,478 TBtu year-wise when using a reference temperature of 77°F—indicating how significant these losses are and creating a need for efficient recovery solutions where thermoelectric materials may be useful to harvest parts of waste into added energy, making energy processes more effective.
The thermoelectric materials market is expanding as a result of numerous factors. For instance, in the case of the European Union alone, its longstanding and very ambitious climate targets call for at least a 40% share of renewable energy sources in the overall energy mix by 2030 compared to 32%. This change requires new technologies such as thermoelectric materials that can help carry out waste heat utilization in industrial and renewable energy processes. In addition, government expenditure on clean energy projects has increased by more than USD 500 billion since March 2022—bringing the total to over USD 1.2 trillion committed (or spent) so far during the COVID-19 pandemic. These financial commitments demonstrate a strong supportive environment for thermoelectric technologies.
In the long term, developments in thermoelectric materials will likely transform the energy sector. We use novel measurement techniques to demonstrate the enhanced performance of these materials as thermoelectric (TE) devices in terms of their key attributes: thermopower, thermal conductance, and electrical conductivity. The ongoing research and development of high-performance thermoelectric materials are therefore vital to accommodate this growing demand for effective energy solutions, supporting the transition towards a sustainable energy future.
MARKET DYNAMICS
DRIVERS
Advancements in Material Science Propel Growth in Thermoelectric Materials Market
This percolation effect improvement should boost the efficiency of the organic materials as thermoelectric materials, resulting in larger performance enhancements. Different nanocomposites synthesized also increase the CO₂ and oxygen photoreduction ability, which can further provide better thermoelectric properties. While this performance was driven by a broad array of low-carbon energy solutions, global investment reached an all-time high of USD 1.77 trillion in 2023, buoyed by electrified transport, renewable energy, and new technologies. China spent USD 676 billion on the measure but was still outdone in total by all EU and US plus U.K. packages combined. These initiatives highlight the growing emphasis on advanced materials that facilitate green energy transitions.
Growing Demand for Energy Efficiency Sparks Interest in Thermoelectric Materials
Increasing concern regarding the conservation of energy is one of the key driving force for the growth of the market, as thermoelectric materials are widely used to recover waste heat. More industries are realizing how economically and ecologically beneficial materials that transform excess heat into usable energy can be. This transition will improve efficiency and meet global sustainability objectives. With regulations becoming stricter alongside rising energy costs—with an estimated increase of US energy consumption set to rise nearly 15% by 2050, with monthly gas prices dropping 26.5% and electricity prices 13%—the need for novel solutions is more urgent than ever before. As a result, this commitment towards reduction in carbon footprints implemented by efficient utilization of resources is likely to increase the demand for the thermoelectric materials market significantly as businesses will be more reliant on energy-efficient technologies.
RESTRAINTS
High Production Costs Challenge Thermoelectric Materials Market Growth
The manufacturing of high-performance thermoelectric materials is generally limited by a costly fabrication process based on the use of expensive raw materials and/or complicated processing methods. Such financial constraints can discourage investment and hinder their incorporation into applications. The scale needed for production to meet growing market demand can be hindered by the complexity of their construction. With these economic challenges facing manufacturers, the situation calls for novel cost-reduction strategies to make thermoelectric technologies more affordable compared to traditional energy conversion systems. Therefore, the production high cost serves as a major hindrance for the thermoelectric materials market.
SEGMENT ANALYSIS
BY APPLICATION
Waste heat recovery dominated the thermoelectric materials market with approximately 47% of revenue in 2023. This dominance can be attributed to industries being more focused on energy efficiency and sustainability. Captured and converted into usable energy, waste heat is an increasingly vital resource as organizations seek to reduce operational costs and achieve carbon reductions. This also further strengthens such a trend with regulatory frameworks encouraging energy conservation.
Co-generation is expected to grow at the highest CAGR of around 12.65% during 2024–2032. This growth is fueled by the demand for waste heat recovery systems that combine both power and heating generation. One challenge these co-generation systems have is to make use of the same fuel source without producing waste. In addition, the improvement of technology is facilitating easy access to co-generation systems with economic procurement styles across all kinds of sectors.
BY END USE
The IT and telecom sector accounts for a leading share of the thermoelectric materials market, with nearly 28% revenue share in 2023. The industry's endless requirement for cooling solutions as well as energy management systems is the major reason behind this dominance. With the Continuous expansion of data centers and telecom infrastructure, it has become essential to reduce energy consumption as well as handle waste heat. Furthermore, the increasing pressure for sustainability with technology is another factor driving the trend toward thermoelectric materials.
The oil and gas industry is expected to grow over 12.63% CAGR between 2024 and 2032, making it the most vigorous area of growth. A large part of this growth is driven by rising investments in energy efficiency and waste heat recovery systems in the industry. With so many companies looking to distance themselves from traditional methods of operating, and having a level within their administration focus on reducing emissions, thermoelectric materials remain a reliable method of transforming excessive heat into something useful. The rapid development of extraction and processing technologies is pushing for precision thermoelectric applications in this area.
BY MATERIAL
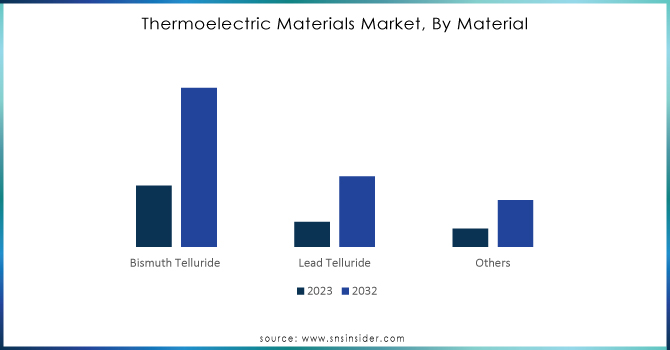
During 2023, bismuth telluride dominated the thermoelectric material market with approximately 59% of revenue. The root cause of this has to do with its unrivaled room-temperature thermoelectric performance, which makes it a very promising candidate for cooling and power generation. Well-developed and available processes for manufacturing make it even more attractive across multiple industries. It is also being researched to optimize its efficiency and extend its applicability.
In contrast, lead telluride is expected to record the highest compound annual growth rate (CAGR) of approximately 12.33% between 2024 and 2032. Much of the growth can be attributed to its much better performance at higher temperatures, which makes it a better fit for industrial applications and waste heat recovery systems. The rising importance of energy efficiency among industries is likely to contribute towards projected growth in the production of lead telluride for high-temperature applications. Lower material processing costs and better technologies are leading to adoption in a broader range of sectors.
Need Any Customization Research On Thermoelectric Materials Market - Inquiry Now
BY MODEL
Single stage dominated the Thermoelectric Materials market with the highest revenue share of about 57% in 2023. The supremacy of these devices is attributed to their simplicity, low-cost manufacturing, and convenience of application. They have also proved that they are especially efficient for low-temperature heat recovery and cooling applications, which makes them appealing at scale to both industrial and consumer markets. That clear history of existence and dependability they have enhanced their title.
While multi-stage thermoelectric systems are expected to follow with the fastest compounded annual growth rate (CAGR) of 12.04% between 2024 and 2032. This growth is driven by the rising requirement of high efficiency and improved performance in energy conversion applications. Multi-stage Derived systems are specifically designed to generate electricity from high-temperature sources which makes them preferable for waste heat recovery and industrial applications. Over time, as industries look for new and original ways to provide energy efficiency at its maximum capacity, multi-stage systems will be adopted more and more strongly.
REGIONAL ANALYSIS
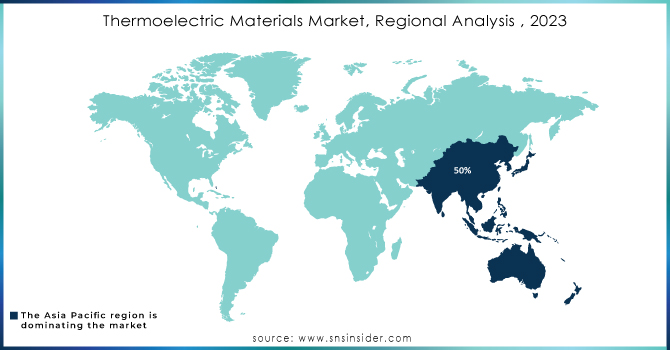
APAC controls about 50% of the entire thermoelectric materials market revenue in 2023. China and India being the fastest-growing industrialized countries, account for their ability to grab this dominance with the help of energy efficiency. Substantial investments and infrastructure supporting renewable energy sources, along with advanced waste heat recovery technologies reinforce regional markets. Moreover, government support for sustainable practices is further driving the market of thermoelectric solutions in multiple industries.
On the other hand, North America will see the highest compound annual growth rate (CAGR), approximately 12.33% during 2024 – 2032. Well, this is because of the surge in investment in clean energy technologies and growing interest in energy efficiency. A well-established R&D infrastructure in the region enables innovation about thermoelectric materials that make these economical and efficient. The growing need for advanced thermoelectric solutions in North America will significantly increase as businesses and governments focus more on sustainability initiatives.
LATEST NEWS-
On June 3, 2024, Laird Thermal Systems launched a new generation of high-performance thermoelectric cooler assemblies with next-generation thermoelectric coolers made from advanced semiconductor materials.
Published in 2024, a research group created an artificially engineered atomic-scale defect in a bismuth telluride (Bi-Te) thermoelectric material to serve as a hopeful improvement for effective waste thermal energy capture.
KEY PLAYERS
Laird Thermal Systems, Inc. (Laird Thermal Solutions, Thermoelectric Modules)
Thermonamic Electronics (Jiangxi) Corp., Ltd. (Thermoelectric Generators, Peltier Modules)
Ferrotec (USA) Corporation (Thermoelectric Coolers, Thermoelectric Modules)
EVERREDtronics Ltd. (Thermoelectric Cooling Solutions, Peltier Elements)
Hi-Z Technology (Hi-Z Thermoelectric Modules, Thermoelectric Generators)
Crystal Ltd. (Crystal Thermoelectric Modules, Peltier Devices)
TEC Microsystems GmbH (TEC Microsystems Peltier Modules, Thermoelectric Generators)
Xiamen Hicool Electronics Co., Ltd. (Hicool Peltier Modules, Thermoelectric Cooling Devices)
Marlow Industries, Inc. (Marlow Thermoelectric Modules, Thermoelectric Generators)
Ferrotec Corporation (Ferrotec Thermoelectric Coolers, Peltier Devices)
II-VI Incorporated (II-VI Thermoelectric Modules, Advanced Peltier Solutions)
KELK Ltd. (KELK Thermoelectric Devices, Custom Cooling Solutions)
RMT Ltd. (RMT Peltier Modules, Thermoelectric Cooling Units)
TEGPRO Thermoelectric Generator Company (TEGPRO Thermoelectric Generators, Thermoelectric Power Systems)
Kryotherm (Kryotherm Thermoelectric Modules, Advanced Cooling Solutions)
Thermion Company (Thermion Thermoelectric Modules, Peltier Devices)
Yamaha Corporation (Yamaha Thermoelectric Generators, Cooling Systems)
Gentherm Incorporated (Gentherm Thermoelectric Seats, Automotive Thermal Management Systems)
Alphabet Energy (Alphabet Energy Generators, Thermoelectric Modules)
Report Attributes | Details |
---|---|
Market Size in 2023 | USD 0.67 Billion |
Market Size by 2032 | USD 1.77 Billion |
CAGR | CAGR of 11.49% From 2024 to 2032 |
Base Year | 2023 |
Forecast Period | 2024-2032 |
Historical Data | 2020-2022 |
Report Scope & Coverage | Market Size, Segments Analysis, Competitive Landscape, Regional Analysis, DROC & SWOT Analysis, Forecast Outlook |
Key Segments | • By Material (Bismuth Telluride, Lead Telluride, Others) • By Application (Waste Heat Recovery, Energy Harvesting, Direct Power Generation, Co-generation) • By End-use (Consumer Electronics, Manufacturing and Industrial, IT and Telecom, Automotive, Healthcare, Aerospace, Oil and Gas) • By Model (Single Stage, Multi-Stage) |
Regional Analysis/Coverage | North America (US, Canada, Mexico), Europe (Eastern Europe [Poland, Romania, Hungary, Turkey, Rest of Eastern Europe] Western Europe] Germany, France, UK, Italy, Spain, Netherlands, Switzerland, Austria, Rest of Western Europe]), Asia Pacific (China, India, Japan, South Korea, Vietnam, Singapore, Australia, Rest of Asia Pacific), Middle East & Africa (Middle East [UAE, Egypt, Saudi Arabia, Qatar, Rest of Middle East], Africa [Nigeria, South Africa, Rest of Africa], Latin America (Brazil, Argentina, Colombia, Rest of Latin America) |
Company Profiles | Laird Thermal Systems, Inc., Thermonamic Electronics (Jiangxi) Corp., Ltd., Ferrotec (USA) Corporation, EVERREDtronics Ltd., Hi-Z Technology, Crystal Ltd., TEC Microsystems GmbH, Xiamen Hicool Electronics Co., Ltd., Marlow Industries, Inc., Ferrotec Corporation, II-VI Incorporated, KELK Ltd., RMT Ltd., TEGPRO Thermoelectric Generator Company, Kryotherm, Thermion Company, Yamaha Corporation, Gentherm Incorporated, Alphabet Energy |
Key Drivers | • Advancements in Material Science Propel Growth in Thermoelectric Materials Market • Growing Demand for Energy Efficiency Sparks Interest in Thermoelectric Materials |
Restraints | • High Production Costs Challenge Thermoelectric Materials Market Growth |
Ans: Thermoelectric Materials Market was valued at USD 0.67 billion in 2023 and is expected to reach USD 1.77 billion by 2032, growing at a CAGR of 11.49% from 2024-2032.
Ans: Approximately 276 trillion British thermal units (TBtu) of heat is wasted from industrial processes annually.
Ans: The demand for systems that efficiently combine power and heat generation is driving co-generation growth.
Ans: Bismuth telluride led the market with approximately 59% of revenue in 2023.
Ans: Asia Pacific controls about 50% of the market revenue in 2023.
1. Introduction
1.1 Market Definition
1.2 Scope (Inclusion and Exclusions)
1.3 Research Assumptions
2. Executive Summary
2.1 Market Overview
2.2 Regional Synopsis
2.3 Competitive Summary
3. Research Methodology
3.1 Top-Down Approach
3.2 Bottom-up Approach
3.3. Data Validation
3.4 Primary Interviews
4. Market Dynamics Impact Analysis
4.1 Market Driving Factors Analysis
4.1.1 Drivers
4.1.2 Restraints
4.1.3 Opportunities
4.1.4 Challenges
4.2 PESTLE Analysis
4.3 Porter’s Five Forces Model
5. Statistical Insights and Trends Reporting
5.1 Production Capacity and Utilization, by Country, by Type, 2023
5.2 Feedstock Prices, by Country, by Type, 2023
5.3 Regulatory Impact, by Country, by Type, 2023
5.4 Environmental Metrics: Emissions Data, Waste Management Practices, and Sustainability Initiatives, by Region
5.5 Innovation and R&D, by Type, 2023
6. Competitive Landscape
6.1 List of Major Companies, By Region
6.2 Market Share Analysis, By Region
6.3 Product Benchmarking
6.3.1 Product specifications and features
6.3.2 Pricing
6.4 Strategic Initiatives
6.4.1 Marketing and promotional activities
6.4.2 Distribution and supply chain strategies
6.4.3 Expansion plans and new product launches
6.4.4 Strategic partnerships and collaborations
6.5 Technological Advancements
6.6 Market Positioning and Branding
7. Thermoelectric Materials Market Segmentation, by Model
7.1 Chapter Overview
7.2 Single Stage
7.2.1 Single Stage Market Trends Analysis (2020-2032)
7.2.2 Single Stage Market Size Estimates and Forecasts to 2032 (USD Billion)
7.3 Multi Stage
7.3.1 Multi Stage Market Trends Analysis (2020-2032)
7.3.2 Multi Stage Market Size Estimates and Forecasts to 2032 (USD Billion)
8. Thermoelectric Materials Market Segmentation, by Application
8.1 Chapter Overview
8.2 Waste Heat Recovery
8.2.1 Waste Heat Recovery Market Trends Analysis (2020-2032)
8.2.2 Waste Heat Recovery Market Size Estimates and Forecasts to 2032 (USD Billion)
8.3 Energy Harvesting
8.3.1 Energy Harvesting Market Trends Analysis (2020-2032)
8.3.2 Energy Harvesting Market Size Estimates and Forecasts to 2032 (USD Billion)
8.4 Direct Power Generation
8.4.1 Direct Power Generation Market Trends Analysis (2020-2032)
8.4.2 Direct Power Generation Market Size Estimates and Forecasts to 2032 (USD Billion)
8.5 Co-generation
8.5.1 Co-generation Market Trends Analysis (2020-2032)
8.5.2 Co-generation Market Size Estimates and Forecasts to 2032 (USD Billion)
9. Thermoelectric Materials Market Segmentation, by End Use
9.1 Chapter Overview
9.2 Consumer Electronics
9.2.1 Consumer Electronics Market Trends Analysis (2020-2032)
9.2.2 Consumer Electronics Market Size Estimates and Forecasts to 2032 (USD Billion)
9.3 Manufacturing and Industrial
9.3.1 Manufacturing and Industrial Market Trends Analysis (2020-2032)
9.3.2 Manufacturing and Industrial Market Size Estimates and Forecasts to 2032 (USD Billion)
9.4 IT and Telecom
9.4.1 IT and Telecom Market Trends Analysis (2020-2032)
9.4.2 IT and Telecom Market Size Estimates and Forecasts to 2032 (USD Billion)
9.5 Automotive
9.5.1 Automotive Market Trends Analysis (2020-2032)
9.5.2 Automotive Market Size Estimates and Forecasts to 2032 (USD Billion)
9.6 Healthcare
9.6.1 Healthcare Market Trends Analysis (2020-2032)
9.6.2 Healthcare Market Size Estimates and Forecasts to 2032 (USD Billion)
9.7 Aerospace
9.7.1 Aerospace Market Trends Analysis (2020-2032)
9.7.2 Aerospace Market Size Estimates and Forecasts to 2032 (USD Billion)
9.8 Oil and Gas
9.8.1 Oil and Gas Market Trends Analysis (2020-2032)
9.8.2 Oil and Gas Market Size Estimates and Forecasts to 2032 (USD Billion)
10. Thermoelectric Materials Market Segmentation, by Material
10.1 Chapter Overview
10.2 Bismuth Telluride
10.2.1 Bismuth Telluride Market Trends Analysis (2020-2032)
10.2.2 Bismuth Telluride Market Size Estimates and Forecasts to 2032 (USD Billion)
10.3 Lead Telluride
10.3.1 Lead Telluride Market Trends Analysis (2020-2032)
10.3.2 Lead Telluride Market Size Estimates and Forecasts to 2032 (USD Billion)
10.4 Others
10.4.1 Others Market Trends Analysis (2020-2032)
10.4.2 Others Market Size Estimates and Forecasts to 2032 (USD Billion)
11. Regional Analysis
11.1 Chapter Overview
11.2 North America
11.2.1 Trends Analysis
11.2.2 North America Thermoelectric Materials Market Estimates and Forecasts, by Country (2020-2032) (USD Billion)
11.2.3 North America Thermoelectric Materials Market Estimates and Forecasts, by Model (2020-2032) (USD Billion)
11.2.4 North America Thermoelectric Materials Market Estimates and Forecasts, by Application (2020-2032) (USD Billion)
11.2.5 North America Thermoelectric Materials Market Estimates and Forecasts, by End Use (2020-2032) (USD Billion)
11.2.6 North America Thermoelectric Materials Market Estimates and Forecasts, by Material (2020-2032) (USD Billion)
11.2.7 USA
11.2.7.1 USA Thermoelectric Materials Market Estimates and Forecasts, by Model (2020-2032) (USD Billion)
11.2.7.2 USA Thermoelectric Materials Market Estimates and Forecasts, by Application (2020-2032) (USD Billion)
11.2.7.3 USA Thermoelectric Materials Market Estimates and Forecasts, by End Use (2020-2032) (USD Billion)
11.2.7.4 USA Thermoelectric Materials Market Estimates and Forecasts, by Material (2020-2032) (USD Billion)
11.2.8 Canada
11.2.8.1 Canada Thermoelectric Materials Market Estimates and Forecasts, by Model (2020-2032) (USD Billion)
11.2.8.2 Canada Thermoelectric Materials Market Estimates and Forecasts, by Application (2020-2032) (USD Billion)
11.2.8.3 Canada Thermoelectric Materials Market Estimates and Forecasts, by End Use (2020-2032) (USD Billion)
11.2.8.4 Canada Thermoelectric Materials Market Estimates and Forecasts, by Material (2020-2032) (USD Billion)
11.2.9 Mexico
11.2.9.1 Mexico Thermoelectric Materials Market Estimates and Forecasts, by Model (2020-2032) (USD Billion)
11.2.9.2 Mexico Thermoelectric Materials Market Estimates and Forecasts, by Application (2020-2032) (USD Billion)
11.2.9.3 Mexico Thermoelectric Materials Market Estimates and Forecasts, by End Use (2020-2032) (USD Billion)
11.2.9.4 Mexico Thermoelectric Materials Market Estimates and Forecasts, by Material (2020-2032) (USD Billion)
11.3 Europe
11.3.1 Eastern Europe
11.3.1.1 Trends Analysis
11.3.1.2 Eastern Europe Thermoelectric Materials Market Estimates and Forecasts, by Country (2020-2032) (USD Billion)
11.3.1.3 Eastern Europe Thermoelectric Materials Market Estimates and Forecasts, by Model (2020-2032) (USD Billion)
11.3.1.4 Eastern Europe Thermoelectric Materials Market Estimates and Forecasts, by Application (2020-2032) (USD Billion)
11.3.1.5 Eastern Europe Thermoelectric Materials Market Estimates and Forecasts, by End Use (2020-2032) (USD Billion)
11.3.1.6 Eastern Europe Thermoelectric Materials Market Estimates and Forecasts, by Material (2020-2032) (USD Billion)
11.3.1.7 Poland
11.3.1.7.1 Poland Thermoelectric Materials Market Estimates and Forecasts, by Model (2020-2032) (USD Billion)
11.3.1.7.2 Poland Thermoelectric Materials Market Estimates and Forecasts, by Application (2020-2032) (USD Billion)
11.3.1.7.3 Poland Thermoelectric Materials Market Estimates and Forecasts, by End Use (2020-2032) (USD Billion)
11.3.1.7.4 Poland Thermoelectric Materials Market Estimates and Forecasts, by Material (2020-2032) (USD Billion)
11.3.1.8 Romania
11.3.1.8.1 Romania Thermoelectric Materials Market Estimates and Forecasts, by Model (2020-2032) (USD Billion)
11.3.1.8.2 Romania Thermoelectric Materials Market Estimates and Forecasts, by Application (2020-2032) (USD Billion)
11.3.1.8.3 Romania Thermoelectric Materials Market Estimates and Forecasts, by End Use (2020-2032) (USD Billion)
11.3.1.8.4 Romania Thermoelectric Materials Market Estimates and Forecasts, by Material (2020-2032) (USD Billion)
11.3.1.9 Hungary
11.3.1.9.1 Hungary Thermoelectric Materials Market Estimates and Forecasts, by Model (2020-2032) (USD Billion)
11.3.1.9.2 Hungary Thermoelectric Materials Market Estimates and Forecasts, by Application (2020-2032) (USD Billion)
11.3.1.9.3 Hungary Thermoelectric Materials Market Estimates and Forecasts, by End Use (2020-2032) (USD Billion)
11.3.1.9.4 Hungary Thermoelectric Materials Market Estimates and Forecasts, by Material (2020-2032) (USD Billion)
11.3.1.10 Turkey
11.3.1.10.1 Turkey Thermoelectric Materials Market Estimates and Forecasts, by Model (2020-2032) (USD Billion)
11.3.1.10.2 Turkey Thermoelectric Materials Market Estimates and Forecasts, by Application (2020-2032) (USD Billion)
11.3.1.10.3 Turkey Thermoelectric Materials Market Estimates and Forecasts, by End Use (2020-2032) (USD Billion)
11.3.1.10.4 Turkey Thermoelectric Materials Market Estimates and Forecasts, by Material (2020-2032) (USD Billion)
11.3.1.11 Rest of Eastern Europe
11.3.1.11.1 Rest of Eastern Europe Thermoelectric Materials Market Estimates and Forecasts, by Model (2020-2032) (USD Billion)
11.3.1.11.2 Rest of Eastern Europe Thermoelectric Materials Market Estimates and Forecasts, by Application (2020-2032) (USD Billion)
11.3.1.11.3 Rest of Eastern Europe Thermoelectric Materials Market Estimates and Forecasts, by End Use (2020-2032) (USD Billion)
11.3.1.11.4 Rest of Eastern Europe Thermoelectric Materials Market Estimates and Forecasts, by Material (2020-2032) (USD Billion)
11.3.2 Western Europe
11.3.2.1 Trends Analysis
11.3.2.2 Western Europe Thermoelectric Materials Market Estimates and Forecasts, by Country (2020-2032) (USD Billion)
11.3.2.3 Western Europe Thermoelectric Materials Market Estimates and Forecasts, by Model (2020-2032) (USD Billion)
11.3.2.4 Western Europe Thermoelectric Materials Market Estimates and Forecasts, by Application (2020-2032) (USD Billion)
11.3.2.5 Western Europe Thermoelectric Materials Market Estimates and Forecasts, by End Use (2020-2032) (USD Billion)
11.3.2.6 Western Europe Thermoelectric Materials Market Estimates and Forecasts, by Material (2020-2032) (USD Billion)
11.3.2.7 Germany
11.3.2.7.1 Germany Thermoelectric Materials Market Estimates and Forecasts, by Model (2020-2032) (USD Billion)
11.3.2.7.2 Germany Thermoelectric Materials Market Estimates and Forecasts, by Application (2020-2032) (USD Billion)
11.3.2.7.3 Germany Thermoelectric Materials Market Estimates and Forecasts, by End Use (2020-2032) (USD Billion)
11.3.2.7.4 Germany Thermoelectric Materials Market Estimates and Forecasts, by Material (2020-2032) (USD Billion)
11.3.2.8 France
11.3.2.8.1 France Thermoelectric Materials Market Estimates and Forecasts, by Model (2020-2032) (USD Billion)
11.3.2.8.2 France Thermoelectric Materials Market Estimates and Forecasts, by Application (2020-2032) (USD Billion)
11.3.2.8.3 France Thermoelectric Materials Market Estimates and Forecasts, by End Use (2020-2032) (USD Billion)
11.3.2.8.4 France Thermoelectric Materials Market Estimates and Forecasts, by Material (2020-2032) (USD Billion)
11.3.2.9 UK
11.3.2.9.1 UK Thermoelectric Materials Market Estimates and Forecasts, by Model (2020-2032) (USD Billion)
11.3.2.9.2 UK Thermoelectric Materials Market Estimates and Forecasts, by Application (2020-2032) (USD Billion)
11.3.2.9.3 UK Thermoelectric Materials Market Estimates and Forecasts, by End Use (2020-2032) (USD Billion)
11.3.2.9.4 UK Thermoelectric Materials Market Estimates and Forecasts, by Material (2020-2032) (USD Billion)
11.3.2.10 Italy
11.3.2.10.1 Italy Thermoelectric Materials Market Estimates and Forecasts, by Model (2020-2032) (USD Billion)
11.3.2.10.2 Italy Thermoelectric Materials Market Estimates and Forecasts, by Application (2020-2032) (USD Billion)
11.3.2.10.3 Italy Thermoelectric Materials Market Estimates and Forecasts, by End Use (2020-2032) (USD Billion)
11.3.2.10.4 Italy Thermoelectric Materials Market Estimates and Forecasts, by Material (2020-2032) (USD Billion)
11.3.2.11 Spain
11.3.2.11.1 Spain Thermoelectric Materials Market Estimates and Forecasts, by Model (2020-2032) (USD Billion)
11.3.2.11.2 Spain Thermoelectric Materials Market Estimates and Forecasts, by Application (2020-2032) (USD Billion)
11.3.2.11.3 Spain Thermoelectric Materials Market Estimates and Forecasts, by End Use (2020-2032) (USD Billion)
11.3.2.11.4 Spain Thermoelectric Materials Market Estimates and Forecasts, by Material (2020-2032) (USD Billion)
11.3.2.12 Netherlands
11.3.2.12.1 Netherlands Thermoelectric Materials Market Estimates and Forecasts, by Model (2020-2032) (USD Billion)
11.3.2.12.2 Netherlands Thermoelectric Materials Market Estimates and Forecasts, by Application (2020-2032) (USD Billion)
11.3.2.12.3 Netherlands Thermoelectric Materials Market Estimates and Forecasts, by End Use (2020-2032) (USD Billion)
11.3.2.12.4 Netherlands Thermoelectric Materials Market Estimates and Forecasts, by Material (2020-2032) (USD Billion)
11.3.2.13 Switzerland
11.3.2.13.1 Switzerland Thermoelectric Materials Market Estimates and Forecasts, by Model (2020-2032) (USD Billion)
11.3.2.13.2 Switzerland Thermoelectric Materials Market Estimates and Forecasts, by Application (2020-2032) (USD Billion)
11.3.2.13.3 Switzerland Thermoelectric Materials Market Estimates and Forecasts, by End Use (2020-2032) (USD Billion)
11.3.2.13.4 Switzerland Thermoelectric Materials Market Estimates and Forecasts, by Material (2020-2032) (USD Billion)
11.3.2.14 Austria
11.3.2.14.1 Austria Thermoelectric Materials Market Estimates and Forecasts, by Model (2020-2032) (USD Billion)
11.3.2.14.2 Austria Thermoelectric Materials Market Estimates and Forecasts, by Application (2020-2032) (USD Billion)
11.3.2.14.3 Austria Thermoelectric Materials Market Estimates and Forecasts, by End Use (2020-2032) (USD Billion)
11.3.2.14.4 Austria Thermoelectric Materials Market Estimates and Forecasts, by Material (2020-2032) (USD Billion)
11.3.2.15 Rest of Western Europe
11.3.2.15.1 Rest of Western Europe Thermoelectric Materials Market Estimates and Forecasts, by Model (2020-2032) (USD Billion)
11.3.2.15.2 Rest of Western Europe Thermoelectric Materials Market Estimates and Forecasts, by Application (2020-2032) (USD Billion)
11.3.2.15.3 Rest of Western Europe Thermoelectric Materials Market Estimates and Forecasts, by End Use (2020-2032) (USD Billion)
11.3.2.15.4 Rest of Western Europe Thermoelectric Materials Market Estimates and Forecasts, by Material (2020-2032) (USD Billion)
11.4 Asia Pacific
11.4.1 Trends Analysis
11.4.2 Asia Pacific Thermoelectric Materials Market Estimates and Forecasts, by Country (2020-2032) (USD Billion)
11.4.3 Asia Pacific Thermoelectric Materials Market Estimates and Forecasts, by Model (2020-2032) (USD Billion)
11.4.4 Asia Pacific Thermoelectric Materials Market Estimates and Forecasts, by Application (2020-2032) (USD Billion)
11.4.5 Asia Pacific Thermoelectric Materials Market Estimates and Forecasts, by End Use (2020-2032) (USD Billion)
11.4.6 Asia Pacific Thermoelectric Materials Market Estimates and Forecasts, by Material (2020-2032) (USD Billion)
11.4.7 China
11.4.7.1 China Thermoelectric Materials Market Estimates and Forecasts, by Model (2020-2032) (USD Billion)
11.4.7.2 China Thermoelectric Materials Market Estimates and Forecasts, by Application (2020-2032) (USD Billion)
11.4.7.3 China Thermoelectric Materials Market Estimates and Forecasts, by End Use (2020-2032) (USD Billion)
11.4.7.4 China Thermoelectric Materials Market Estimates and Forecasts, by Material (2020-2032) (USD Billion)
11.4.8 India
11.4.8.1 India Thermoelectric Materials Market Estimates and Forecasts, by Model (2020-2032) (USD Billion)
11.4.8.2 India Thermoelectric Materials Market Estimates and Forecasts, by Application (2020-2032) (USD Billion)
11.4.8.3 India Thermoelectric Materials Market Estimates and Forecasts, by End Use (2020-2032) (USD Billion)
11.4.8.4 India Thermoelectric Materials Market Estimates and Forecasts, by Material (2020-2032) (USD Billion)
11.4.9 Japan
11.4.9.1 Japan Thermoelectric Materials Market Estimates and Forecasts, by Model (2020-2032) (USD Billion)
11.4.9.2 Japan Thermoelectric Materials Market Estimates and Forecasts, by Application (2020-2032) (USD Billion)
11.4.9.3 Japan Thermoelectric Materials Market Estimates and Forecasts, by End Use (2020-2032) (USD Billion)
11.4.9.4 Japan Thermoelectric Materials Market Estimates and Forecasts, by Material (2020-2032) (USD Billion)
11.4.10 South Korea
11.4.10.1 South Korea Thermoelectric Materials Market Estimates and Forecasts, by Model (2020-2032) (USD Billion)
11.4.10.2 South Korea Thermoelectric Materials Market Estimates and Forecasts, by Application (2020-2032) (USD Billion)
11.4.10.3 South Korea Thermoelectric Materials Market Estimates and Forecasts, by End Use (2020-2032) (USD Billion)
11.4.10.4 South Korea Thermoelectric Materials Market Estimates and Forecasts, by Material (2020-2032) (USD Billion)
11.4.11 Vietnam
11.4.11.1 Vietnam Thermoelectric Materials Market Estimates and Forecasts, by Model (2020-2032) (USD Billion)
11.4.11.2 Vietnam Thermoelectric Materials Market Estimates and Forecasts, by Application (2020-2032) (USD Billion)
11.4.11.3 Vietnam Thermoelectric Materials Market Estimates and Forecasts, by End Use (2020-2032) (USD Billion)
11.4.11.4 Vietnam Thermoelectric Materials Market Estimates and Forecasts, by Material (2020-2032) (USD Billion)
11.4.12 Singapore
11.4.12.1 Singapore Thermoelectric Materials Market Estimates and Forecasts, by Model (2020-2032) (USD Billion)
11.4.12.2 Singapore Thermoelectric Materials Market Estimates and Forecasts, by Application (2020-2032) (USD Billion)
11.4.12.3 Singapore Thermoelectric Materials Market Estimates and Forecasts, by End Use (2020-2032) (USD Billion)
11.4.12.4 Singapore Thermoelectric Materials Market Estimates and Forecasts, by Material (2020-2032) (USD Billion)
11.4.13 Australia
11.4.13.1 Australia Thermoelectric Materials Market Estimates and Forecasts, by Model (2020-2032) (USD Billion)
11.4.13.2 Australia Thermoelectric Materials Market Estimates and Forecasts, by Application (2020-2032) (USD Billion)
11.4.13.3 Australia Thermoelectric Materials Market Estimates and Forecasts, by End Use (2020-2032) (USD Billion)
11.4.13.4 Australia Thermoelectric Materials Market Estimates and Forecasts, by Material (2020-2032) (USD Billion)
11.4.14 Rest of Asia Pacific
11.4.14.1 Rest of Asia Pacific Thermoelectric Materials Market Estimates and Forecasts, by Model (2020-2032) (USD Billion)
11.4.14.2 Rest of Asia Pacific Thermoelectric Materials Market Estimates and Forecasts, by Application (2020-2032) (USD Billion)
11.4.14.3 Rest of Asia Pacific Thermoelectric Materials Market Estimates and Forecasts, by End Use (2020-2032) (USD Billion)
11.4.14.4 Rest of Asia Pacific Thermoelectric Materials Market Estimates and Forecasts, by Material (2020-2032) (USD Billion)
11.5 Middle East and Africa
11.5.1 Middle East
11.5.1.1 Trends Analysis
11.5.1.2 Middle East Thermoelectric Materials Market Estimates and Forecasts, by Country (2020-2032) (USD Billion)
11.5.1.3 Middle East Thermoelectric Materials Market Estimates and Forecasts, by Model (2020-2032) (USD Billion)
11.5.1.4 Middle East Thermoelectric Materials Market Estimates and Forecasts, by Application (2020-2032) (USD Billion)
11.5.1.5 Middle East Thermoelectric Materials Market Estimates and Forecasts, by End Use (2020-2032) (USD Billion)
11.5.1.6 Middle East Thermoelectric Materials Market Estimates and Forecasts, by Material (2020-2032) (USD Billion)
11.5.1.7 UAE
11.5.1.7.1 UAE Thermoelectric Materials Market Estimates and Forecasts, by Model (2020-2032) (USD Billion)
11.5.1.7.2 UAE Thermoelectric Materials Market Estimates and Forecasts, by Application (2020-2032) (USD Billion)
11.5.1.7.3 UAE Thermoelectric Materials Market Estimates and Forecasts, by End Use (2020-2032) (USD Billion)
11.5.1.7.4 UAE Thermoelectric Materials Market Estimates and Forecasts, by Material (2020-2032) (USD Billion)
11.5.1.8 Egypt
11.5.1.8.1 Egypt Thermoelectric Materials Market Estimates and Forecasts, by Model (2020-2032) (USD Billion)
11.5.1.8.2 Egypt Thermoelectric Materials Market Estimates and Forecasts, by Application (2020-2032) (USD Billion)
11.5.1.8.3 Egypt Thermoelectric Materials Market Estimates and Forecasts, by End Use (2020-2032) (USD Billion)
11.5.1.8.4 Egypt Thermoelectric Materials Market Estimates and Forecasts, by Material (2020-2032) (USD Billion)
11.5.1.9 Saudi Arabia
11.5.1.9.1 Saudi Arabia Thermoelectric Materials Market Estimates and Forecasts, by Model (2020-2032) (USD Billion)
11.5.1.9.2 Saudi Arabia Thermoelectric Materials Market Estimates and Forecasts, by Application (2020-2032) (USD Billion)
11.5.1.9.3 Saudi Arabia Thermoelectric Materials Market Estimates and Forecasts, by End Use (2020-2032) (USD Billion)
11.5.1.9.4 Saudi Arabia Thermoelectric Materials Market Estimates and Forecasts, by Material (2020-2032) (USD Billion)
11.5.1.10 Qatar
11.5.1.10.1 Qatar Thermoelectric Materials Market Estimates and Forecasts, by Model (2020-2032) (USD Billion)
11.5.1.10.2 Qatar Thermoelectric Materials Market Estimates and Forecasts, by Application (2020-2032) (USD Billion)
11.5.1.10.3 Qatar Thermoelectric Materials Market Estimates and Forecasts, by End Use (2020-2032) (USD Billion)
11.5.1.10.4 Qatar Thermoelectric Materials Market Estimates and Forecasts, by Material (2020-2032) (USD Billion)
11.5.1.11 Rest of Middle East
11.5.1.11.1 Rest of Middle East Thermoelectric Materials Market Estimates and Forecasts, by Model (2020-2032) (USD Billion)
11.5.1.11.2 Rest of Middle East Thermoelectric Materials Market Estimates and Forecasts, by Application (2020-2032) (USD Billion)
11.5.1.11.3 Rest of Middle East Thermoelectric Materials Market Estimates and Forecasts, by End Use (2020-2032) (USD Billion)
11.5.1.11.4 Rest of Middle East Thermoelectric Materials Market Estimates and Forecasts, by Material (2020-2032) (USD Billion)
11.5.2 Africa
11.5.2.1 Trends Analysis
11.5.2.2 Africa Thermoelectric Materials Market Estimates and Forecasts, by Country (2020-2032) (USD Billion)
11.5.2.3 Africa Thermoelectric Materials Market Estimates and Forecasts, by Model (2020-2032) (USD Billion)
11.5.2.4 Africa Thermoelectric Materials Market Estimates and Forecasts, by Application (2020-2032) (USD Billion)
11.5.2.5 Africa Thermoelectric Materials Market Estimates and Forecasts, by End Use (2020-2032) (USD Billion)
11.5.2.6 Africa Thermoelectric Materials Market Estimates and Forecasts, by Material (2020-2032) (USD Billion)
11.5.2.7 South Africa
11.5.2.7.1 South Africa Thermoelectric Materials Market Estimates and Forecasts, by Model (2020-2032) (USD Billion)
11.5.2.7.2 South Africa Thermoelectric Materials Market Estimates and Forecasts, by Application (2020-2032) (USD Billion)
11.5.2.7.3 South Africa Thermoelectric Materials Market Estimates and Forecasts, by End Use (2020-2032) (USD Billion)
11.5.2.7.4 South Africa Thermoelectric Materials Market Estimates and Forecasts, by Material (2020-2032) (USD Billion)
11.5.2.8 Nigeria
11.5.2.8.1 Nigeria Thermoelectric Materials Market Estimates and Forecasts, by Model (2020-2032) (USD Billion)
11.5.2.8.2 Nigeria Thermoelectric Materials Market Estimates and Forecasts, by Application (2020-2032) (USD Billion)
11.5.2.8.3 Nigeria Thermoelectric Materials Market Estimates and Forecasts, by End Use (2020-2032) (USD Billion)
11.5.2.8.4 Nigeria Thermoelectric Materials Market Estimates and Forecasts, by Material (2020-2032) (USD Billion)
11.5.2.9 Rest of Africa
11.5.2.9.1 Rest of Africa Thermoelectric Materials Market Estimates and Forecasts, by Model (2020-2032) (USD Billion)
11.5.2.9.2 Rest of Africa Thermoelectric Materials Market Estimates and Forecasts, by Application (2020-2032) (USD Billion)
11.5.2.9.3 Rest of Africa Thermoelectric Materials Market Estimates and Forecasts, by End Use (2020-2032) (USD Billion)
11.5.2.9.4 Rest of Africa Thermoelectric Materials Market Estimates and Forecasts, by Material (2020-2032) (USD Billion)
11.6 Latin America
11.6.1 Trends Analysis
11.6.2 Latin America Thermoelectric Materials Market Estimates and Forecasts, by Country (2020-2032) (USD Billion)
11.6.3 Latin America Thermoelectric Materials Market Estimates and Forecasts, by Model (2020-2032) (USD Billion)
11.6.4 Latin America Thermoelectric Materials Market Estimates and Forecasts, by Application (2020-2032) (USD Billion)
11.6.5 Latin America Thermoelectric Materials Market Estimates and Forecasts, by End Use (2020-2032) (USD Billion)
11.6.6 Latin America Thermoelectric Materials Market Estimates and Forecasts, by Material (2020-2032) (USD Billion)
11.6.7 Brazil
11.6.7.1 Brazil Thermoelectric Materials Market Estimates and Forecasts, by Model (2020-2032) (USD Billion)
11.6.7.2 Brazil Thermoelectric Materials Market Estimates and Forecasts, by Application (2020-2032) (USD Billion)
11.6.7.3 Brazil Thermoelectric Materials Market Estimates and Forecasts, by End Use (2020-2032) (USD Billion)
11.6.7.4 Brazil Thermoelectric Materials Market Estimates and Forecasts, by Material (2020-2032) (USD Billion)
11.6.8 Argentina
11.6.8.1 Argentina Thermoelectric Materials Market Estimates and Forecasts, by Model (2020-2032) (USD Billion)
11.6.8.2 Argentina Thermoelectric Materials Market Estimates and Forecasts, by Application (2020-2032) (USD Billion)
11.6.8.3 Argentina Thermoelectric Materials Market Estimates and Forecasts, by End Use (2020-2032) (USD Billion)
11.6.8.4 Argentina Thermoelectric Materials Market Estimates and Forecasts, by Material (2020-2032) (USD Billion)
11.6.9 Colombia
11.6.9.1 Colombia Thermoelectric Materials Market Estimates and Forecasts, by Model (2020-2032) (USD Billion)
11.6.9.2 Colombia Thermoelectric Materials Market Estimates and Forecasts, by Application (2020-2032) (USD Billion)
11.6.9.3 Colombia Thermoelectric Materials Market Estimates and Forecasts, by End Use (2020-2032) (USD Billion)
11.6.9.4 Colombia Thermoelectric Materials Market Estimates and Forecasts, by Material (2020-2032) (USD Billion)
11.6.10 Rest of Latin America
11.6.10.1 Rest of Latin America Thermoelectric Materials Market Estimates and Forecasts, by Model (2020-2032) (USD Billion)
11.6.10.2 Rest of Latin America Thermoelectric Materials Market Estimates and Forecasts, by Application (2020-2032) (USD Billion)
11.6.10.3 Rest of Latin America Thermoelectric Materials Market Estimates and Forecasts, by End Use (2020-2032) (USD Billion)
11.6.10.4 Rest of Latin America Thermoelectric Materials Market Estimates and Forecasts, by Material (2020-2032) (USD Billion)
12. Company Profiles
12.1 Alphabet Energy
12.1.1 Company Overview
12.1.2 Financial
12.1.3 Products/ Services Offered
12.1.4 SWOT Analysis
12.2 EVERREDtronics Ltd.
12.2.1 Company Overview
12.2.2 Financial
12.2.3 Products/ Services Offered
12.2.4 SWOT Analysis
12.3 Thermion Company
12.3.1 Company Overview
12.3.2 Financial
12.3.3 Products/ Services Offered
12.3.4 SWOT Analysis
12.4 RMT Ltd
12.4.1 Company Overview
12.4.2 Financial
12.4.3 Products/ Services Offered
12.4.4 SWOT Analysis
12.5 II-VI Incorporated
12.5.1 Company Overview
12.5.2 Financial
12.5.3 Products/ Services Offered
12.5.4 SWOT Analysis
12.6 Marlow Industries, Inc
12.6.1 Company Overview
12.6.2 Financial
12.6.3 Products/ Services Offered
12.6.4 SWOT Analysis
12.7 Xiamen Hicool Electronics Co., Ltd.
12.7.1 Company Overview
12.7.2 Financial
12.7.3 Products/ Services Offered
12.7.4 SWOT Analysis
12.8 Crystal Ltd.
12.8.1 Company Overview
12.8.2 Financial
12.8.3 Products/ Services Offered
12.8.4 SWOT Analysis
12.9 Hi-Z Technology
12.9.1 Company Overview
12.9.2 Financial
12.9.3 Products/ Services Offered
12.9.4 SWOT Analysis
12.10 Ferrotec (USA) Corporation
12.10.1 Company Overview
12.10.2 Financial
12.10.3 Products/ Services Offered
12.10.4 SWOT Analysis
13. Use Cases and Best Practices
14. Conclusion
An accurate research report requires proper strategizing as well as implementation. There are multiple factors involved in the completion of good and accurate research report and selecting the best methodology to compete the research is the toughest part. Since the research reports we provide play a crucial role in any company’s decision-making process, therefore we at SNS Insider always believe that we should choose the best method which gives us results closer to reality. This allows us to reach at a stage wherein we can provide our clients best and accurate investment to output ratio.
Each report that we prepare takes a timeframe of 350-400 business hours for production. Starting from the selection of titles through a couple of in-depth brain storming session to the final QC process before uploading our titles on our website we dedicate around 350 working hours. The titles are selected based on their current market cap and the foreseen CAGR and growth.
The 5 steps process:
Step 1: Secondary Research:
Secondary Research or Desk Research is as the name suggests is a research process wherein, we collect data through the readily available information. In this process we use various paid and unpaid databases which our team has access to and gather data through the same. This includes examining of listed companies’ annual reports, Journals, SEC filling etc. Apart from this our team has access to various associations across the globe across different industries. Lastly, we have exchange relationships with various university as well as individual libraries.
Step 2: Primary Research
When we talk about primary research, it is a type of study in which the researchers collect relevant data samples directly, rather than relying on previously collected data. This type of research is focused on gaining content specific facts that can be sued to solve specific problems. Since the collected data is fresh and first hand therefore it makes the study more accurate and genuine.
We at SNS Insider have divided Primary Research into 2 parts.
Part 1 wherein we interview the KOLs of major players as well as the upcoming ones across various geographic regions. This allows us to have their view over the market scenario and acts as an important tool to come closer to the accurate market numbers. As many as 45 paid and unpaid primary interviews are taken from both the demand and supply side of the industry to make sure we land at an accurate judgement and analysis of the market.
This step involves the triangulation of data wherein our team analyses the interview transcripts, online survey responses and observation of on filed participants. The below mentioned chart should give a better understanding of the part 1 of the primary interview.
Part 2: In this part of primary research the data collected via secondary research and the part 1 of the primary research is validated with the interviews from individual consultants and subject matter experts.
Consultants are those set of people who have at least 12 years of experience and expertise within the industry whereas Subject Matter Experts are those with at least 15 years of experience behind their back within the same space. The data with the help of two main processes i.e., FGDs (Focused Group Discussions) and IDs (Individual Discussions). This gives us a 3rd party nonbiased primary view of the market scenario making it a more dependable one while collation of the data pointers.
Step 3: Data Bank Validation
Once all the information is collected via primary and secondary sources, we run that information for data validation. At our intelligence centre our research heads track a lot of information related to the market which includes the quarterly reports, the daily stock prices, and other relevant information. Our data bank server gets updated every fortnight and that is how the information which we collected using our primary and secondary information is revalidated in real time.
Step 4: QA/QC Process
After all the data collection and validation our team does a final level of quality check and quality assurance to get rid of any unwanted or undesired mistakes. This might include but not limited to getting rid of the any typos, duplication of numbers or missing of any important information. The people involved in this process include technical content writers, research heads and graphics people. Once this process is completed the title gets uploader on our platform for our clients to read it.
Step 5: Final QC/QA Process:
This is the last process and comes when the client has ordered the study. In this process a final QA/QC is done before the study is emailed to the client. Since we believe in giving our clients a good experience of our research studies, therefore, to make sure that we do not lack at our end in any way humanly possible we do a final round of quality check and then dispatch the study to the client.
Key Segments:
By Material
Bismuth Telluride
Lead Telluride
Others
By Application
Waste Heat Recovery
Energy Harvesting
Direct Power Generation
Co-generation
By End-use
Consumer Electronics
Manufacturing and Industrial
IT and Telecom
Automotive
Healthcare
Aerospace
Oil and Gas
By Model
Single Stage
Multi-Stage
Request for Segment Customization as per your Business Requirement: Segment Customization Request
Regional Coverage:
North America
US
Canada
Mexico
Europe
Eastern Europe
Poland
Romania
Hungary
Turkey
Rest of Eastern Europe
Western Europe
Germany
France
UK
Italy
Spain
Netherlands
Switzerland
Austria
Rest of Western Europe
Asia Pacific
China
India
Japan
South Korea
Vietnam
Singapore
Australia
Rest of Asia Pacific
Middle East & Africa
Middle East
UAE
Egypt
Saudi Arabia
Qatar
Rest of the Middle East
Africa
Nigeria
South Africa
Rest of Africa
Latin America
Brazil
Argentina
Colombia
Rest of Latin America
Request for Country Level Research Report: Country Level Customization Request
Available Customization
With the given market data, SNS Insider offers customization as per the company’s specific needs. The following customization options are available for the report:
Product Analysis
Criss-Cross segment analysis (e.g. Product X Application)
Product Matrix which gives a detailed comparison of the product portfolio of each company
Geographic Analysis
Additional countries in any of the regions
Company Information
Detailed analysis and profiling of additional market players (Up to five)
The Biodegradable Plastics Market size was valued at USD 6.7 Billion in 2023. It is expected to grow to USD 28.7 Billion by 2032 and grow at a CAGR of 15.2% over the forecast period of 2024-2032.
The Synthetic Paper Market Size was valued at USD 909.12 million in 2023 and is expected to reach USD 2023.96 million by 2032 and grow at a CAGR of 9.50% over the forecast period 2024-2032.
The Latex Binders Market size was valued at USD 7.66 billion in 2023 and is expected to reach USD 13.38 billion by 2032 and grow at a CAGR of 6.78% over the forecast period of 2024-2032.
The Hypochlorous Acid Market Size was USD 5.20 Billion in 2023. It is expected to grow to USD 8.4 Billion by 2032 and grow at a CAGR of 5.8% by 2024-2032.
The Biopolymers Market Size was valued at USD 17.5 billion in 2023 and is expected to reach USD 47.4 billion by 2032 and grow at a CAGR of 11.7% 2024-2032.
The Silicone Fabrics Market Size was valued at USD 4.37 billion in 2022, and is expected to reach USD 7.41 billion by 2030, and grow at a CAGR of 6.8% over the forecast period 2023-2030.
Hi! Click one of our member below to chat on Phone