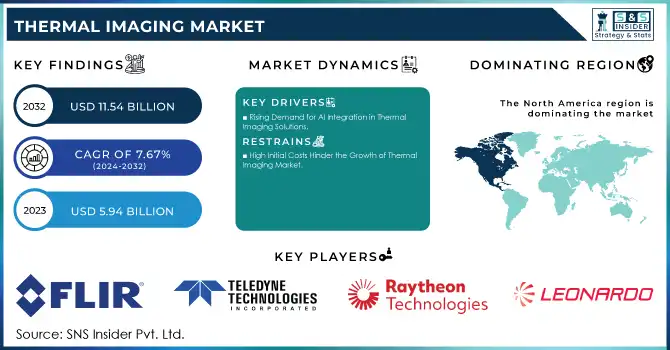
The Thermal Imaging Market Size was valued at USD 5.94 Billion in 2023 and is expected to reach USD 11.54 Billion by 2032 and grow at a CAGR of 7.67% over the forecast period 2024-2032.
The Thermal Imaging Market is showing steady growth due to technological advancement and increasing demand across various industries. In 2023, key countries like Japan, China, USA, Germany, France, and India are driving the market with strategic investments and technological innovation. Government policies like Japan funding advanced surveillance and thermal imaging for security, cutting-edge applications from China for healthcare and manufacturing, and policies in the USA focusing on technological investment in defense, healthcare, and infrastructure monitoring have been greatly contributing to the development of the market.
Get more information on Thermal Imaging Market - Request Sample Report
Some of the recent developments are AI-based thermal imaging systems and portable thermal cameras launched in 2023 and 2024, which help industries analyze things faster and more accurately for manufacturing, security, and healthcare applications. For instance, Hanwha Vision launched its AI-based high-performance radiometric thermal camera series globally recently. These small-sized cameras meet the need of all customers requiring such precision measurement of temperature up to the range of −40°C and 550°C while delivering a security and surveillance package making them suitable for industrial uses such as manufacturing, utilities, energy, airports, shipping industries, and the mining business.
Technological innovations, such as AI integration, IoT, and real-time data analytics, propel the market. These technologies provide predictive maintenance in industries, smart building energy efficiency solutions, and surveillance with real-time threat detection. Opportunities exist in the further development of thermal imaging applications for UAVs, medical diagnostics, and renewable energy. Governments have offered subsidies to stimulate innovation in this market.
Major companies are also focusing on partnership and technological innovation to stay in line with the demands of the industry. These technological innovations promise opportunities for industry players in terms of new revenue streams and strategic collaborations. Recent launches in 2023 and ongoing technological developments are expected to maintain momentum, offering significant potential for market growth in the coming years.
KEY DRIVERS:
Rising Demand for AI Integration in Thermal Imaging Solutions
AI technologies are driving innovation within various industries. Government and industry reports indicate that artificial intelligence integration in thermal imaging solutions can optimize predictive maintenance, security surveillance, and even medical diagnostics. With more than 45% of all industries using AI-driven technologies by 2023, the usage of AI-enabled thermal cameras grew by leaps and bounds.
It enhances operational capabilities based on real-time data, making it possible for such industries to foresee maintenance failure, monitor energy efficiency and even protect assets through predictable insights.
Increased Adoption in Healthcare for Early Disease Detection
Thermal imaging solutions are increasingly being adopted in the healthcare industry for non-invasive early diagnostics. As reported by recent data of the healthcare sector, demand for advanced imaging tools has grown 30% since 2023 due to their application in detecting anomalies like fevers, inflammation, and other early disease indicators.
According to a new research, by 2035, the number of FDA-cleared artificial intelligence tools in imaging is going to see a massive hike and is supposed to exceed venture capital funding at USD 30 billion. In the last seven years, the number of such products has been on the rise in radiological care, and medical imaging has taken 85% of the VC funding for digital health.
RESTRAIN:
High Initial Costs Hinder the Growth of Thermal Imaging Market
The high expenses are mainly because of advanced imaging devices, integration software, and training of human resources. As of government studies in 2023, only 45% of the small and medium-sized enterprises respond that there is a restraint to buy thermal imaging solutions because the budget is tight.
While AI-capable thermal imaging systems have state-of-the-art abilities, acquiring them and keeping them serviced cost too much and therefore fail to penetrate these budgeted regions. In addition, developing countries such as India and parts of Asia do not have the financial infrastructure to support the widespread use of these technologies. The economic cost also limits smaller companies' access to these imaging technologies. The initial cost also affects governmental projects, where some nations opt for other technological needs over thermal imaging infrastructure.
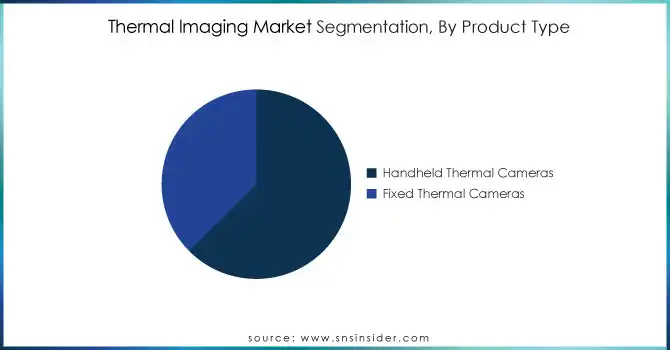
BY PRODUCT TYPE
In 2023, the Handheld Thermal Cameras segment dominated in 2023 with 63% of market share, driven by their portability, affordability, and ease of use across industries. Handheld thermal cameras are getting more frequent applications in maintenance operations, police services, as well as building inspections-they facilitate on-site surveillance and response to emergencies as well. Technology advancements such as longer life battery and high-image quality are also driving such increased applications.
The Handheld Thermal Cameras segment is expected to register the fastest CAGR of 7.84% during the forecast period 2024-2032, which reflects increasing demand from different sectors, including healthcare diagnostics, defense, and predictive industrial maintenance. Fixed thermal cameras are used in most stationary monitoring applications, such as border security, factory monitoring, and smart building applications.
BY TYPE
In 2023, Thermal Cameras segment dominated this year with 44% of the market share due to their applications across industries such as defense, security, and healthcare, where they are versatile imaging appliances for real-time temperature scanning, predictive maintenance, or security surveillance. Additionally, the technological advancements in improving their resolution and real-time imaging capabilities have enhanced industrial use cases.
On the other hand, Thermal Scopes segment are projected to grow with the fastest CAGR of 8.26% during the forecast period 2024-2032. Thermal scopes are being adopted for their advanced targeting features in military applications and civilian use cases such as hunting and surveillance. Their rising popularity stems from advanced technological integrations like AI-assisted imaging and improved night-vision capabilities, allowing users to monitor specific targets efficiently. This trend highlights opportunities for companies investing in innovative thermal scope technologies, focusing on superior thermal detection and operational efficiency.
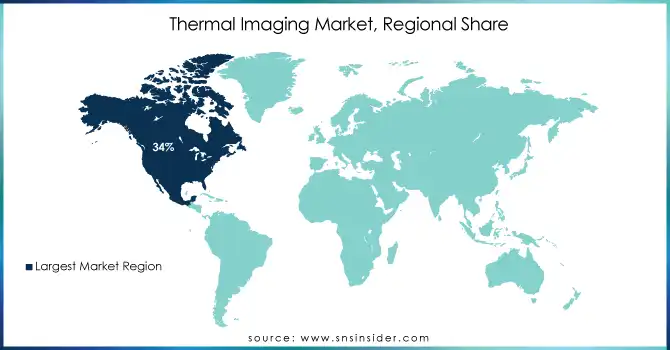
North America region dominated the thermal imaging market in 2023, with a market share of 34%. The leadership in the region is because of technological advancements, strategic government investments, and a strong presence of market leaders focusing on innovation. The USA's focus on defense and infrastructure development has significantly fueled market opportunities, and government spending supports advancements in thermal imaging applications.
Asia Pacific region is expected to grow the fastest with a CAGR of 8.46% during the forecast period of 2024-2032. This is because of the investments in technology by China, Japan, and India, which are expanding their thermal imaging applications in healthcare, defense, and energy sectors. Additionally, government subsidies and technological partnerships are boosting the adoption of advanced imaging technologies across the region, which makes it a hub for market expansion and innovation.
Get Customized Report as per your Business Requirement - Request For Customized Report
Some of the major players in the Thermal Imaging Market are
FLIR Systems (Handheld Thermal Cameras, Fixed Thermal Cameras)
Teledyne Technologies (Thermal Cameras, Thermal Modules)
Raytheon Technologies (Thermal Scopes, Cooled Thermal Cameras)
Leonardo DRS (Thermal Cameras, Military Applications)
L3 Technologies (Thermal Scopes, Security Solutions)
Seek Thermal (Handheld Thermal Cameras, Thermal Modules)
Opgal (Thermal Cameras, Security Surveillance)
HIKVISION (Thermal Cameras, Surveillance Tools)
Axis Communications (Thermal Cameras, Monitoring Solutions)
FLIR OEM Solutions (Thermal Modules, Embedded Imaging)
Bosch Security Systems (Surveillance Cameras, Thermal Detection)
Northrop Grumman (Military Surveillance, Aerospace Systems)
Dahua Technology (Thermal Cameras, Security Solutions)
CISCO Systems (Thermal Integration, Security Monitoring)
Honeywell (Thermal Scopes, Safety & Security)
Thales Group (Defense Solutions, Thermal Cameras)
PerkinElmer (Thermal Imaging Applications, Health Diagnostics)
Siemens (Thermal Modules, Industrial Monitoring)
GE Measurement & Control (Thermal Sensors, Monitoring Solutions)
Advances Thermal Imaging Co. (Portable Thermal Imaging, Medical Applications)
Amphenol Advanced Sensors
Honeywell International
Vishay Precision Group
Raytheon Technologies
FLIR Systems’ Component Providers
Teledyne's Material Suppliers
Bosch Materials Division
Opgal Material Suppliers
Semiconductor suppliers like Infineon Technologies
3M Advanced Materials Division
CISCO’s Imaging Component Partners
GE Measurement's Sensor Suppliers
Thales Group Component Providers
Northrop Grumman's Advanced Electronics Suppliers
PerkinElmer's Diagnostic Material Suppliers
Siemens Industrial Solutions
Dahua Component Partners
Amphenol Thermal Sensor Providers
Honeywell's Manufacturing Supply Chain
Vishay Electronics’ Sensor Production Facilities
Military & Defense Agencies (e.g., NATO, USA DoD)
Aerospace manufacturers (Lockheed Martin, Boeing, Airbus)
Energy companies (Shell, BP, Chevron)
Industrial companies (General Electric, Siemens)
Healthcare providers & government hospitals
Automotive companies (Ford, Volkswagen, Toyota)
Law enforcement agencies globally (via security solutions)
Infrastructure development corporations for monitoring projects
Telecommunication & smart infrastructure companies (Cisco, HIKVISION)
Firefighting units for emergency deployment
September 2024: Fluke Corporation, the world leader in portable electronic test and measurement tools, announced its new pocket-sized iSee Mobile Thermal Camera-a highly portable thermal camera offering resolution equal to professional cameras and full range of temperature analysis.
April 2024: L3Harris Technologies has been awarded a USD 256 M order for the continuation of production for the Enhanced Night Vision Goggle – Binocular, ENVG-B, for the US Army. The order is the first the US Army has placed from the Program of Record full-scale production IDIQ contract.
| Report Attributes | Details |
|---|---|
| Market Size in 2023 | USD 5.94 Billion |
| Market Size by 2032 | USD 11.54 Billion |
| CAGR | CAGR of 7.67% From 2024 to 2032 |
| Base Year | 2023 |
| Forecast Period | 2024-2032 |
| Historical Data | 2020-2022 |
| Report Scope & Coverage | Market Size, Segments Analysis, Competitive Landscape, Regional Analysis, DROC & SWOT Analysis, Forecast Outlook |
| Key Segments | • By Product Type (Handheld Thermal Cameras, Fixed Thermal Cameras) • By Type (Thermal Modules, Thermal Cameras, Thermal Scopes) • By Technology (Cooled, Uncooled) • By Application (Monitoring & Inspection, Security & Surveillance, Detection & Measurement) • By Industry Vertical (Industrial, Residential, Automotive, Oil & Gas, Commercial, Aerospace & Defense, Healthcare & Life Sciences, Food & Beverages) |
| Regional Analysis/Coverage | North America (US, Canada, Mexico), Europe (Eastern Europe [Poland, Romania, Hungary, Turkey, Rest of Eastern Europe] Western Europe] Germany, France, UK, Italy, Spain, Netherlands, Switzerland, Austria, Rest of Western Europe]), Asia Pacific (China, India, Japan, South Korea, Vietnam, Singapore, Australia, Rest of Asia Pacific), Middle East & Africa (Middle East [UAE, Egypt, Saudi Arabia, Qatar, Rest of Middle East], Africa [Nigeria, South Africa, Rest of Africa], Latin America (Brazil, Argentina, Colombia, Rest of Latin America) |
| Company Profiles | FLIR Systems, Teledyne Technologies, Raytheon Technologies, Leonardo DRS, L3 Technologies, Seek Thermal, Opgal, HIKVISION, Axis Communications, FLIR OEM Solutions, Bosch Security Systems, Northrop Grumman, Dahua Technology, CISCO Systems, Honeywell, Thales Group, PerkinElmer, Siemens, GE Measurement & Control, Advances Thermal Imaging Co. |
| Key Drivers | • Rising Demand for AI Integration in Thermal Imaging Solutions. • Increased Adoption in Healthcare for Early Disease Detection. |
| Restraints | • High Initial Costs Hinder the Growth of Thermal Imaging Market. |
Ans: North America dominated the Thermal Imaging Market in 2023.
Ans: The Handheld Thermal Cameras segment dominated the Thermal Imaging Market.
Ans: The major growth factors of the Thermal Imaging Market is Rising Demand for AI Integration in Thermal Imaging Solutions.
Ans: Thermal Imaging Market size was USD 5.94 Billion in 2023 and is expected to Reach USD 11.54 Billion by 2032.
Ans: The Thermal Imaging Market is expected to grow at a CAGR of 7.67% during 2024-2032.
1. Introduction
1.1 Market Definition
1.2 Scope (Inclusion and Exclusions)
1.3 Research Assumptions
2. Executive Summary
2.1 Market Overview
2.2 Regional Synopsis
2.3 Competitive Summary
3. Research Methodology
3.1 Top-Down Approach
3.2 Bottom-up Approach
3.3. Data Validation
3.4 Primary Interviews
4. Market Dynamics Impact Analysis
4.1 Market Driving Factors Analysis
4.1.1 Drivers
4.1.2 Restraints
4.1.3 Opportunities
4.1.4 Challenges
4.2 PESTLE Analysis
4.3 Porter’s Five Forces Model
5. Statistical Insights and Trends Reporting
5.1 Wafer Production Volumes, by Region (2023)
5.2 Chip Design Trends (Historic and Future)
5.3 Fab Capacity Utilization (2023)
5.4 Supply Chain Metrics
6. Competitive Landscape
6.1 List of Major Companies, By Region
6.2 Market Share Analysis, By Region
6.3 Product Benchmarking
6.3.1 Product specifications and features
6.3.2 Pricing
6.4 Strategic Initiatives
6.4.1 Marketing and promotional activities
6.4.2 Distribution and supply chain strategies
6.4.3 Expansion plans and new product launches
6.4.4 Strategic partnerships and collaborations
6.5 Technological Advancements
6.6 Market Positioning and Branding
7. Thermal Imaging Market Segmentation, By Product Type
7.1 Chapter Overview
7.2 Handheld Thermal Cameras
7.2.1 Handheld Thermal Cameras Market Trends Analysis (2020-2032)
7.2.2 Handheld Thermal Cameras Market Size Estimates and Forecasts to 2032 (USD Billion)
7.3 Fixed Thermal Cameras
7.3.1 Fixed Thermal Cameras Market Trends Analysis (2020-2032)
7.3.2 Fixed Thermal Cameras Market Size Estimates and Forecasts to 2032 (USD Billion)
8. Thermal Imaging Market Segmentation, By Technology
8.1 Chapter Overview
8.2 Cooled
8.2.1 Cooled Market Trends Analysis (2020-2032)
8.2.2 Cooled Market Size Estimates And Forecasts To 2032 (USD Billion)
8.3 Uncooled
8.3.1 Uncooled Market Trends Analysis (2020-2032)
8.3.2 Uncooled Market Size Estimates And Forecasts To 2032 (USD Billion)
9. Thermal Imaging Market Segmentation, By Type
9.1 Chapter Overview
9.2 Thermal Modules
9.2.1 Thermal Modules Market Trends Analysis (2020-2032)
9.2.2 Thermal Modules Market Size Estimates And Forecasts To 2032 (USD Billion)
9.3 Thermal Cameras
9.3.1 Thermal Cameras Market Trends Analysis (2020-2032)
9.3.2 Thermal Cameras Market Size Estimates And Forecasts To 2032 (USD Billion)
9.4 Thermal Scopes
9.4.1 Thermal Scopes Market Trends Analysis (2020-2032)
9.4.2 Thermal Scopes Market Size Estimates And Forecasts To 2032 (USD Billion)
10. Thermal Imaging Market Segmentation, By Application
10.1 Chapter Overview
10.2 Monitoring & Inspection
10.2.1 Monitoring & Inspection Market Trends Analysis (2020-2032)
10.2.2 Monitoring & Inspection Market Size Estimates And Forecasts To 2032 (USD Billion)
10.3 Security & Surveillance
10.3.1 Security & Surveillance Market Trends Analysis (2020-2032)
10.3.2 Security & Surveillance Market Size Estimates And Forecasts To 2032 (USD Billion)
10.4 Detection & Measurement
10.4.1 Detection & Measurement Market Trends Analysis (2020-2032)
10.4.2 Detection & Measurement Market Size Estimates And Forecasts To 2032 (USD Billion)
11. Thermal Imaging Market Segmentation, By Industry Vertical
11.1 Chapter Overview
11.2 Air Inflator
11.2.1 Air Inflator Market Trends Analysis (2020-2032)
11.2.2 Air Inflator Market Size Estimates And Forecasts To 2032 (USD Billion)
11.3 Airbag Control
11.3.1 Airbag Control Market Trends Analysis (2020-2032)
11.3.2 Airbag Control Market Size Estimates And Forecasts To 2032 (USD Billion)
12. Regional Analysis
12.1 Chapter Overview
12.2 North America
12.2.1 Trends Analysis
12.2.2 North America Thermal Imaging Market Estimates And Forecasts, By Country (2020-2032) (USD Billion)
12.2.3 North America Thermal Imaging Market Estimates And Forecasts, By Product Type (2020-2032) (USD Billion)
12.2.4 North America Thermal Imaging Market Estimates And Forecasts, By Technology (2020-2032) (USD Billion)
12.2.5 North America Thermal Imaging Market Estimates And Forecasts, By Type (2020-2032) (USD Billion)
12.2.6 North America Thermal Imaging Market Estimates And Forecasts, By Application (2020-2032) (USD Billion)
12.2.7 North America Thermal Imaging Market Estimates And Forecasts, By Industry Vertical (2020-2032) (USD Billion)
12.2.8 USA
12.2.8.1 USA Thermal Imaging Market Estimates And Forecasts, By Product Type (2020-2032) (USD Billion)
12.2.8.2 USA Thermal Imaging Market Estimates And Forecasts, By Technology (2020-2032) (USD Billion)
12.2.8.3 USA Thermal Imaging Market Estimates And Forecasts, By Type (2020-2032) (USD Billion)
12.2.8.4 USA Thermal Imaging Market Estimates And Forecasts, By Application (2020-2032) (USD Billion)
12.2.8.5 USA Thermal Imaging Market Estimates And Forecasts, By Industry Vertical (2020-2032) (USD Billion)
12.2.9 Canada
12.2.9.1 Canada Thermal Imaging Market Estimates And Forecasts, By Product Type (2020-2032) (USD Billion)
12.2.9.2 Canada Thermal Imaging Market Estimates And Forecasts, By Technology (2020-2032) (USD Billion)
12.2.9.3 Canada Thermal Imaging Market Estimates And Forecasts, By Type (2020-2032) (USD Billion)
12.2.9.4 Canada Thermal Imaging Market Estimates And Forecasts, By Application (2020-2032) (USD Billion)
12.2.9.5 Canada Thermal Imaging Market Estimates And Forecasts, By Industry Vertical (2020-2032) (USD Billion)
12.2.10 Mexico
12.2.10.1 Mexico Thermal Imaging Market Estimates And Forecasts, By Product Type (2020-2032) (USD Billion)
12.2.10.2 Mexico Thermal Imaging Market Estimates And Forecasts, By Technology (2020-2032) (USD Billion)
12.2.10.3 Mexico Thermal Imaging Market Estimates And Forecasts, By Type (2020-2032) (USD Billion)
12.2.10.4 Mexico Thermal Imaging Market Estimates And Forecasts, By Application (2020-2032) (USD Billion)
12.2.10.5 Mexico Thermal Imaging Market Estimates And Forecasts, By Industry Vertical (2020-2032) (USD Billion)
12.3 Europe
12.3.1 Eastern Europe
12.3.1.1 Trends Analysis
12.3.1.2 Eastern Europe Thermal Imaging Market Estimates And Forecasts, By Country (2020-2032) (USD Billion)
12.3.1.3 Eastern Europe Thermal Imaging Market Estimates And Forecasts, By Product Type (2020-2032) (USD Billion)
12.3.1.4 Eastern Europe Thermal Imaging Market Estimates And Forecasts, By Technology (2020-2032) (USD Billion)
12.3.1.5 Eastern Europe Thermal Imaging Market Estimates And Forecasts, By Type (2020-2032) (USD Billion)
12.3.1.6 Eastern Europe Thermal Imaging Market Estimates And Forecasts, By Application (2020-2032) (USD Billion)
12.3.1.7 Eastern Europe Thermal Imaging Market Estimates And Forecasts, By Industry Vertical (2020-2032) (USD Billion)
12.3.1.8 Poland
12.3.1.8.1 Poland Thermal Imaging Market Estimates And Forecasts, By Product Type (2020-2032) (USD Billion)
12.3.1.8.2 Poland Thermal Imaging Market Estimates And Forecasts, By Technology (2020-2032) (USD Billion)
12.3.1.8.3 Poland Thermal Imaging Market Estimates And Forecasts, By Type (2020-2032) (USD Billion)
12.3.1.8.4 Poland Thermal Imaging Market Estimates And Forecasts, By Application (2020-2032) (USD Billion)
12.3.1.8.5 Poland Thermal Imaging Market Estimates And Forecasts, By Industry Vertical (2020-2032) (USD Billion)
12.3.1.9 Romania
12.3.1.9.1 Romania Thermal Imaging Market Estimates And Forecasts, By Product Type (2020-2032) (USD Billion)
12.3.1.9.2 Romania Thermal Imaging Market Estimates And Forecasts, By Technology (2020-2032) (USD Billion)
12.3.1.9.3 Romania Thermal Imaging Market Estimates And Forecasts, By Type (2020-2032) (USD Billion)
12.3.1.9.4 Romania Thermal Imaging Market Estimates And Forecasts, By Application (2020-2032) (USD Billion)
12.3.1.9.5 Romania Thermal Imaging Market Estimates And Forecasts, By Industry Vertical (2020-2032) (USD Billion)
12.3.1.10 Hungary
12.3.1.10.1 Hungary Thermal Imaging Market Estimates And Forecasts, By Product Type (2020-2032) (USD Billion)
12.3.1.10.2 Hungary Thermal Imaging Market Estimates And Forecasts, By Technology (2020-2032) (USD Billion)
12.3.1.10.3 Hungary Thermal Imaging Market Estimates And Forecasts, By Type (2020-2032) (USD Billion)
12.3.1.10.4 Hungary Thermal Imaging Market Estimates And Forecasts, By Application (2020-2032) (USD Billion)
12.3.1.10.5 Hungary Thermal Imaging Market Estimates And Forecasts, By Industry Vertical (2020-2032) (USD Billion)
12.3.1.11 Turkey
12.3.1.11.1 Turkey Thermal Imaging Market Estimates And Forecasts, By Product Type (2020-2032) (USD Billion)
12.3.1.11.2 Turkey Thermal Imaging Market Estimates And Forecasts, By Technology (2020-2032) (USD Billion)
12.3.1.11.3 Turkey Thermal Imaging Market Estimates And Forecasts, By Type (2020-2032) (USD Billion)
12.3.1.11.4 Turkey Thermal Imaging Market Estimates And Forecasts, By Application (2020-2032) (USD Billion)
12.3.1.11.5 Turkey Thermal Imaging Market Estimates And Forecasts, By Industry Vertical (2020-2032) (USD Billion)
12.3.1.12 Rest Of Eastern Europe
12.3.1.12.1 Rest Of Eastern Europe Thermal Imaging Market Estimates And Forecasts, By Product Type (2020-2032) (USD Billion)
12.3.1.12.2 Rest Of Eastern Europe Thermal Imaging Market Estimates And Forecasts, By Technology (2020-2032) (USD Billion)
12.3.1.12.3 Rest Of Eastern Europe Thermal Imaging Market Estimates And Forecasts, By Type (2020-2032) (USD Billion)
12.3.1.12.4 Rest Of Eastern Europe Thermal Imaging Market Estimates And Forecasts, By Application (2020-2032) (USD Billion)
12.3.1.12.5 Rest Of Eastern Europe Thermal Imaging Market Estimates And Forecasts, By Industry Vertical (2020-2032) (USD Billion)
12.3.2 Western Europe
12.3.2.1 Trends Analysis
12.3.2.2 Western Europe Thermal Imaging Market Estimates And Forecasts, By Country (2020-2032) (USD Billion)
12.3.2.3 Western Europe Thermal Imaging Market Estimates And Forecasts, By Product Type (2020-2032) (USD Billion)
12.3.2.4 Western Europe Thermal Imaging Market Estimates And Forecasts, By Technology (2020-2032) (USD Billion)
12.3.2.5 Western Europe Thermal Imaging Market Estimates And Forecasts, By Type (2020-2032) (USD Billion)
12.3.2.6 Western Europe Thermal Imaging Market Estimates And Forecasts, By Application (2020-2032) (USD Billion)
12.3.2.7 Western Europe Thermal Imaging Market Estimates And Forecasts, By Industry Vertical (2020-2032) (USD Billion)
12.3.2.8 Germany
12.3.2.8.1 Germany Thermal Imaging Market Estimates And Forecasts, By Product Type (2020-2032) (USD Billion)
12.3.2.8.2 Germany Thermal Imaging Market Estimates And Forecasts, By Technology (2020-2032) (USD Billion)
12.3.2.8.3 Germany Thermal Imaging Market Estimates And Forecasts, By Type (2020-2032) (USD Billion)
12.3.2.8.4 Germany Thermal Imaging Market Estimates And Forecasts, By Application (2020-2032) (USD Billion)
12.3.2.8.5 Germany Thermal Imaging Market Estimates And Forecasts, By Industry Vertical (2020-2032) (USD Billion)
12.3.2.9 France
12.3.2.9.1 France Thermal Imaging Market Estimates And Forecasts, By Product Type (2020-2032) (USD Billion)
12.3.2.9.2 France Thermal Imaging Market Estimates And Forecasts, By Technology (2020-2032) (USD Billion)
12.3.2.9.3 France Thermal Imaging Market Estimates And Forecasts, By Type (2020-2032) (USD Billion)
12.3.2.9.4 France Thermal Imaging Market Estimates And Forecasts, By Application (2020-2032) (USD Billion)
12.3.2.9.5 France Thermal Imaging Market Estimates And Forecasts, By Industry Vertical (2020-2032) (USD Billion)
12.3.2.10 UK
12.3.2.10.1 UK Thermal Imaging Market Estimates And Forecasts, By Product Type (2020-2032) (USD Billion)
12.3.2.10.2 UK Thermal Imaging Market Estimates And Forecasts, By Technology (2020-2032) (USD Billion)
12.3.2.10.3 UK Thermal Imaging Market Estimates And Forecasts, By Type (2020-2032) (USD Billion)
12.3.2.10.4 UK Thermal Imaging Market Estimates And Forecasts, By Application (2020-2032) (USD Billion)
12.3.2.10.5 UK Thermal Imaging Market Estimates And Forecasts, By Industry Vertical (2020-2032) (USD Billion)
12.3.2.11 Italy
12.3.2.11.1 Italy Thermal Imaging Market Estimates And Forecasts, By Product Type (2020-2032) (USD Billion)
12.3.2.11.2 Italy Thermal Imaging Market Estimates And Forecasts, By Technology (2020-2032) (USD Billion)
12.3.2.11.3 Italy Thermal Imaging Market Estimates And Forecasts, By Type (2020-2032) (USD Billion)
12.3.2.11.4 Italy Thermal Imaging Market Estimates And Forecasts, By Application (2020-2032) (USD Billion)
12.3.2.11.5 Italy Thermal Imaging Market Estimates And Forecasts, By Industry Vertical (2020-2032) (USD Billion)
12.3.2.12 Spain
12.3.2.12.1 Spain Thermal Imaging Market Estimates And Forecasts, By Product Type (2020-2032) (USD Billion)
12.3.2.12.2 Spain Thermal Imaging Market Estimates And Forecasts, By Technology (2020-2032) (USD Billion)
12.3.2.12.3 Spain Thermal Imaging Market Estimates And Forecasts, By Type (2020-2032) (USD Billion)
12.3.2.12.4 Spain Thermal Imaging Market Estimates And Forecasts, By Application (2020-2032) (USD Billion)
12.3.2.12.5 Spain Thermal Imaging Market Estimates And Forecasts, By Industry Vertical (2020-2032) (USD Billion)
12.3.2.13 Netherlands
12.3.2.13.1 Netherlands Thermal Imaging Market Estimates And Forecasts, By Product Type (2020-2032) (USD Billion)
12.3.2.13.2 Netherlands Thermal Imaging Market Estimates And Forecasts, By Technology (2020-2032) (USD Billion)
12.3.2.13.3 Netherlands Thermal Imaging Market Estimates And Forecasts, By Type (2020-2032) (USD Billion)
12.3.2.13.4 Netherlands Thermal Imaging Market Estimates And Forecasts, By Application (2020-2032) (USD Billion)
12.3.2.13.5 Netherlands Thermal Imaging Market Estimates And Forecasts, By Industry Vertical (2020-2032) (USD Billion)
12.3.2.14 Switzerland
12.3.2.14.1 Switzerland Thermal Imaging Market Estimates And Forecasts, By Product Type (2020-2032) (USD Billion)
12.3.2.14.2 Switzerland Thermal Imaging Market Estimates And Forecasts, By Technology (2020-2032) (USD Billion)
12.3.2.14.3 Switzerland Thermal Imaging Market Estimates And Forecasts, By Type (2020-2032) (USD Billion)
12.3.2.14.4 Switzerland Thermal Imaging Market Estimates And Forecasts, By Application (2020-2032) (USD Billion)
12.3.2.12.5 Switzerland Thermal Imaging Market Estimates And Forecasts, By Industry Vertical (2020-2032) (USD Billion)
12.3.2.15 Austria
12.3.2.15.1 Austria Thermal Imaging Market Estimates And Forecasts, By Product Type (2020-2032) (USD Billion)
12.3.2.15.2 Austria Thermal Imaging Market Estimates And Forecasts, By Technology (2020-2032) (USD Billion)
12.3.2.15.3 Austria Thermal Imaging Market Estimates And Forecasts, By Type (2020-2032) (USD Billion)
12.3.2.15.4 Austria Thermal Imaging Market Estimates And Forecasts, By Application (2020-2032) (USD Billion)
12.3.2.15.5 Austria Thermal Imaging Market Estimates And Forecasts, By Industry Vertical (2020-2032) (USD Billion)
12.3.2.16 Rest Of Western Europe
12.3.2.16.1 Rest Of Western Europe Thermal Imaging Market Estimates And Forecasts, By Product Type (2020-2032) (USD Billion)
12.3.2.16.2 Rest Of Western Europe Thermal Imaging Market Estimates And Forecasts, By Technology (2020-2032) (USD Billion)
12.3.2.16.3 Rest Of Western Europe Thermal Imaging Market Estimates And Forecasts, By Type (2020-2032) (USD Billion)
12.3.2.16.4 Rest Of Western Europe Thermal Imaging Market Estimates And Forecasts, By Application (2020-2032) (USD Billion)
12.3.2.16.5 Rest Of Western Europe Thermal Imaging Market Estimates And Forecasts, By Industry Vertical (2020-2032) (USD Billion)
12.4 Asia Pacific
12.4.1 Trends Analysis
12.4.2 Asia Pacific Thermal Imaging Market Estimates And Forecasts, By Country (2020-2032) (USD Billion)
12.4.3 Asia Pacific Thermal Imaging Market Estimates And Forecasts, By Product Type (2020-2032) (USD Billion)
12.4.4 Asia Pacific Thermal Imaging Market Estimates And Forecasts, By Technology (2020-2032) (USD Billion)
12.4.5 Asia Pacific Thermal Imaging Market Estimates And Forecasts, By Type (2020-2032) (USD Billion)
12.4.6 Asia Pacific Thermal Imaging Market Estimates And Forecasts, By Application (2020-2032) (USD Billion)
12.4.7 Asia Pacific Thermal Imaging Market Estimates And Forecasts, By Industry Vertical (2020-2032) (USD Billion)
12.4.8 China
12.4.8.1 China Thermal Imaging Market Estimates And Forecasts, By Product Type (2020-2032) (USD Billion)
12.4.8.2 China Thermal Imaging Market Estimates And Forecasts, By Technology (2020-2032) (USD Billion)
12.4.8.3 China Thermal Imaging Market Estimates And Forecasts, By Type (2020-2032) (USD Billion)
12.4.8.4 China Thermal Imaging Market Estimates And Forecasts, By Application (2020-2032) (USD Billion)
12.4.8.5 China Thermal Imaging Market Estimates And Forecasts, By Industry Vertical (2020-2032) (USD Billion)
12.4.9 India
12.4.9.1 India Thermal Imaging Market Estimates And Forecasts, By Product Type (2020-2032) (USD Billion)
12.4.9.2 India Thermal Imaging Market Estimates And Forecasts, By Technology (2020-2032) (USD Billion)
12.4.9.3 India Thermal Imaging Market Estimates And Forecasts, By Type (2020-2032) (USD Billion)
12.4.9.4 India Thermal Imaging Market Estimates And Forecasts, By Application (2020-2032) (USD Billion)
12.4.9.5 India Thermal Imaging Market Estimates And Forecasts, By Industry Vertical (2020-2032) (USD Billion)
12.4.10 Japan
12.4.10.1 Japan Thermal Imaging Market Estimates And Forecasts, By Product Type (2020-2032) (USD Billion)
12.4.10.2 Japan Thermal Imaging Market Estimates And Forecasts, By Technology (2020-2032) (USD Billion)
12.4.10.3 Japan Thermal Imaging Market Estimates And Forecasts, By Type (2020-2032) (USD Billion)
12.4.10.4 Japan Thermal Imaging Market Estimates And Forecasts, By Application (2020-2032) (USD Billion)
12.4.10.5 Japan Thermal Imaging Market Estimates And Forecasts, By Industry Vertical (2020-2032) (USD Billion)
12.4.11 South Korea
12.4.11.1 South Korea Thermal Imaging Market Estimates And Forecasts, By Product Type (2020-2032) (USD Billion)
12.4.11.2 South Korea Thermal Imaging Market Estimates And Forecasts, By Technology (2020-2032) (USD Billion)
12.4.11.3 South Korea Thermal Imaging Market Estimates And Forecasts, By Type (2020-2032) (USD Billion)
12.4.11.4 South Korea Thermal Imaging Market Estimates And Forecasts, By Application (2020-2032) (USD Billion)
12.4.11.5 South Korea Thermal Imaging Market Estimates And Forecasts, By Industry Vertical (2020-2032) (USD Billion)
12.4.12 Vietnam
12.4.12.1 Vietnam Thermal Imaging Market Estimates And Forecasts, By Product Type (2020-2032) (USD Billion)
12.4.12.2 Vietnam Thermal Imaging Market Estimates And Forecasts, By Technology (2020-2032) (USD Billion)
12.4.12.3 Vietnam Thermal Imaging Market Estimates And Forecasts, By Type (2020-2032) (USD Billion)
12.4.12.4 Vietnam Thermal Imaging Market Estimates And Forecasts, By Application (2020-2032) (USD Billion)
12.4.12.5 Vietnam Thermal Imaging Market Estimates And Forecasts, By Industry Vertical (2020-2032) (USD Billion)
12.4.13 Singapore
12.4.13.1 Singapore Thermal Imaging Market Estimates And Forecasts, By Product Type (2020-2032) (USD Billion)
12.4.13.2 Singapore Thermal Imaging Market Estimates And Forecasts, By Technology (2020-2032) (USD Billion)
12.4.13.3 Singapore Thermal Imaging Market Estimates And Forecasts, By Type (2020-2032) (USD Billion)
12.4.13.4 Singapore Thermal Imaging Market Estimates And Forecasts, By Application (2020-2032) (USD Billion)
12.4.13.5 Singapore Thermal Imaging Market Estimates And Forecasts, By Industry Vertical (2020-2032) (USD Billion)
12.4.14 Australia
12.4.14.1 Australia Thermal Imaging Market Estimates And Forecasts, By Product Type (2020-2032) (USD Billion)
12.4.14.2 Australia Thermal Imaging Market Estimates And Forecasts, By Technology (2020-2032) (USD Billion)
12.4.14.3 Australia Thermal Imaging Market Estimates And Forecasts, By Type (2020-2032) (USD Billion)
12.4.14.4 Australia Thermal Imaging Market Estimates And Forecasts, By Application (2020-2032) (USD Billion)
12.4.14.5 Australia Thermal Imaging Market Estimates And Forecasts, By Industry Vertical (2020-2032) (USD Billion)
12.4.15 Rest Of Asia Pacific
12.4.15.1 Rest Of Asia Pacific Thermal Imaging Market Estimates And Forecasts, By Product Type (2020-2032) (USD Billion)
12.4.15.2 Rest Of Asia Pacific Thermal Imaging Market Estimates And Forecasts, By Technology (2020-2032) (USD Billion)
12.4.15.3 Rest Of Asia Pacific Thermal Imaging Market Estimates And Forecasts, By Type (2020-2032) (USD Billion)
12.4.15.4 Rest Of Asia Pacific Thermal Imaging Market Estimates And Forecasts, By Application (2020-2032) (USD Billion)
12.4.15.5 Rest Of Asia Pacific Thermal Imaging Market Estimates And Forecasts, By Industry Vertical (2020-2032) (USD Billion)
12.5 Middle East And Africa
12.5.1 Middle East
12.5.1.1 Trends Analysis
12.5.1.2 Middle East Thermal Imaging Market Estimates And Forecasts, By Country (2020-2032) (USD Billion)
12.5.1.3 Middle East Thermal Imaging Market Estimates And Forecasts, By Product Type (2020-2032) (USD Billion)
12.5.1.4 Middle East Thermal Imaging Market Estimates And Forecasts, By Technology (2020-2032) (USD Billion)
12.5.1.5 Middle East Thermal Imaging Market Estimates And Forecasts, By Type (2020-2032) (USD Billion)
12.5.1.6 Middle East Thermal Imaging Market Estimates And Forecasts, By Application (2020-2032) (USD Billion)
12.5.1.7 Middle East Thermal Imaging Market Estimates And Forecasts, By Industry Vertical (2020-2032) (USD Billion)
12.5.1.8 UAE
12.5.1.8.1 UAE Thermal Imaging Market Estimates And Forecasts, By Product Type (2020-2032) (USD Billion)
12.5.1.8.2 UAE Thermal Imaging Market Estimates And Forecasts, By Technology (2020-2032) (USD Billion)
12.5.1.8.3 UAE Thermal Imaging Market Estimates And Forecasts, By Type (2020-2032) (USD Billion)
12.5.1.8.4 UAE Thermal Imaging Market Estimates And Forecasts, By Application (2020-2032) (USD Billion)
12.5.1.8.5 UAE Thermal Imaging Market Estimates And Forecasts, By Industry Vertical (2020-2032) (USD Billion)
12.5.1.9 Egypt
12.5.1.9.1 Egypt Thermal Imaging Market Estimates And Forecasts, By Product Type (2020-2032) (USD Billion)
12.5.1.9.2 Egypt Thermal Imaging Market Estimates And Forecasts, By Technology (2020-2032) (USD Billion)
12.5.1.9.3 Egypt Thermal Imaging Market Estimates And Forecasts, By Type (2020-2032) (USD Billion)
12.5.1.9.4 Egypt Thermal Imaging Market Estimates And Forecasts, By Application (2020-2032) (USD Billion)
12.5.1.9.5 Egypt Thermal Imaging Market Estimates And Forecasts, By Industry Vertical (2020-2032) (USD Billion)
12.5.1.10 Saudi Arabia
12.5.1.10.1 Saudi Arabia Thermal Imaging Market Estimates And Forecasts, By Product Type (2020-2032) (USD Billion)
12.5.1.10.2 Saudi Arabia Thermal Imaging Market Estimates And Forecasts, By Technology (2020-2032) (USD Billion)
12.5.1.10.3 Saudi Arabia Thermal Imaging Market Estimates And Forecasts, By Type (2020-2032) (USD Billion)
12.5.1.10.4 Saudi Arabia Thermal Imaging Market Estimates And Forecasts, By Application (2020-2032) (USD Billion)
12.5.1.10.5 Saudi Arabia Thermal Imaging Market Estimates And Forecasts, By Industry Vertical (2020-2032) (USD Billion)
12.5.1.11 Qatar
12.5.1.11.1 Qatar Thermal Imaging Market Estimates And Forecasts, By Product Type (2020-2032) (USD Billion)
12.5.1.11.2 Qatar Thermal Imaging Market Estimates And Forecasts, By Technology (2020-2032) (USD Billion)
12.5.1.11.3 Qatar Thermal Imaging Market Estimates And Forecasts, By Type (2020-2032) (USD Billion)
12.5.1.11.4 Qatar Thermal Imaging Market Estimates And Forecasts, By Application (2020-2032) (USD Billion)
12.5.1.11.5 Qatar Thermal Imaging Market Estimates And Forecasts, By Industry Vertical (2020-2032) (USD Billion)
12.5.1.12 Rest Of Middle East
12.5.1.12.1 Rest Of Middle East Thermal Imaging Market Estimates And Forecasts, By Product Type (2020-2032) (USD Billion)
12.5.1.12.2 Rest Of Middle East Thermal Imaging Market Estimates And Forecasts, By Technology (2020-2032) (USD Billion)
12.5.1.12.3 Rest Of Middle East Thermal Imaging Market Estimates And Forecasts, By Type (2020-2032) (USD Billion)
12.5.1.12.4 Rest Of Middle East Thermal Imaging Market Estimates And Forecasts, By Application (2020-2032) (USD Billion)
12.5.1.12.5 Rest Of Middle East Thermal Imaging Market Estimates And Forecasts, By Industry Vertical (2020-2032) (USD Billion)
12.5.2 Africa
12.5.2.1 Trends Analysis
12.5.2.2 Africa Thermal Imaging Market Estimates And Forecasts, By Country (2020-2032) (USD Billion)
12.5.2.3 Africa Thermal Imaging Market Estimates And Forecasts, By Product Type (2020-2032) (USD Billion)
12.5.2.4 Africa Thermal Imaging Market Estimates And Forecasts, By Technology (2020-2032) (USD Billion)
12.5.2.5 Africa Thermal Imaging Market Estimates And Forecasts, By Type (2020-2032) (USD Billion)
12.5.2.6 Africa Thermal Imaging Market Estimates And Forecasts, By Application (2020-2032) (USD Billion)
12.5.2.7 Africa Thermal Imaging Market Estimates And Forecasts, By Industry Vertical (2020-2032) (USD Billion)
12.5.2.8 South Africa
12.5.2.8.1 South Africa Thermal Imaging Market Estimates And Forecasts, By Product Type (2020-2032) (USD Billion)
12.5.2.8.2 South Africa Thermal Imaging Market Estimates And Forecasts, By Technology (2020-2032) (USD Billion)
12.5.2.8.3 South Africa Thermal Imaging Market Estimates And Forecasts, By Type (2020-2032) (USD Billion)
12.5.2.8.4 South Africa Thermal Imaging Market Estimates And Forecasts, By Application (2020-2032) (USD Billion)
12.5.2.8.5 South Africa Thermal Imaging Market Estimates And Forecasts, By Industry Vertical (2020-2032) (USD Billion)
12.5.2.9 Nigeria
12.5.2.9.1 Nigeria Thermal Imaging Market Estimates And Forecasts, By Product Type (2020-2032) (USD Billion)
12.5.2.9.2 Nigeria Thermal Imaging Market Estimates And Forecasts, By Technology (2020-2032) (USD Billion)
12.5.2.9.3 Nigeria Thermal Imaging Market Estimates And Forecasts, By Type (2020-2032) (USD Billion)
12.5.2.9.4 Nigeria Thermal Imaging Market Estimates And Forecasts, By Application (2020-2032) (USD Billion)
12.5.2.9.5 Nigeria Thermal Imaging Market Estimates And Forecasts, By Industry Vertical (2020-2032) (USD Billion)
12.5.2.10 Rest Of Africa
12.5.2.10.1 Rest Of Africa Thermal Imaging Market Estimates And Forecasts, By Product Type (2020-2032) (USD Billion)
12.5.2.10.2 Rest Of Africa Thermal Imaging Market Estimates And Forecasts, By Technology (2020-2032) (USD Billion)
12.5.2.10.3 Rest Of Africa Thermal Imaging Market Estimates And Forecasts, By Type (2020-2032) (USD Billion)
12.5.2.10.4 Rest Of Africa Thermal Imaging Market Estimates And Forecasts, By Application (2020-2032) (USD Billion)
12.5.2.10.5 Rest Of Africa Thermal Imaging Market Estimates And Forecasts, By Industry Vertical (2020-2032) (USD Billion)
12.6 Latin America
12.6.1 Trends Analysis
12.6.2 Latin America Thermal Imaging Market Estimates And Forecasts, By Country (2020-2032) (USD Billion)
12.6.3 Latin America Thermal Imaging Market Estimates And Forecasts, By Product Type (2020-2032) (USD Billion)
12.6.4 Latin America Thermal Imaging Market Estimates And Forecasts, By Technology (2020-2032) (USD Billion)
12.6.5 Latin America Thermal Imaging Market Estimates And Forecasts, By Type (2020-2032) (USD Billion)
12.6.6 Latin America Thermal Imaging Market Estimates And Forecasts, By Application (2020-2032) (USD Billion)
12.6.7 Latin America Thermal Imaging Market Estimates And Forecasts, By Industry Vertical (2020-2032) (USD Billion)
12.6.8 Brazil
12.6.8.1 Brazil Thermal Imaging Market Estimates And Forecasts, By Product Type (2020-2032) (USD Billion)
12.6.8.2 Brazil Thermal Imaging Market Estimates And Forecasts, By Technology (2020-2032) (USD Billion)
12.6.8.3 Brazil Thermal Imaging Market Estimates And Forecasts, By Type (2020-2032) (USD Billion)
12.6.8.4 Brazil Thermal Imaging Market Estimates And Forecasts, By Application (2020-2032) (USD Billion)
12.6.8.5 Brazil Thermal Imaging Market Estimates And Forecasts, By Industry Vertical (2020-2032) (USD Billion)
12.6.9 Argentina
12.6.9.1 Argentina Thermal Imaging Market Estimates And Forecasts, By Product Type (2020-2032) (USD Billion)
12.6.9.2 Argentina Thermal Imaging Market Estimates And Forecasts, By Technology (2020-2032) (USD Billion)
12.6.9.3 Argentina Thermal Imaging Market Estimates And Forecasts, By Type (2020-2032) (USD Billion)
12.6.9.4 Argentina Thermal Imaging Market Estimates And Forecasts, By Application (2020-2032) (USD Billion)
12.6.9.5 Argentina Thermal Imaging Market Estimates And Forecasts, By Industry Vertical (2020-2032) (USD Billion)
12.6.10 Colombia
12.6.10.1 Colombia Thermal Imaging Market Estimates And Forecasts, By Product Type (2020-2032) (USD Billion)
12.6.10.2 Colombia Thermal Imaging Market Estimates And Forecasts, By Technology (2020-2032) (USD Billion)
12.6.10.3 Colombia Thermal Imaging Market Estimates And Forecasts, By Type (2020-2032) (USD Billion)
12.6.10.4 Colombia Thermal Imaging Market Estimates And Forecasts, By Application (2020-2032) (USD Billion)
12.6.10.5 Colombia Thermal Imaging Market Estimates And Forecasts, By Industry Vertical (2020-2032) (USD Billion)
12.6.11 Rest Of Latin America
12.6.11.1 Rest Of Latin America Thermal Imaging Market Estimates And Forecasts, By Product Type (2020-2032) (USD Billion)
12.6.11.2 Rest Of Latin America Thermal Imaging Market Estimates And Forecasts, By Technology (2020-2032) (USD Billion)
12.6.11.3 Rest Of Latin America Thermal Imaging Market Estimates And Forecasts, By Type (2020-2032) (USD Billion)
12.6.11.4 Rest Of Latin America Thermal Imaging Market Estimates And Forecasts, By Application (2020-2032) (USD Billion)
12.6.11.5 Rest Of Latin America Thermal Imaging Market Estimates And Forecasts, By Industry Vertical (2020-2032) (USD Billion)
13. Company Profiles
13.1 FLIR Systems
13.1.1 Company Overview
13.1.2 Financial
13.1.3 Products/ Services Offered
13.1.4 SWOT Analysis
13.2 Teledyne Technologies
13.2.1 Company Overview
13.2.2 Financial
13.2.3 Products/ Services Offered
13.2.4 SWOT Analysis
13.3 Raytheon Technologies
13.3.1 Company Overview
13.3.2 Financial
13.3.3 Products/ Services Offered
13.3.4 SWOT Analysis
13.4 Leonardo DRS
13.4.1 Company Overview
13.4.2 Financial
13.4.3 Products/ Services Offered
13.4.4 SWOT Analysis
13.5 L3 Technologies
13.5.1 Company Overview
13.5.2 Financial
13.5.3 Products/ Services Offered
13.5.4 SWOT Analysis
13.6 Seek Thermal
13.6.1 Company Overview
13.6.2 Financial
13.6.3 Products/ Services Offered
13.6.4 SWOT Analysis
13.7 Opgal
13.7.1 Company Overview
13.7.2 Financial
13.7.3 Products/ Services Offered
13.7.4 SWOT Analysis
13.8 HIKVISION
13.8.1 Company Overview
13.8.2 Financial
13.8.3 Products/ Services Offered
13.8.4 SWOT Analysis
13.9 Axis Communications
13.9.1 Company Overview
13.9.2 Financial
13.9.3 Products/ Services Offered
13.9.4 SWOT Analysis
13.10 FLIR OEM Solutions
13.10.1 Company Overview
13.10.2 Financial
13.10.3 Products/ Services Offered
13.10.4 SWOT Analysis
14. Use Cases and Best Practices
15. Conclusion
An accurate research report requires proper strategizing as well as implementation. There are multiple factors involved in the completion of good and accurate research report and selecting the best methodology to compete the research is the toughest part. Since the research reports we provide play a crucial role in any company’s decision-making process, therefore we at SNS Insider always believe that we should choose the best method which gives us results closer to reality. This allows us to reach at a stage wherein we can provide our clients best and accurate investment to output ratio.
Each report that we prepare takes a timeframe of 350-400 business hours for production. Starting from the selection of titles through a couple of in-depth brain storming session to the final QC process before uploading our titles on our website we dedicate around 350 working hours. The titles are selected based on their current market cap and the foreseen CAGR and growth.
The 5 steps process:
Step 1: Secondary Research:
Secondary Research or Desk Research is as the name suggests is a research process wherein, we collect data through the readily available information. In this process we use various paid and unpaid databases which our team has access to and gather data through the same. This includes examining of listed companies’ annual reports, Journals, SEC filling etc. Apart from this our team has access to various associations across the globe across different industries. Lastly, we have exchange relationships with various university as well as individual libraries.

Step 2: Primary Research
When we talk about primary research, it is a type of study in which the researchers collect relevant data samples directly, rather than relying on previously collected data. This type of research is focused on gaining content specific facts that can be sued to solve specific problems. Since the collected data is fresh and first hand therefore it makes the study more accurate and genuine.
We at SNS Insider have divided Primary Research into 2 parts.
Part 1 wherein we interview the KOLs of major players as well as the upcoming ones across various geographic regions. This allows us to have their view over the market scenario and acts as an important tool to come closer to the accurate market numbers. As many as 45 paid and unpaid primary interviews are taken from both the demand and supply side of the industry to make sure we land at an accurate judgement and analysis of the market.
This step involves the triangulation of data wherein our team analyses the interview transcripts, online survey responses and observation of on filed participants. The below mentioned chart should give a better understanding of the part 1 of the primary interview.

Part 2: In this part of primary research the data collected via secondary research and the part 1 of the primary research is validated with the interviews from individual consultants and subject matter experts.
Consultants are those set of people who have at least 12 years of experience and expertise within the industry whereas Subject Matter Experts are those with at least 15 years of experience behind their back within the same space. The data with the help of two main processes i.e., FGDs (Focused Group Discussions) and IDs (Individual Discussions). This gives us a 3rd party nonbiased primary view of the market scenario making it a more dependable one while collation of the data pointers.
Step 3: Data Bank Validation
Once all the information is collected via primary and secondary sources, we run that information for data validation. At our intelligence centre our research heads track a lot of information related to the market which includes the quarterly reports, the daily stock prices, and other relevant information. Our data bank server gets updated every fortnight and that is how the information which we collected using our primary and secondary information is revalidated in real time.

Step 4: QA/QC Process
After all the data collection and validation our team does a final level of quality check and quality assurance to get rid of any unwanted or undesired mistakes. This might include but not limited to getting rid of the any typos, duplication of numbers or missing of any important information. The people involved in this process include technical content writers, research heads and graphics people. Once this process is completed the title gets uploader on our platform for our clients to read it.
Step 5: Final QC/QA Process:
This is the last process and comes when the client has ordered the study. In this process a final QA/QC is done before the study is emailed to the client. Since we believe in giving our clients a good experience of our research studies, therefore, to make sure that we do not lack at our end in any way humanly possible we do a final round of quality check and then dispatch the study to the client.
BY PRODUCT TYPE
Handheld Thermal Cameras
Fixed Thermal Cameras
BY TYPE
Thermal Modules
Thermal Cameras
Thermal Scopes
BY TECHNOLOGY
Cooled
Uncooled
BY APPLICATION
Monitoring & Inspection
Security & Surveillance
Detection & Measurement
BY INDUSTRY VERTICAL
Industrial
Residential
Automotive
Oil & Gas
Commercial
Aerospace & Defense
Healthcare & Life Sciences
Food & Beverages
Request for Segment Customization as per your Business Requirement: Segment Customization Request
REGIONAL COVERAGE:
North America
US
Canada
Mexico
Europe
Eastern Europe
Poland
Romania
Hungary
Turkey
Rest of Eastern Europe
Western Europe
Germany
France
UK
Italy
Spain
Netherlands
Switzerland
Austria
Rest of Western Europe
Asia Pacific
China
India
Japan
South Korea
Vietnam
Singapore
Australia
Rest of Asia Pacific
Middle East & Africa
Middle East
UAE
Egypt
Saudi Arabia
Qatar
Rest of the Middle East
Africa
Nigeria
South Africa
Rest of Africa
Latin America
Brazil
Argentina
Colombia
Rest of Latin America
Request for Country Level Research Report: Country Level Customization Request
AVAILABLE CUSTOMIZATION:
With the given market data, SNS Insider offers customization as per the company’s specific needs. The following customization options are available for the report:
Product Analysis
Criss-Cross segment analysis (e.g. Product X Application)
Product Matrix which gives a detailed comparison of product portfolio of each company
Geographic Analysis
Additional countries in any of the regions
Company Information
Detailed analysis and profiling of additional market players (Up to five)
The IR Camera Market Size was valued at USD 8.02 billion in 2023 and is projected to grow at a robust CAGR of 7.19% to reach USD 14.98 billion by 2032.
The Molded Interconnect Device Market Size was valued at USD 1.75 billion in 2023 and is expected to grow at 13.64% CAGR to reach USD 5.51 billion by 2032
The Consumer Network Attached Storage Market Size was valued at USD 5.52 Billion in 2023 and is expected to grow at a CAGR of 12.18% by forecast 2024-2032.
The Environmental Sensors Market was valued at USD 1.36 billion in 2023 and is expected to reach USD 3.33 billion by 2032, growing at a CAGR of 10.53% over the forecast period 2024-2032.
The Capacitive Stylus Market size was valued at USD 9.6 billion in 2023 and is expected to grow to USD 25.52 billion by 2032 and grow at a CAGR of 11.48% over the forecast period of 2024-2032.
The Automatic Ticket Machine Market Size was valued at USD 13.19 Billion in 2023 and is expected to grow at 13.11% CAGR to reach USD 39.91 Billion by 2032.

Hi! Click one of our member below to chat on Phone
© 2025 All Rights Reserved by SNS Insider Pvt Ltd


