Telepresence Equipment Market Size & Trends:
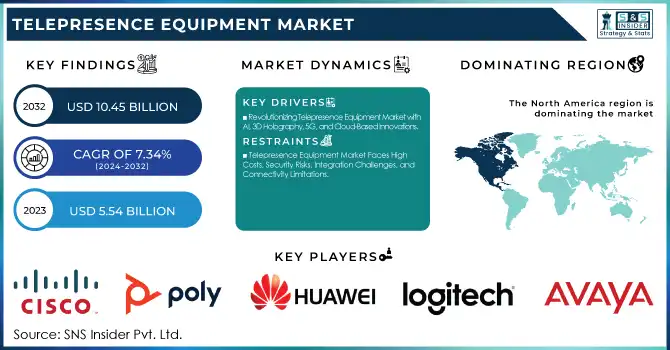
The Telepresence Equipment Market Size was valued at USD 5.54 billion in 2023 and is expected to reach USD 10.45 billion by 2032, growing at a CAGR of 7.34% over the forecast period 2024-2032. Demand for immersive and effective remote collaboration is driving the growth of the Telepresence Equipment Market in enterprises, healthcare, and educational settings. New technologies like 4K video, AI-based enhancement, and cloud integration are making user experiences better.
To Get more information on Telepresence Equipment Market - Request Free Sample Report
More and more businesses owe their increasingly advanced features like smart framing, smart noise cancellation, and automation analytics to the time-tested AI-powered automation. Improved user-friendliness, security, and hybrid work trends are driving mass-market adoption across various sectors.
Telepresence Equipment Market Dynamics
Key Drivers:
-
Revolutionizing Telepresence Equipment Market with AI, 3D Holography, 5G, and Cloud-Based Innovations
Driving the telepresence equipment market are the increasing need for remote collaboration and the burgeoning atmosphere of hybrid work scenarios across verticals. As companies look to save money and time, the rapid adoption of immersive telepresence solutions is delivering realistic human-to-human interaction in high-definition, virtual environments. This is further increasing the market growth in healthcare, education, and corporate sectors due to an increasing reliance on video conferencing. Moreover, AI-powered real-time translations, 3D holographic displays, and cloud-based telepresence are making the user experience better than ever which is adding to the appeal of these solutions further. The rapid expansion of 5G networks and edge computing is likewise anticipated to enhance connectivity and reduce latency, allowing for uninterrupted telepresence experiences.
Restrain:
-
Telepresence Equipment Market Faces High Costs, Security Risks, Integration Challenges, and Connectivity Limitations
High initial costs and the requirement of infrastructure are the key restraints faced by the telepresence equipment market. In particular, the immersive solutions of telepresence require state-of-the-art hardware, ultra-high-speed internet, and specialized software, which makes them suitable primarily for bigger companies. Some challenges, including the potential risks associated with hacking and privacy issues, as telepresence systems deal with corporate and personal data. In particular, the integration to existing IT infrastructure complexity restricts adoption even further, especially for clients acting on a legacy basis. Additionally, slow network connectivity bottlenecks in telepresence experience reducing user experience and user satisfaction, particularly for telepresence in developing regions where internet speeds fluctuate greatly.
Opportunity:
-
Expanding Telepresence Market with AI AR VR IoT Smart Offices Telemedicine and Virtual Tourism Growth
Market opportunities exist by linking telepresence with emerging technologies such as AR/VR, IoT, and AI-based analytics. Smart offices and digital transformation in enterprises are driving market opportunities. If only we could come up with affordable, easy-to-access, telepresence solutions powered by AI, we can see the adoption by the SMEs as well. Also, the production domain for key player participants is expanding due to the demand for telepresence in remote healthcare (telemedicine) as well as virtual tourism. With this fast-evolving industry, forming strategic partnerships and bringing new products to market will be key for any company hoping to win its fair share of turf.
Challenges:
-
The Telepresence Market Faces Competition from Low-Cost Alternatives User Hesitance and Rapid Technology Evolution Challenges
The major challenge is the increase in competition from inexpensive video conferencing systems that deliver basic telepresence features at a low price. Even though immersive telepresence delivers better engagement, businesses tend to choose simpler and more cost-effective alternative solutions such as Zoom, Microsoft Teams, and Google Meet. Moreover, user hesitance to migrate away from traditional conferencing solutions to high-end telepresence systems is another adoption choke point, stemming from the need to learn and incorporate new functional processes into daily operations. There is a risk of the rapid evolution of AI and VR technologies, as all emerging innovations could disrupt the current telepresence landscape, forcing everyone on the market to keep upgrading and innovating.
Telepresence Equipment Market Segmentation Outlook
By Product
In 2023, the 2D Telepresence held the largest revenue share of 72.6%, due to its high consumption in corporate, healthcare, and educational applications. 2D solutions have become the most popular due to their affordability, ease of deployment, and adaptability with existing communication platforms. They offer dependable virtual meetings with 1080p video and audio for effective communication. While telepresence has been around for some time, the changing expectations of customers and the technology landscape mean an evolution to more immersive and interactive experiences and a trend towards next-gen telepresence solutions.
The 3D Holographic Telepresence is expected to achieve the fastest CAGR from 2024-2032 due to technological advancements in AI, 5G, and augmented reality (AR). In contrast to conventional video conferencing tools that offer you an alternative to an in-person appearance, 3D holographic technology offers a (virtual) presence so realistic that it evokes a true-to-life experience. Telemedicine, remote education, and virtual events are expected to be prime industry users because of the improved communication and immersive power they provide. Moreover, rising investments in smart workplaces and the metaverse are also expected to spur the adoption of 3D holographic telepresence.
By Type
In 2023, the market share was dominated by Immersive Telepresence, accounting for 30.8%, and it is also anticipated to grow at the highest CAGR from 2024 to 2032. The growth is aided by the increasing high-quality, life-like virtual interactions in corporate meetings, healthcare, and education. Companies have started moving towards immersive telepresence to provide a better remote collaboration experience, increase involvement, and cut down on travel expenses. Emerging hybrid work models and integration of technologies like AI 5G and AR are making immersive solutions widely available, thus boosting the adoption further. Financial investments in such telepresence solutions that allow for real-time, interactive experiences, are also coming from industries like telemedicine, telecommunication, defense, and education virtual tourism. Holographic display, real-time 3D rendering, and other technologies are continuously addressing the realism, effectiveness, and fidelity of this telepresence. The market is primed for explosive growth as costs decrease and infrastructures improve, making immersive telepresence one of the most important innovations to the future of virtual communication.
By End Use
The market share of Large Enterprises accounted for 58.1 % in 2023. Telepresence solutions have seen a wider adoption among large corporations willing to invest in high-end immersive systems for effective remote collaboration, lowering travel costs and improving operations efficiencies. Telepresence technology has enabled seamless communication with, and access to, anyone globally, and these technologies are leveraged across industries from IT & telecom, to finance, and even healthcare. However large enterprises offer a dedicated IT infrastructure, high-speed internet, and sophisticated security frameworks, making telepresence a critical component for business continuity.
Medium Enterprises will register the highest growth during the forecast period from 2024-2032. The latest telepresence technologies powered by cloud and AI are easing adoption in mid-sized businesses with less complex infrastructure investment requirements. With increasing competition, medium enterprises are focusing on improving customer engagement, efficient remote operations, and controlling overheads, which will drive market growth. The growing demand for telepresence technology in this segment will be fueled by the increase in internet penetration and the availability of affordable solutions.
Telepresence Equipment Market Regional Analysis
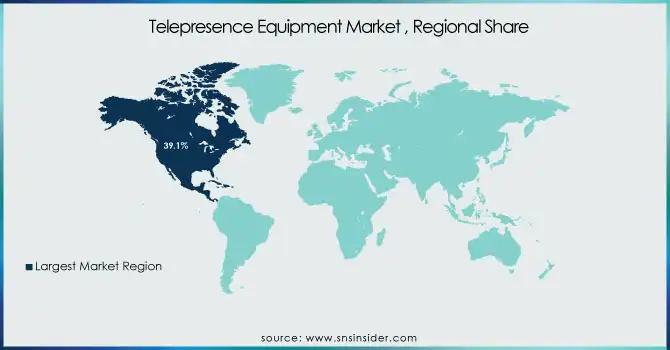
North America held the market share with 39.1% in 2023. The dominance of North America can be attributed to the strong presence of leading telepresence solution providers such as Cisco Systems, Poly (HP), and Zoom Video Communication, among others. With access to 5G, gigabit internet, and significant enterprise adoption of remote collaboration software, the region is well-positioned. Telepresence robots have been widely used by healthcare in the U.S. to drive innovations for remote consultations and surgeries. Furthermore, well-known technology players such as Meta and Microsoft are also aggressively working on immersive telepresence solutions aimed at virtual collaboration and the metaverse, adding further momentum to the market.
Asia Pacific is anticipated to grow with the fastest CAGR during the forecast period 2024-2032 owing to rising adoption of digital transformation, growing internet penetration, and government efforts in promoting remote work and education. China, Japan, and India are at the forefront of corporate and, particularly healthcare telepresence adoption. AI-enabled virtual presence solutions for smart business environments are being commercially explored by players like Tencent and Huawei. NTT and Sony are testing 3D holographic telepresence in Japan. Asia Pacific continues to be the most lucrative market as the demand for affordable telepresence is being driven by the rapid expansion of startups in India's edtech sector, especially Byju's.
Get Customized Report as per Your Business Requirement - Enquiry Now
Key Players
Some of the major players in the Telepresence Equipment Market are:
-
Cisco Systems (Webex Room Kit, Webex Desk Pro)
-
Poly (HP Inc.) (Poly Studio X50, Poly G7500)
-
Huawei Technologies (IdeaHub, TE10 Telepresence Endpoint)
-
Logitech (Rally Plus, MeetUp Conference Camera)
-
Avaya (XT5000 Telepresence, CU360 Collaboration Unit)
-
Microsoft (Surface Hub 2S, Teams Rooms System)
-
Zoom Video Communications (Zoom Rooms, Zoom Meetings)
-
Sony Corporation (Bravia Professional Displays, PCS-XG100H Video Conference System)
-
Lifesize (Icon 700, Lifesize Cloud)
-
ZTE Corporation (ZTE T900, ZTE ET701 Telepresence System)
-
Vidyo (VidyoRoom HD-3, VidyoConnect)
-
Yealink (Yealink MVC960, Yealink MeetingBar A30)
-
Barco (ClickShare CX-50, weConnect Virtual Classroom)
-
BlueJeans by Verizon (BlueJeans Rooms, BlueJeans Gateway for Teams)
-
Pexip (Infinity Telepresence Gateway, Pexip Room)
Recent Trends
-
In March 2024, Cisco launched the AI-powered Board Pro G2 and Desk Phone 9800 Series to enhance hybrid work collaboration with advanced video, audio, and productivity features.
-
In February 2025, HP Poly launched the Poly Studio V12, a compact USB video bar with a 20MP 4K camera and AI-powered noise cancellation for enhanced meeting experiences.
| Report Attributes | Details |
|---|---|
| Market Size in 2023 | USD 5.54 Billion |
| Market Size by 2032 | USD 10.45 Billion |
| CAGR | CAGR of 7.34% From 2024 to 2032 |
| Base Year | 2023 |
| Forecast Period | 2024-2032 |
| Historical Data | 2020-2022 |
| Report Scope & Coverage | Market Size, Segments Analysis, Competitive Landscape, Regional Analysis, DROC & SWOT Analysis, Forecast Outlook |
| Key Segments | • By Product (2D Telepresence, 3D Holographic Telepresence) • By Type (Multi-Codec Telepresence, Personal Telepresence, Immersive Telepresence, Room-based Telepresence) • By End Use (Small Enterprise, Medium Enterprise, Large Enterprise) |
| Regional Analysis/Coverage | North America (US, Canada, Mexico), Europe (Eastern Europe [Poland, Romania, Hungary, Turkey, Rest of Eastern Europe] Western Europe] Germany, France, UK, Italy, Spain, Netherlands, Switzerland, Austria, Rest of Western Europe]), Asia Pacific (China, India, Japan, South Korea, Vietnam, Singapore, Australia, Rest of Asia Pacific), Middle East & Africa (Middle East [UAE, Egypt, Saudi Arabia, Qatar, Rest of Middle East], Africa [Nigeria, South Africa, Rest of Africa], Latin America (Brazil, Argentina, Colombia, Rest of Latin America) |
| Company Profiles | Cisco Systems, Poly (HP Inc.), Huawei Technologies, Logitech, Avaya, Microsoft, Zoom Video Communications, Sony Corporation, Lifesize, ZTE Corporation, Vidyo, Yealink, Barco, BlueJeans by Verizon, Pexip. |
