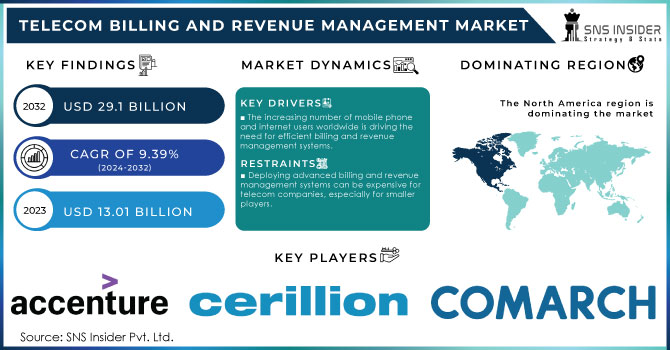
The Telecom Billing and Revenue Management Market was valued at USD 17.24 billion in 2023 and is expected to reach USD 43.03 billion by 2032, growing at a CAGR of 10.73% over the forecast period 2025-2032.
Get more information on Telecom Billing and Revenue Management Market - Request Sample Report
Average billing cycle time reduction was one of the key areas of focus with telecom billing systems as operators aimed at lower billing cycle times for more rapid payment processing. Billing error rates were limited using advanced automation and AI technologies that led to higher accuracy in the invoices which led to reduced customer complaints. We are witnessing a significant move towards billing automation, with more and more telecom operators deploying AI and robotic solution-driven billing to enliven their billing. Telecom companies also improved their fraud detection capabilities, deploying advanced analytics and machine learning algorithms to minimize revenue leakage and improve detection of fraudulent activities.
Key Drivers:
Rising Mobile Subscriptions and Cloud Adoption Fuel Growth in Telecom Billing and Revenue Management Market
Increasing mobile subscriptions, rapid adoption of cloud-based solutions, and growing demand for real-time customer billing are some of the major factors expected to drive the growth of global telecom billing and revenue management market over the forecast period. With greater complexity in 5G networks and IoT connectivity comes the need for more sophisticated billing, which could serve as a strong growth driver for the market. Furthermore, regulations and the necessity for fraud detection provide the impetus for investing in extensive revenue management systems. In addition, the increasing penetration of digital services including OTT and mobile banking also drives the demand.
Restrain:
High Capital Costs and Integration Challenges Hinder Growth of Telecom Billing and Revenue Management Market
High upfront capital and operational costs due to the implementation of advanced billing solution, and availability of open-source billing solution are restraining the growth of this market. The high-cost nature of the telecom business creates a huge financial burden on operators, especially in the small-mid segment, to migrate from legacy systems to next-gen systems that are optimised for an automated environment. Furthermore, integration challenges with current IT infrastructure and multiple other 3rd part applications are also difficult to manage. This takes time and effort to enable interoperability between billing systems, CRM, and network management tools to function smoothly which ultimately results in implementation delays and higher costs.
Opportunity:
5G IoT Adoption and Cloud Solutions Create Profitable Opportunities in Telecom Billing and Revenue Management
Due to 5G & IoT adoption and cloud telecom billing solution, there are great market growth opportunities in the telecom billing and revenue management market. Wireless, fibre, fixed-line operators must also be able to capitalise on growing demand for real-time billing, Robo and AI based analytics to improve efficiencies and customer experience. New monetization channels: Evolving digital services like mobile payments, OTT and subscription-based model enable new revenue streams. Moreover, growing telecom infrastructure in developing areas and the transition to converging billing systems represent profitable opportunities.
Challenges:
Cyber Threats Fraud Risks and Evolving Services Challenge Telecom Revenue Management in Digital Landscape
Telecom revenue management is also grappling with the problems of a much higher risk of cyber threats and fraud. As more and more operators migrate to cloud billing solutions, security vulnerabilities are one of the biggest concerns as they manage sensitive customer data and financial transactions. Telecom service providers constantly face cyber threats where number of data breaches and leakage of revenue due to frauds like SIM cloning and account takeovers can lead to huge potential loss of money and tarnishing the reputation of the organization. Besides, the emergence of telecom services like 5G and IoT in the ever-evolving digital landscape pose a continuous challenge of innovating subscription billing models to keep pace with the demands of the consumers, forcing operators to adapt their services in real-time.
By Solution
In 2023, software dominated the telecom billing and revenue management market with a 62.3% of share, owing to the necessity of having software to automate the complexity of billing processes, support the real-time processing of large transaction volumes, and sustain new business models. Telecom operators have been increasingly driven towards software solution as they need to seamlessly integrate with the existing telecom infrastructure and also provide instant billing and data. Software, being scalable, flexible, efficient, a natural choice for large style telecoms to drive many operations, and thus the reason for market overview.
Services are anticipated to have the highest CAGR during the forecast period (2024-2032) as telecom operators look to streamline and tailor their billing systems. As technology such as 5G, IoT, cloud computing is rapidly advancing, telecom companies need focused consulting, implementation & maintenance services for smooth integration and operation. The growing complexity of the telecom services and also the requirement for checking regulation and detecting fraud, increases the demand for these services. Moreover, the growing adoption of managed services by operators to lower costs, enable better scalability, and improve customer experience will also continue to aid the growth of the services segment.
By Deployment Type
In 2023, on-premises deployment dominated the telecom billing and revenue management market with a 65.8% of share, due to its proven security features, control over infrastructure, systems can be customized as per specific organization needs, etc. On-premises solutions are a favorite of telecom operators, especially large enterprises, since they provide full control over data and compliance with strict regulatory requirements. Given the classification and sensitivity of the data and the legacy infrastructure that operators have, on-premises systems offer a higher level of security, reliability, and data sovereignty.
The cloud-based solutions are projected to witness the fastest CAGR growth from 2024-2032, attributed to a rising demand for scalability, flexibility, and cost-effectiveness. With the cloud, telecom operators now can now lower the capital expenditure burden and depreciating their set upon maintenance cost by switching to a subscription-based model. Telecoms need more agile billing systems that can meet multiple dynamic demands with ease capabilities that are a breeze to provide in the cloud as 5G and IoT grow. It also offers attractiveness for operators to migrate to the cloud offering real-time data analytics, AI integration, and faster deployment times to expedite operations and improve customer experience.
By Telecom Operator
In 2023, mobile operators dominated the telecom billing and revenue management market with a 61.7% of share. This is primarily attributed to the number of mobile subscriptions worldwide being in the billions, alongside the rising need for data services. The mobile operator is always at large scale, real-time data consumption and complex pricing, hence need an advanced billing system running in the background. The rise of 5G and explosive mobile data traffic growth underscores the need for sophisticated billing and revenue management solutions that ensure accurate billing, revenue assurance and customer satisfaction to maintain operator dominance in the market.
The Internet Service Provider segment is projected to witness the fastest CAGR during the forecast period from 2024 to 2032, due to the penetration of broadband and fiber-optic services. With the number of people and businesses using high-speed internet and data-consuming applications, ISPs need billing solutions that scale subscription-based services, tiered pricing models, and customer segmentation. Moreover, digital services such as OTT, cloud, and e-commerce demand continuous and high-speed internet, making ISPs migrate towards flexible and scalable revenue management systems. As ISPs continue their digital transformation with the provision of next-generation services, continued growth of billing and revenue management solutions in ISPs is to be expected over the next several years.

Need any customization research on Telecom Billing and Revenue Management Market - Enquiry Now
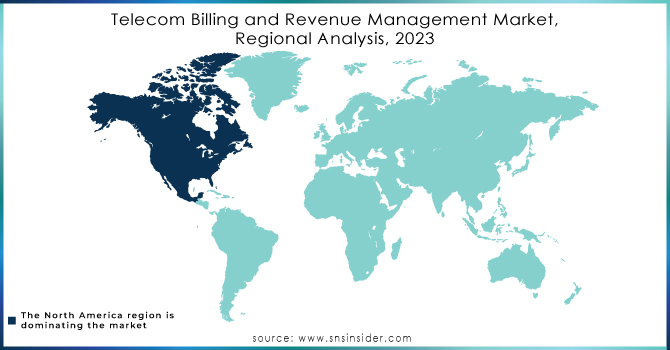
North America accounted for 32.4% share in the telecom billing & revenue management market in 2023, due to presence of large telecom service providers such as Verizon, AT&T, T-Mobile, and others. To service a large subscriber base and envisage a differentiated offering, these operators have heavily focused on advanced billing solutions. The advanced pricing models that can charge customers on the basis of complex, real-time data usage and dynamic pricing models necessitating sophisticated billing systems has spurred the demand for sophisticated billing systems in North America, as this region has been leading in the early adoption of 5G, cloud computing, and IoT technologies. Moreover, the regulatory compliance like CCPA and GDPR mandate a strong revenue management solution which leads North America to dominate the market.
The Asia Pacific region is anticipated to experience the fastest growth in the CAGR period of 2024-2032. Cloud-based billing and revenue management systems are being deployed by telecom operators in this region to manage the scale and complexity of their operations as mobile services and broadband continue to penetrate this market, further supported by the emergence of IoT and 5G. Next-gen Billing solutions are being leveraged to enhance customer experience and enable new pricing models in countries such as China, India with companies such as China Mobile, Bharti Airtel, Japan, NTT Group, etc. Telecom Billing Market by Geography (APAC, Europe, MEA, North America, and South America) The increasing middle class, urbanization, and providing internet services in this region offer enormous opportunities for telecom billing growth.
Some of the major players in the Telecom Billing and Revenue Management Market are:
Amdocs (SmartBSS, Amdocs Optima)
Ericsson (Ericsson Charging System, Ericsson Revenue Management)
Huawei (Billing and Revenue Management, Huawei CloudBSS)
Nokia (Cloud Billing, Nokia Revenue Management)
CSPi (Access Management, CSPi’s Telecom Billing Solution)
Subex (Revenue Assurance, Fraud Management)
Comarch (Comarch BSS, Comarch Billing)
Tech Mahindra (Revenue Assurance, Cloud Billing Solutions)
Tata Consultancy Services (TCS) (BSS Suite, TCS Billing Platform)
ZTE Corporation (ZTE Billing, ZTE Revenue Management)
NEC Corporation (Billing Solutions, Revenue Management Solutions)
Redknee Solutions (Redknee Unified, Redknee Billing)
Optiva (Optiva Billing and Revenue Management, Optiva Digital Charging)
BSS/OSS Corporation (BSS/OSS Suite, Telecom Billing Systems)
Aria Systems (Cloud Billing, Subscription Management)
Vubiquity (Billing Solutions, Video Content Monetization)
Intec Systems (InterconnecT, Intec Billing Solution)
Matrixx Software (Matrixx Charging, Matrixx Revenue Management)
BillingPlatform (BillingPlatform, Revenue Recognition)
Capgemini (Revenue Assurance, BSS Solutions)
In August 2024, Ericsson and Wipro have transformed Odido's billing experience by migrating 5 million customers to a cloud-native billing platform, enhancing customer service and operational efficiency.
In April 2024, KPN and Comarch expanded their 16-year partnership with a new five-year agreement, focusing on SaaS solutions and innovation. The collaboration aims to improve data quality, reduce customer complaints, and accelerate invoice payments.
| Report Attributes | Details |
|---|---|
| Market Size in 2023 | USD 17.24 Billion |
| Market Size by 2032 | USD 43.03 Billion |
| CAGR | CAGR of 10.73% From 2024 to 2032 |
| Base Year | 2023 |
| Forecast Period | 2024-2032 |
| Historical Data | 2020-2022 |
| Report Scope & Coverage | Market Size, Segments Analysis, Competitive Landscape, Regional Analysis, DROC & SWOT Analysis, Forecast Outlook |
| Key Segments | • By Solution (Software, Mediation, Services) • By Deployment Type (On-Premises, Cloud) • By Telecom Operator (Mobile Operators, Internet Service Providers (ISPs)) |
| Regional Analysis/Coverage | North America (US, Canada, Mexico), Europe (Eastern Europe [Poland, Romania, Hungary, Turkey, Rest of Eastern Europe] Western Europe] Germany, France, UK, Italy, Spain, Netherlands, Switzerland, Austria, Rest of Western Europe]), Asia Pacific (China, India, Japan, South Korea, Vietnam, Singapore, Australia, Rest of Asia Pacific), Middle East & Africa (Middle East [UAE, Egypt, Saudi Arabia, Qatar, Rest of Middle East], Africa [Nigeria, South Africa, Rest of Africa], Latin America (Brazil, Argentina, Colombia, Rest of Latin America) |
| Company Profiles | Informatica, Oracle, IBM, Collibra, Alation, SAP, Atlan, Erwin, Alex Solutions, Data3Sixty, Infogix, Adaptive, Orion Governance, Dataedo, Microsoft, Talend, Alteryx, Trifacta, MANTA, OvalEdge. |
Ans: The Telecom Billing and Revenue Management Market is expected to grow at a CAGR of 10.73% during 2024-2032.
Ans: Telecom Billing and Revenue Management Market size was USD 17.24 billion in 2023 and is expected to Reach USD 43.03 billion by 2032.
Ans: The major growth factor of the Telecom Billing and Revenue Management Market is the increasing demand for advanced, automated billing solutions to manage complex telecom services and optimize revenue streams.
Ans: The Mobile Operators segment dominated the Telecom Billing and Revenue Management Market in 2023.
Ans: North America dominated the Telecom Billing and Revenue Management Market in 2023.
Table of Content
1. Introduction
1.1 Market Definition
1.2 Scope (Inclusion and Exclusions)
1.3 Research Assumptions
2. Executive Summary
2.1 Market Overview
2.2 Regional Synopsis
2.3 Competitive Summary
3. Research Methodology
3.1 Top-Down Approach
3.2 Bottom-up Approach
3.3. Data Validation
3.4 Primary Interviews
4. Market Dynamics Impact Analysis
4.1 Market Driving Factors Analysis
4.1.1 Drivers
4.1.2 Restraints
4.1.3 Opportunities
4.1.4 Challenges
4.2 PESTLE Analysis
4.3 Porter’s Five Forces Model
5. Statistical Insights and Trends Reporting
5.1 Average Billing Cycle Time (2023)
5.2 Billing Error Rate (2023)
5.3 Percentage of Automated Billing
5.4 Fraud Detection Rate
6. Competitive Landscape
6.1 List of Major Companies, By Region
6.2 Market Share Analysis, By Region
6.3 Product Benchmarking
6.3.1 Product specifications and features
6.3.2 Pricing
6.4 Strategic Initiatives
6.4.1 Marketing and promotional activities
6.4.2 Distribution and Supply Chain Strategies
6.4.3 Expansion plans and new product launches
6.4.4 Strategic partnerships and collaborations
6.5 Technological Advancements
6.6 Market Positioning and Branding
7. Telecom Billing and Revenue Management Market Segmentation, By Solution
7.1 Chapter Overview
7.2 Software
7.2.1 Software Market Trends Analysis (2020-2032)
7.2.2 Software Market Size Estimates and Forecasts to 2032 (USD Billion)
7.3 Mediation
7.3.1 Mediation Market Trends Analysis (2020-2032)
7.3.2 Mediation Market Size Estimates and Forecasts to 2032 (USD Billion)
7.4 Services
7.4.1 Services Market Trends Analysis (2020-2032)
7.4.2 Services Market Size Estimates and Forecasts to 2032 (USD Billion)
8. Telecom Billing and Revenue Management Market Segmentation, By Deployment Type
8.1 Chapter Overview
8.2 On-Premises
8.2.1 On-Premises Market Trends Analysis (2020-2032)
8.2.2 On-Premises Market Size Estimates and Forecasts to 2032 (USD Billion)
8.3 Cloud
8.3.1 Cloud Market Trends Analysis (2020-2032)
8.3.2 Cloud Market Size Estimates and Forecasts to 2032 (USD Billion)
9. Telecom Billing and Revenue Management Market Segmentation, By Telecom Operator
9.1 Chapter Overview
9.2 Mobile Operators
9.2.1 Mobile Operators Market Trends Analysis (2020-2032)
9.2.2 Mobile Operators Market Size Estimates and Forecasts to 2032 (USD Billion)
9.3 Internet Service Providers (ISPs)
9.3.1 Internet Service Providers (ISPs) Market Trends Analysis (2020-2032)
9.3.2 Internet Service Providers (ISPs) Market Size Estimates and Forecasts to 2032 (USD Billion)
10. Regional Analysis
10.1 Chapter Overview
10.2 North America
10.2.1 Trends Analysis
10.2.2 North America Telecom Billing and Revenue Management Market Estimates and Forecasts, by Country (2020-2032) (USD Billion)
10.2.3 North America Telecom Billing and Revenue Management Market Estimates and Forecasts, By Solution (2020-2032) (USD Billion)
10.2.4 North America Telecom Billing and Revenue Management Market Estimates and Forecasts, By Deployment Type (2020-2032) (USD Billion)
10.2.5 North America Telecom Billing and Revenue Management Market Estimates and Forecasts, By Telecom Operator (2020-2032) (USD Billion)
10.2.6 USA
10.2.6.1 USA Telecom Billing and Revenue Management Market Estimates and Forecasts, By Solution (2020-2032) (USD Billion)
10.2.6.2 USA Telecom Billing and Revenue Management Market Estimates and Forecasts, By Deployment Type (2020-2032) (USD Billion)
10.2.6.3 USA Telecom Billing and Revenue Management Market Estimates and Forecasts, By Telecom Operator (2020-2032) (USD Billion)
10.2.7 Canada
10.2.7.1 Canada Telecom Billing and Revenue Management Market Estimates and Forecasts, By Solution (2020-2032) (USD Billion)
10.2.7.2 Canada Telecom Billing and Revenue Management Market Estimates and Forecasts, By Deployment Type (2020-2032) (USD Billion)
10.2.7.3 Canada Telecom Billing and Revenue Management Market Estimates and Forecasts, By Telecom Operator (2020-2032) (USD Billion)
10.2.8 Mexico
10.2.8.1 Mexico Telecom Billing and Revenue Management Market Estimates and Forecasts, By Solution (2020-2032) (USD Billion)
10.2.8.2 Mexico Telecom Billing and Revenue Management Market Estimates and Forecasts, By Deployment Type (2020-2032) (USD Billion)
10.2.8.3 Mexico Telecom Billing and Revenue Management Market Estimates and Forecasts, By Telecom Operator (2020-2032) (USD Billion)
10.3 Europe
10.3.1 Eastern Europe
10.3.1.1 Trends Analysis
10.3.1.2 Eastern Europe Telecom Billing and Revenue Management Market Estimates and Forecasts, by Country (2020-2032) (USD Billion)
10.3.1.3 Eastern Europe Telecom Billing and Revenue Management Market Estimates and Forecasts, By Solution (2020-2032) (USD Billion)
10.3.1.4 Eastern Europe Telecom Billing and Revenue Management Market Estimates and Forecasts, By Deployment Type (2020-2032) (USD Billion)
10.3.1.5 Eastern Europe Telecom Billing and Revenue Management Market Estimates and Forecasts, By Telecom Operator (2020-2032) (USD Billion)
10.3.1.6 Poland
10.3.1.6.1 Poland Telecom Billing and Revenue Management Market Estimates and Forecasts, By Solution (2020-2032) (USD Billion)
10.3.1.6.2 Poland Telecom Billing and Revenue Management Market Estimates and Forecasts, By Deployment Type (2020-2032) (USD Billion)
10.3.1.6.3 Poland Telecom Billing and Revenue Management Market Estimates and Forecasts, By Telecom Operator (2020-2032) (USD Billion)
10.3.1.7 Romania
10.3.1.7.1 Romania Telecom Billing and Revenue Management Market Estimates and Forecasts, By Solution (2020-2032) (USD Billion)
10.3.1.7.2 Romania Telecom Billing and Revenue Management Market Estimates and Forecasts, By Deployment Type (2020-2032) (USD Billion)
10.3.1.7.3 Romania Telecom Billing and Revenue Management Market Estimates and Forecasts, By Telecom Operator (2020-2032) (USD Billion)
10.3.1.8 Hungary
10.3.1.8.1 Hungary Telecom Billing and Revenue Management Market Estimates and Forecasts, By Solution (2020-2032) (USD Billion)
10.3.1.8.2 Hungary Telecom Billing and Revenue Management Market Estimates and Forecasts, By Deployment Type (2020-2032) (USD Billion)
10.3.1.8.3 Hungary Telecom Billing and Revenue Management Market Estimates and Forecasts, By Telecom Operator (2020-2032) (USD Billion)
10.3.1.9 Turkey
10.3.1.9.1 Turkey Telecom Billing and Revenue Management Market Estimates and Forecasts, By Solution (2020-2032) (USD Billion)
10.3.1.9.2 Turkey Telecom Billing and Revenue Management Market Estimates and Forecasts, By Deployment Type (2020-2032) (USD Billion)
10.3.1.9.3 Turkey Telecom Billing and Revenue Management Market Estimates and Forecasts, By Telecom Operator (2020-2032) (USD Billion)
10.3.1.10 Rest of Eastern Europe
10.3.1.10.1 Rest of Eastern Europe Telecom Billing and Revenue Management Market Estimates and Forecasts, By Solution (2020-2032) (USD Billion)
10.3.1.10.2 Rest of Eastern Europe Telecom Billing and Revenue Management Market Estimates and Forecasts, By Deployment Type (2020-2032) (USD Billion)
10.3.1.10.3 Rest of Eastern Europe Telecom Billing and Revenue Management Market Estimates and Forecasts, By Telecom Operator (2020-2032) (USD Billion)
10.3.2 Western Europe
10.3.2.1 Trends Analysis
10.3.2.2 Western Europe Telecom Billing and Revenue Management Market Estimates and Forecasts, by Country (2020-2032) (USD Billion)
10.3.2.3 Western Europe Telecom Billing and Revenue Management Market Estimates and Forecasts, By Solution (2020-2032) (USD Billion)
10.3.2.4 Western Europe Telecom Billing and Revenue Management Market Estimates and Forecasts, By Deployment Type (2020-2032) (USD Billion)
10.3.2.5 Western Europe Telecom Billing and Revenue Management Market Estimates and Forecasts, By Telecom Operator (2020-2032) (USD Billion)
10.3.2.6 Germany
10.3.2.6.1 Germany Telecom Billing and Revenue Management Market Estimates and Forecasts, By Solution (2020-2032) (USD Billion)
10.3.2.6.2 Germany Telecom Billing and Revenue Management Market Estimates and Forecasts, By Deployment Type (2020-2032) (USD Billion)
10.3.2.6.3 Germany Telecom Billing and Revenue Management Market Estimates and Forecasts, By Telecom Operator (2020-2032) (USD Billion)
10.3.2.7 France
10.3.2.7.1 France Telecom Billing and Revenue Management Market Estimates and Forecasts, By Solution (2020-2032) (USD Billion)
10.3.2.7.2 France Telecom Billing and Revenue Management Market Estimates and Forecasts, By Deployment Type (2020-2032) (USD Billion)
10.3.2.7.3 France Telecom Billing and Revenue Management Market Estimates and Forecasts, By Telecom Operator (2020-2032) (USD Billion)
10.3.2.8 UK
10.3.2.8.1 UK Telecom Billing and Revenue Management Market Estimates and Forecasts, By Solution (2020-2032) (USD Billion)
10.3.2.8.2 UK Telecom Billing and Revenue Management Market Estimates and Forecasts, By Deployment Type (2020-2032) (USD Billion)
10.3.2.8.3 UK Telecom Billing and Revenue Management Market Estimates and Forecasts, By Telecom Operator (2020-2032) (USD Billion)
10.3.2.9 Italy
10.3.2.9.1 Italy Telecom Billing and Revenue Management Market Estimates and Forecasts, By Solution (2020-2032) (USD Billion)
10.3.2.9.2 Italy Telecom Billing and Revenue Management Market Estimates and Forecasts, By Deployment Type (2020-2032) (USD Billion)
10.3.2.9.3 Italy Telecom Billing and Revenue Management Market Estimates and Forecasts, By Telecom Operator (2020-2032) (USD Billion)
10.3.2.10 Spain
10.3.2.10.1 Spain Telecom Billing and Revenue Management Market Estimates and Forecasts, By Solution (2020-2032) (USD Billion)
10.3.2.10.2 Spain Telecom Billing and Revenue Management Market Estimates and Forecasts, By Deployment Type (2020-2032) (USD Billion)
10.3.2.10.3 Spain Telecom Billing and Revenue Management Market Estimates and Forecasts, By Telecom Operator (2020-2032) (USD Billion)
10.3.2.11 Netherlands
10.3.2.11.1 Netherlands Telecom Billing and Revenue Management Market Estimates and Forecasts, By Solution (2020-2032) (USD Billion)
10.3.2.11.2 Netherlands Telecom Billing and Revenue Management Market Estimates and Forecasts, By Deployment Type (2020-2032) (USD Billion)
10.3.2.11.3 Netherlands Telecom Billing and Revenue Management Market Estimates and Forecasts, By Telecom Operator (2020-2032) (USD Billion)
10.3.2.12 Switzerland
10.3.2.12.1 Switzerland Telecom Billing and Revenue Management Market Estimates and Forecasts, By Solution (2020-2032) (USD Billion)
10.3.2.12.2 Switzerland Telecom Billing and Revenue Management Market Estimates and Forecasts, By Deployment Type (2020-2032) (USD Billion)
10.3.2.12.3 Switzerland Telecom Billing and Revenue Management Market Estimates and Forecasts, By Telecom Operator (2020-2032) (USD Billion)
10.3.2.13 Austria
10.3.2.13.1 Austria Telecom Billing and Revenue Management Market Estimates and Forecasts, By Solution (2020-2032) (USD Billion)
10.3.2.13.2 Austria Telecom Billing and Revenue Management Market Estimates and Forecasts, By Deployment Type (2020-2032) (USD Billion)
10.3.2.13.3 Austria Telecom Billing and Revenue Management Market Estimates and Forecasts, By Telecom Operator (2020-2032) (USD Billion)
10.3.2.14 Rest of Western Europe
10.3.2.14.1 Rest of Western Europe Telecom Billing and Revenue Management Market Estimates and Forecasts, By Solution (2020-2032) (USD Billion)
10.3.2.14.2 Rest of Western Europe Telecom Billing and Revenue Management Market Estimates and Forecasts, By Deployment Type (2020-2032) (USD Billion)
10.3.2.14.3 Rest of Western Europe Telecom Billing and Revenue Management Market Estimates and Forecasts, By Telecom Operator (2020-2032) (USD Billion)
10.4 Asia Pacific
10.4.1 Trends Analysis
10.4.2 Asia Pacific Telecom Billing and Revenue Management Market Estimates and Forecasts, by Country (2020-2032) (USD Billion)
10.4.3 Asia Pacific Telecom Billing and Revenue Management Market Estimates and Forecasts, By Solution (2020-2032) (USD Billion)
10.4.4 Asia Pacific Telecom Billing and Revenue Management Market Estimates and Forecasts, By Deployment Type (2020-2032) (USD Billion)
10.4.5 Asia Pacific Telecom Billing and Revenue Management Market Estimates and Forecasts, By Telecom Operator (2020-2032) (USD Billion)
10.4.6 China
10.4.6.1 China Telecom Billing and Revenue Management Market Estimates and Forecasts, By Solution (2020-2032) (USD Billion)
10.4.6.2 China Telecom Billing and Revenue Management Market Estimates and Forecasts, By Deployment Type (2020-2032) (USD Billion)
10.4.6.3 China Telecom Billing and Revenue Management Market Estimates and Forecasts, By Telecom Operator (2020-2032) (USD Billion)
10.4.7 India
10.4.7.1 India Telecom Billing and Revenue Management Market Estimates and Forecasts, By Solution (2020-2032) (USD Billion)
10.4.7.2 India Telecom Billing and Revenue Management Market Estimates and Forecasts, By Deployment Type (2020-2032) (USD Billion)
10.4.7.3 India Telecom Billing and Revenue Management Market Estimates and Forecasts, By Telecom Operator (2020-2032) (USD Billion)
10.4.8 Japan
10.4.8.1 Japan Telecom Billing and Revenue Management Market Estimates and Forecasts, By Solution (2020-2032) (USD Billion)
10.4.8.2 Japan Telecom Billing and Revenue Management Market Estimates and Forecasts, By Deployment Type (2020-2032) (USD Billion)
10.4.8.3 Japan Telecom Billing and Revenue Management Market Estimates and Forecasts, By Telecom Operator (2020-2032) (USD Billion)
10.4.9 South Korea
10.4.9.1 South Korea Telecom Billing and Revenue Management Market Estimates and Forecasts, By Solution (2020-2032) (USD Billion)
10.4.9.2 South Korea Telecom Billing and Revenue Management Market Estimates and Forecasts, By Deployment Type (2020-2032) (USD Billion)
10.4.9.3 South Korea Telecom Billing and Revenue Management Market Estimates and Forecasts, By Telecom Operator (2020-2032) (USD Billion)
10.4.10 Vietnam
10.4.10.1 Vietnam Telecom Billing and Revenue Management Market Estimates and Forecasts, By Solution (2020-2032) (USD Billion)
10.4.10.2 Vietnam Telecom Billing and Revenue Management Market Estimates and Forecasts, By Deployment Type (2020-2032) (USD Billion)
10.4.10.3 Vietnam Telecom Billing and Revenue Management Market Estimates and Forecasts, By Telecom Operator (2020-2032) (USD Billion)
10.4.11 Singapore
10.4.11.1 Singapore Telecom Billing and Revenue Management Market Estimates and Forecasts, By Solution (2020-2032) (USD Billion)
10.4.11.2 Singapore Telecom Billing and Revenue Management Market Estimates and Forecasts, By Deployment Type (2020-2032) (USD Billion)
10.4.11.3 Singapore Telecom Billing and Revenue Management Market Estimates and Forecasts, By Telecom Operator (2020-2032) (USD Billion)
10.4.12 Australia
10.4.12.1 Australia Telecom Billing and Revenue Management Market Estimates and Forecasts, By Solution (2020-2032) (USD Billion)
10.4.12.2 Australia Telecom Billing and Revenue Management Market Estimates and Forecasts, By Deployment Type (2020-2032) (USD Billion)
10.4.12.3 Australia Telecom Billing and Revenue Management Market Estimates and Forecasts, By Telecom Operator (2020-2032) (USD Billion)
10.4.13 Rest of Asia Pacific
10.4.13.1 Rest of Asia Pacific Telecom Billing and Revenue Management Market Estimates and Forecasts, By Solution (2020-2032) (USD Billion)
10.4.13.2 Rest of Asia Pacific Telecom Billing and Revenue Management Market Estimates and Forecasts, By Deployment Type (2020-2032) (USD Billion)
10.4.13.3 Rest of Asia Pacific Telecom Billing and Revenue Management Market Estimates and Forecasts, By Telecom Operator (2020-2032) (USD Billion)
10.5 Middle East and Africa
10.5.1 Middle East
10.5.1.1 Trends Analysis
10.5.1.2 Middle East Telecom Billing and Revenue Management Market Estimates and Forecasts, by Country (2020-2032) (USD Billion)
10.5.1.3 Middle East Telecom Billing and Revenue Management Market Estimates and Forecasts, By Solution (2020-2032) (USD Billion)
10.5.1.4 Middle East Telecom Billing and Revenue Management Market Estimates and Forecasts, By Deployment Type (2020-2032) (USD Billion)
10.5.1.5 Middle East Telecom Billing and Revenue Management Market Estimates and Forecasts, By Telecom Operator (2020-2032) (USD Billion)
10.5.1.6 UAE
10.5.1.6.1 UAE Telecom Billing and Revenue Management Market Estimates and Forecasts, By Solution (2020-2032) (USD Billion)
10.5.1.6.2 UAE Telecom Billing and Revenue Management Market Estimates and Forecasts, By Deployment Type (2020-2032) (USD Billion)
10.5.1.6.3 UAE Telecom Billing and Revenue Management Market Estimates and Forecasts, By Telecom Operator (2020-2032) (USD Billion)
10.5.1.7 Egypt
10.5.1.7.1 Egypt Telecom Billing and Revenue Management Market Estimates and Forecasts, By Solution (2020-2032) (USD Billion)
10.5.1.7.2 Egypt Telecom Billing and Revenue Management Market Estimates and Forecasts, By Deployment Type (2020-2032) (USD Billion)
10.5.1.7.3 Egypt Telecom Billing and Revenue Management Market Estimates and Forecasts, By Telecom Operator (2020-2032) (USD Billion)
10.5.1.8 Saudi Arabia
10.5.1.8.1 Saudi Arabia Telecom Billing and Revenue Management Market Estimates and Forecasts, By Solution (2020-2032) (USD Billion)
10.5.1.8.2 Saudi Arabia Telecom Billing and Revenue Management Market Estimates and Forecasts, By Deployment Type (2020-2032) (USD Billion)
10.5.1.8.3 Saudi Arabia Telecom Billing and Revenue Management Market Estimates and Forecasts, By Telecom Operator (2020-2032) (USD Billion)
10.5.1.9 Qatar
10.5.1.9.1 Qatar Telecom Billing and Revenue Management Market Estimates and Forecasts, By Solution (2020-2032) (USD Billion)
10.5.1.9.2 Qatar Telecom Billing and Revenue Management Market Estimates and Forecasts, By Deployment Type (2020-2032) (USD Billion)
10.5.1.9.3 Qatar Telecom Billing and Revenue Management Market Estimates and Forecasts, By Telecom Operator (2020-2032) (USD Billion)
10.5.1.10 Rest of Middle East
10.5.1.10.1 Rest of Middle East Telecom Billing and Revenue Management Market Estimates and Forecasts, By Solution (2020-2032) (USD Billion)
10.5.1.10.2 Rest of Middle East Telecom Billing and Revenue Management Market Estimates and Forecasts, By Deployment Type (2020-2032) (USD Billion)
10.5.1.10.3 Rest of Middle East Telecom Billing and Revenue Management Market Estimates and Forecasts, By Telecom Operator (2020-2032) (USD Billion)
10.5.2 Africa
10.5.2.1 Trends Analysis
10.5.2.2 Africa Telecom Billing and Revenue Management Market Estimates and Forecasts, by Country (2020-2032) (USD Billion)
10.5.2.3 Africa Telecom Billing and Revenue Management Market Estimates and Forecasts, By Solution (2020-2032) (USD Billion)
10.5.2.4 Africa Telecom Billing and Revenue Management Market Estimates and Forecasts, By Deployment Type (2020-2032) (USD Billion)
10.5.2.5 Africa Telecom Billing and Revenue Management Market Estimates and Forecasts, By Telecom Operator (2020-2032) (USD Billion)
10.5.2.6 South Africa
10.5.2.6.1 South Africa Telecom Billing and Revenue Management Market Estimates and Forecasts, By Solution (2020-2032) (USD Billion)
10.5.2.6.2 South Africa Telecom Billing and Revenue Management Market Estimates and Forecasts, By Deployment Type (2020-2032) (USD Billion)
10.5.2.6.3 South Africa Telecom Billing and Revenue Management Market Estimates and Forecasts, By Telecom Operator (2020-2032) (USD Billion)
10.5.2.7 Nigeria
10.5.2.7.1 Nigeria Telecom Billing and Revenue Management Market Estimates and Forecasts, By Solution (2020-2032) (USD Billion)
10.5.2.7.2 Nigeria Telecom Billing and Revenue Management Market Estimates and Forecasts, By Deployment Type (2020-2032) (USD Billion)
10.5.2.7.3 Nigeria Telecom Billing and Revenue Management Market Estimates and Forecasts, By Telecom Operator (2020-2032) (USD Billion)
10.5.2.8 Rest of Africa
10.5.2.8.1 Rest of Africa Telecom Billing and Revenue Management Market Estimates and Forecasts, By Solution (2020-2032) (USD Billion)
10.5.2.8.2 Rest of Africa Telecom Billing and Revenue Management Market Estimates and Forecasts, By Deployment Type (2020-2032) (USD Billion)
10.5.2.8.3 Rest of Africa Telecom Billing and Revenue Management Market Estimates and Forecasts, By Telecom Operator (2020-2032) (USD Billion)
10.6 Latin America
10.6.1 Trends Analysis
10.6.2 Latin America Telecom Billing and Revenue Management Market Estimates and Forecasts, by Country (2020-2032) (USD Billion)
10.6.3 Latin America Telecom Billing and Revenue Management Market Estimates and Forecasts, By Solution (2020-2032) (USD Billion)
10.6.4 Latin America Telecom Billing and Revenue Management Market Estimates and Forecasts, By Deployment Type (2020-2032) (USD Billion)
10.6.5 Latin America Telecom Billing and Revenue Management Market Estimates and Forecasts, By Telecom Operator (2020-2032) (USD Billion)
10.6.6 Brazil
10.6.6.1 Brazil Telecom Billing and Revenue Management Market Estimates and Forecasts, By Solution (2020-2032) (USD Billion)
10.6.6.2 Brazil Telecom Billing and Revenue Management Market Estimates and Forecasts, By Deployment Type (2020-2032) (USD Billion)
10.6.6.3 Brazil Telecom Billing and Revenue Management Market Estimates and Forecasts, By Telecom Operator (2020-2032) (USD Billion)
10.6.7 Argentina
10.6.7.1 Argentina Telecom Billing and Revenue Management Market Estimates and Forecasts, By Solution (2020-2032) (USD Billion)
10.6.7.2 Argentina Telecom Billing and Revenue Management Market Estimates and Forecasts, By Deployment Type (2020-2032) (USD Billion)
10.6.7.3 Argentina Telecom Billing and Revenue Management Market Estimates and Forecasts, By Telecom Operator (2020-2032) (USD Billion)
10.6.8 Colombia
10.6.8.1 Colombia Telecom Billing and Revenue Management Market Estimates and Forecasts, By Solution (2020-2032) (USD Billion)
10.6.8.2 Colombia Telecom Billing and Revenue Management Market Estimates and Forecasts, By Deployment Type (2020-2032) (USD Billion)
10.6.8.3 Colombia Telecom Billing and Revenue Management Market Estimates and Forecasts, By Telecom Operator (2020-2032) (USD Billion)
10.6.9 Rest of Latin America
10.6.9.1 Rest of Latin America Telecom Billing and Revenue Management Market Estimates and Forecasts, By Solution (2020-2032) (USD Billion)
10.6.9.2 Rest of Latin America Telecom Billing and Revenue Management Market Estimates and Forecasts, By Deployment Type (2020-2032) (USD Billion)
10.6.9.3 Rest of Latin America Telecom Billing and Revenue Management Market Estimates and Forecasts, By Telecom Operator (2020-2032) (USD Billion)
11. Company Profiles
11.1 Amdocs
11.1.1 Company Overview
11.1.2 Financial
11.1.3 Products/ Services Offered
11.1.4 SWOT Analysis
11.2 Ericsson
11.2.1 Company Overview
11.2.2 Financial
11.2.3 Products/ Services Offered
11.2.4 SWOT Analysis
11.3 Huawei
11.3.1 Company Overview
11.3.2 Financial
11.3.3 Products/ Services Offered
11.3.4 SWOT Analysis
11.4 Nokia
11.4.1 Company Overview
11.4.2 Financial
11.4.3 Products/ Services Offered
11.4.4 SWOT Analysis
11.5 CSPi
11.5.1 Company Overview
11.5.2 Financial
11.5.3 Products/ Services Offered
11.5.4 SWOT Analysis
11.6 Subex
11.6.1 Company Overview
11.6.2 Financial
11.6.3 Products/ Services Offered
11.6.4 SWOT Analysis
11.7 Comarch
11.7.1 Company Overview
11.7.2 Financial
11.7.3 Products/ Services Offered
11.7.4 SWOT Analysis
11.8 Tech Mahindra
11.8.1 Company Overview
11.8.2 Financial
11.8.3 Products/ Services Offered
11.8.4 SWOT Analysis
11.9 Tata Consultancy Services
11.9.1 Company Overview
11.9.2 Financial
11.9.3 Products/ Services Offered
11.9.4 SWOT Analysis
11.10 ZTE Corporation
11.10.1 Company Overview
11.10.2 Financial
11.10.3 Products/ Services Offered
11.10.4 SWOT Analysis
12. Use Cases and Best Practices
13. Conclusion
An accurate research report requires proper strategizing as well as implementation. There are multiple factors involved in the completion of good and accurate research report and selecting the best methodology to compete the research is the toughest part. Since the research reports we provide play a crucial role in any company’s decision-making process, therefore we at SNS Insider always believe that we should choose the best method which gives us results closer to reality. This allows us to reach at a stage wherein we can provide our clients best and accurate investment to output ratio.
Each report that we prepare takes a timeframe of 350-400 business hours for production. Starting from the selection of titles through a couple of in-depth brain storming session to the final QC process before uploading our titles on our website we dedicate around 350 working hours. The titles are selected based on their current market cap and the foreseen CAGR and growth.
The 5 steps process:
Step 1: Secondary Research:
Secondary Research or Desk Research is as the name suggests is a research process wherein, we collect data through the readily available information. In this process we use various paid and unpaid databases which our team has access to and gather data through the same. This includes examining of listed companies’ annual reports, Journals, SEC filling etc. Apart from this our team has access to various associations across the globe across different industries. Lastly, we have exchange relationships with various university as well as individual libraries.

Step 2: Primary Research
When we talk about primary research, it is a type of study in which the researchers collect relevant data samples directly, rather than relying on previously collected data. This type of research is focused on gaining content specific facts that can be sued to solve specific problems. Since the collected data is fresh and first hand therefore it makes the study more accurate and genuine.
We at SNS Insider have divided Primary Research into 2 parts.
Part 1 wherein we interview the KOLs of major players as well as the upcoming ones across various geographic regions. This allows us to have their view over the market scenario and acts as an important tool to come closer to the accurate market numbers. As many as 45 paid and unpaid primary interviews are taken from both the demand and supply side of the industry to make sure we land at an accurate judgement and analysis of the market.
This step involves the triangulation of data wherein our team analyses the interview transcripts, online survey responses and observation of on filed participants. The below mentioned chart should give a better understanding of the part 1 of the primary interview.

Part 2: In this part of primary research the data collected via secondary research and the part 1 of the primary research is validated with the interviews from individual consultants and subject matter experts.
Consultants are those set of people who have at least 12 years of experience and expertise within the industry whereas Subject Matter Experts are those with at least 15 years of experience behind their back within the same space. The data with the help of two main processes i.e., FGDs (Focused Group Discussions) and IDs (Individual Discussions). This gives us a 3rd party nonbiased primary view of the market scenario making it a more dependable one while collation of the data pointers.
Step 3: Data Bank Validation
Once all the information is collected via primary and secondary sources, we run that information for data validation. At our intelligence centre our research heads track a lot of information related to the market which includes the quarterly reports, the daily stock prices, and other relevant information. Our data bank server gets updated every fortnight and that is how the information which we collected using our primary and secondary information is revalidated in real time.

Step 4: QA/QC Process
After all the data collection and validation our team does a final level of quality check and quality assurance to get rid of any unwanted or undesired mistakes. This might include but not limited to getting rid of the any typos, duplication of numbers or missing of any important information. The people involved in this process include technical content writers, research heads and graphics people. Once this process is completed the title gets uploader on our platform for our clients to read it.
Step 5: Final QC/QA Process:
This is the last process and comes when the client has ordered the study. In this process a final QA/QC is done before the study is emailed to the client. Since we believe in giving our clients a good experience of our research studies, therefore, to make sure that we do not lack at our end in any way humanly possible we do a final round of quality check and then dispatch the study to the client.
Key Segments:
By Solution
By Deployment Type
By Telecom Operator
Request for Segment Customization as per your Business Requirement: Segment Customization Request
REGIONAL COVERAGE:
North America
Europe
Asia Pacific
Middle East & Africa
Latin America
Request for Country Level Research Report: Country Level Customization Request
Available Customization
With the given market data, SNS Insider offers customization as per the company’s specific needs. The following customization options are available for the report:
The IoT-based Asset Tracking and Monitoring Market was valued at USD 4.5 billion in 2023 and will reach USD 13.1 billion and CAGR of 12.69% by 2032.
The Cryptocurrency Market was valued at USD 5.08 billion in 2023 and will reach USD 15.39 Billion by 2032, growing at a CAGR of 13.13% by 2032.
The Engineering services outsourcing market size was valued at USD 2.3 Trillion in 2023. It is expected to hit USD 10.73 trillion by 2032 and grow at a CAGR of 18.7 % over the forecast period of 2024-2032.
Product Analytics Market was valued at USD 14.73 billion in 2023 and is expected to reach USD 84.33 billion by 2032, growing at a CAGR of 21.45% from 2024-2032.
The Cyber Insurance Market size was valued at USD 15.3 Billion in 2023. It is expected to grow to USD 97.3 Billion by 2032 and grow at a CAGR of 22.8% over the forecast period of 2024-2032.
The Architectural Services Market Size was valued at USD 374.45 Billion in 2023 and is expected to reach USD 709.52 Billion by 2032 and grow at a CAGR of 7.41% over the forecast period 2024-2032.

Hi! Click one of our member below to chat on Phone
© 2025 All Rights Reserved by SNS Insider Pvt Ltd


