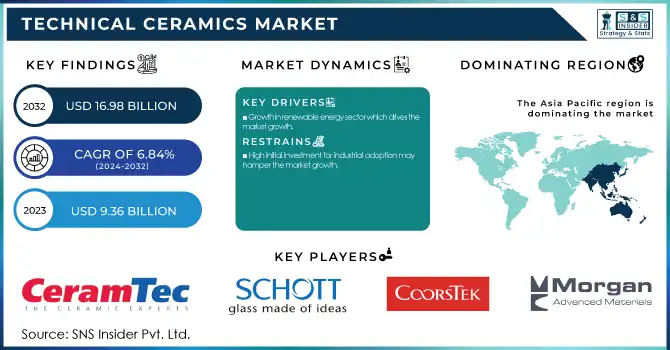
The Technical Ceramics Market size was USD 9.36 Billion in 2023 and is expected to reach USD 16.98 Billion by 2032 and grow at a CAGR of 6.84% over the forecast period of 2024-2032.
To get more information on Technical Ceramics Market - Request Free Sample Report
The report provides the defined statistical assessment alongside the complete technical ceramics advertise components market plan. They provide in-depth market sizing, demand-supply gap and pricing trends analysis through their reports. In addition, the firm delivers competitive analysis, market share data and company profiles, based on strategies implemented by market leaders to expand their market footprint. In addition, it provides supply chain analysis and impact of government regulations, to develop a clear picture of industry trends and strategic positioning. With its data-driven methodology, the firm helps businesses assess potential for expansion, project industry trends, and deploy ways to compete in an increasingly changing space.
Drivers
Growth in renewable energy sector which drives the market growth.
The renewable energy sector is another major factor contributing to the growth of the technical ceramics market, with significantly improving renewable energy efficiency and life. Technical ceramics like alumina, silicon carbide and aluminum nitride are used either alone or in combination in the manufacture of solar panels, wind turbines, hydrogen fuel cells, and battery storage systems, because these materials are extremely thermally stable, electrically insulative, and highly resistant to corrosion. Technical ceramics are used in solar energy applications to enhance the performance of photovoltaic cells and power conversion systems, leading to increased energy efficiency. In wind energy, ceramics can be used for turbine bearings and insulation systems where they resist temperatures and mechanical stress that would otherwise lead to costly maintenance, resulting in improved reliability. In addition, the rising utilization of hydrogen fuel cells, specifically within transportation and energy storage sectors, also multiply the demand for technical ceramics as these can also be used in solid oxide fuel cells, as well as, in electrolyzer cells for clean hydrogen generation. The global market is further driven by the investments made by Governments across the globe in renewable energy projects and clean energy infrastructure. The growing shift towards sustainable energy solutions across industries will provide significant opportunities for high strength technical ceramics, leading to innovation and growth in the market.
Restraint
High initial investment for industrial adoption may hamper the market growth.
Limitations in the technical ceramics market are the scale of initial capital investment required for industrial adoption of technical ceramics, as it involves the availability of advanced manufacturing technologies, precision machining, and specialized equipment for the production and integration of these materials. Compared to the metals and polymers, the technical ceramics are produced through complex processing steps, including several high-temperature sintering, advanced forming style and strict quality control, which lead to a higher production cost. An investment in bespoke machinery, R&D to optimize materials, and a skilled workforce training is needed for industries like automotive, aerospace, and electronics looking to incorporate technical ceramics in their components, thus raising the capital expenditures.
Opportunity
Growth in high-performance industrial equipment which create the opportunity in the market.
Increasing application of technical ceramics market for high-performance industrial equipment that requires survival in harsh environments creates an attractive technical ceramics market opportunity. Technical ceramics deliver excellent wear and corrosion resistance, coupled with high-temperature stability for demanding applications in industries like automotive, manufacturing, chemical processing, and heavy machinery. With industries always striving for better machinery performance and persistence, it leads to the necessity of components that are designed to work under extreme conditions, mainly cutting tool, industrial seals, bearings, and turbines. Technical ceramics such as silicon carbide, aluminium nitride, zirconate ceramics and others are essential in enhancing the life cycle and efficiency of such high-performance machinery. Manufacturers are adopting these advanced materials due to the continuous growth of industrial automation and the increasing demand for energy-efficient and sustainable machinery.
Challenges
High production complexity may create the challenge for the market.
One of the most serious challenges that the global technical ceramics market is facing is the higher production complexity associated with technical ceramics. Unlike other manufacturing processes, technical ceramics processing involves some specialized processes including high-temperature sintering, advanced machining, and precision forming, which are expensive in terms of time, labor, and high-end manufacturing equipment. While these processes provide the required properties to the ceramics in terms of strength, thermal stability, and electrical insulation, they also add to the overall cost of production, and the scalability of these processes becomes a challenge. Inevitably, even the tiniest changes in the production process can lead to defects due to the vast intricacies of production, thus leading to an increase in rejection rate, lower yield, etc.
By Raw Material
Alumina ceramics held the largest market share around 38% in 2023. The major share of alumina ceramics in the overall technical ceramics market is due to their superior characteristics which make them applicable in various industries. Alumina (aluminum oxide, Al₂O₃) has outstanding hardness, and wear and thermal resistance and it is also a good electrical insulator, which makes it suitable for challenging applications. Common applications involve electronic components, automotive parts, aerospace components and medical devices, which need high-temperature, corrosion-resistant electrical insulators. Additionally, alumina ceramics are cheaper than many other high-performance ceramics and, therefore, are still among the most commonly applied materials in industry, especially in semiconductor, energy, and machine manufacturing sectors. Alumina ceramics can be customized by purity and microstructure to broaden the options for manufacturers to achieve particular performance specifications.
By Product
Monolithic ceramics held the largest market share around 68% in 2023. Monolithic ceramics dominated the technical ceramics market considering their versatile nature, high strength, and applications in a variety of industries. In these ceramics, a single, homogeneous material which possesses excellent mechanical properties high hardness, fracture toughness and thermal stability is used. Due to their stability under extreme environments such as elevated temperatures, corrosive environments and excellent wear resistance, they are considered to be valuable materials for aerospace, automotive, industrial machinery and energy applications.
By End Use Industry
Automotive held the largest market share around 28% in 2023. It is owing to the need for high performance and stringent conditions faced by modern vehicles. Technical ceramics are also widely used in automotive applications by several industries as they offer tremendous heat resistance, wear resistance and electrical insulation that make them ideal for a range of automotive components. Alumina, silicon carbide and zirconia ceramics have been widely used in some critical machinery parts (e.g. engine components, sensor, brake system, and catalytic converter) where safety, efficiency and durability are prerequisite. Increased penetration of electric vehicles (EVs), which need advanced ceramics in battery, power electronics, and thermal management package systems also fuel this trend.
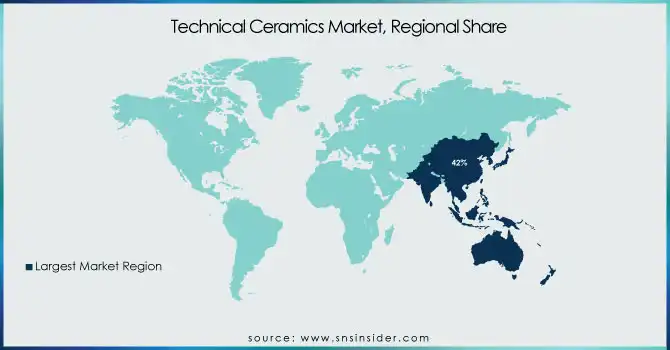
Asia Pacific held the largest market share around 42% in 2023. It is owing to significant presence across major consuming industries including electronics, automotive, aerospace, and energy, which makes vital use of technical ceramics. It is one of the fast-growing countries among China, Japan, South Korea, and India which drives QDA demand from the high-performance materials markets. Rapid industrialization in this region, along with investments in research and development (R&D) and advanced manufacturing technologies, has resulted in the deployment of technical ceramics in various sectors. For example, the substantial market growth in Asia-pacific is directly attributed to the regional dominance in the electronics and semiconductor industries, where the focused materials such as alumina ceramics and silicon carbide enjoy reaping benefits in several components such as insulators, capacitors, and substrates.
North America held the significant market share in market. It continuing initiatives focusing on improving energy efficiency and emission control in automotive and industrial areas are also accelerating the technical ceramics market growth. North American ceramic manufacturing infrastructure is particularly rich in innovations and sustainability in the development and manufacturing of advanced ceramic materials. In addition to this, initiatives and incentives from the government encouraging green technologies like renewable energy and electric vehicles provides a positive environment for the growth of the technical ceramics in the region, and is therefore fuelling the rapid growth of the market.
Get Customized Report as per Your Business Requirement - Enquiry Now
Key Players:
CeramTec GmbH – BIOLOX delta, Ceramaseal
Schott AG – ZERODUR, CERAN
CoorsTek, Inc. – CeraShield, CeraSurf-p
Morgan Advanced Materials plc – Haldenwanger, Diamonex
Carborundum Universal Limited (CUMI) – CUMI Electro Minerals, CUMI Industrial Ceramics
Kyocera Corporation – Fine Ceramics, Ceramic Knives
3M Company – Nextel™ Ceramic Fibers, 3M™ Silicon Nitride
Saint-Gobain Ceramics & Plastics, Inc. – Hexoloy, NorPro
NGK Insulators, Ltd. – Ceramic Substrates, NAS® Batteries
Corning Incorporated – Pyroceram, Corning Gorilla Glass
Murata Manufacturing Co., Ltd. – Multilayer Ceramic Capacitors (MLCCs), Ceramic Resonators
Rauschert GmbH – Technical Ceramics, Ceramic Filters
Superior Technical Ceramics Corp. – Ceramic Bearings, Ceramic Thermocouple Protection Tubes
McDanel Advanced Ceramic Technologies LLC – Alumina Tubes, Mullite Tubes
Ceradyne, Inc. (a 3M company) – Ceramic Armor Systems, Ceramic Orthodontic Brackets
H.C. Starck Ceramics GmbH – Silicon Carbide Components, Boron Carbide Components
Elan Technology – Technical Glass and Ceramics, Glass-Ceramic Seals
LSP Industrial Ceramics, Inc. – Ceramic Insulators, Ceramic Bushings
Advanced Ceramics Manufacturing – Ceramic Matrix Composites, Porous Ceramics
Blasch Precision Ceramics, Inc. – Ceramic Wear Liners, Ceramic Pump Components
Recent Development:
In 2024, CeramTec GmbH Expanded their range of ceramic hip joint components with advanced ceramic materials for enhanced wear resistance. This expansion helped the company to increase its production in the market.
In 2024, CoorsTek expanded its production capabilities for ceramic armor components, meeting increased demand from defense sectors.
In 2023, Schott AG developed a new glass-ceramic material for medical devices, improving biocompatibility and sterilization processes. This new product helped the company to increase its product portfolio in the market.
|
Report Attributes |
Details |
|---|---|
|
Market Size in 2023 |
USD 9.36 Billion |
|
Market Size by 2032 |
USD 16.98 Billion |
|
CAGR |
CAGR of 6.84% From 2024 to 2032 |
|
Base Year |
2023 |
|
Forecast Period |
2024-2032 |
|
Historical Data |
2020-2022 |
|
Report Scope & Coverage |
Market Size, Segments Analysis, Competitive Landscape, Regional Analysis, DROC & SWOT Analysis, Forecast Outlook |
|
Key Segments |
• By Raw Material (Alumina Ceramics, Titanate Ceramics, Zirconate Ceramics, Ferrite Ceramics, Aluminium Nitride, Silicon Carbide, Silicon Nitride) |
|
Regional Analysis/Coverage |
North America (US, Canada, Mexico), Europe (Eastern Europe [Poland, Romania, Hungary, Turkey, Rest of Eastern Europe] Western Europe] Germany, France, UK, Italy, Spain, Netherlands, Switzerland, Austria, Rest of Western Europe]), Asia Pacific (China, India, Japan, South Korea, Vietnam, Singapore, Australia, Rest of Asia Pacific), Middle East & Africa (Middle East [UAE, Egypt, Saudi Arabia, Qatar, Rest of Middle East], Africa [Nigeria, South Africa, Rest of Africa], Latin America (Brazil, Argentina, Colombia, Rest of Latin America) |
|
Company Profiles |
|
Ans: The Technical Ceramics Market was valued at USD 9.36 Billion in 2023.
Ans: The expected CAGR of the global Technical Ceramics Market during the forecast period is 6.84%.
Ans: The Automotive will grow rapidly in the Technical Ceramics Market from 2024-2032.
Ans: Growth in renewable energy sector which drives the market growth.
Ans: Asia Pacific led the Technical Ceramics Market in the region with the highest revenue share in 2023.
Table Of Contents:
1. Introduction
1.1 Market Definition
1.2 Scope (Inclusion and Exclusions)
1.3 Research Assumptions
2. Executive Summary
2.1 Market Overview
2.2 Regional Synopsis
2.3 Competitive Summary
3. Research Methodology
3.1 Top-Down Approach
3.2 Bottom-up Approach
3.3. Data Validation
3.4 Primary Interviews
4. Market Dynamics Impact Analysis
4.1 Market Driving Factors Analysis
4.1.1 Drivers
4.1.2 Restraints
4.1.3 Opportunities
4.1.4 Challenges
4.2 PESTLE Analysis
4.3 Porter’s Five Forces Model
5. Statistical Insights and Trends Reporting
5.1 By Production Capacity and Utilization, by Country, By Type, 2023
5.2 Feedstock Prices, by Country, By Type, 2023
5.3 Regulatory Impact, by l Country, By Type, 2023.
5.4 Environmental Metrics: Emissions Data, Waste Management Practices, and Sustainability Initiatives, by Region
5.5 Innovation and R&D, Type, 2023
6. Competitive Landscape
6.1 List of Major Companies, By Region
6.2 Market Share Analysis, By Region
6.3 Product Benchmarking
6.3.1 Product specifications and features
6.3.2 Pricing
6.4 Strategic Initiatives
6.4.1 Marketing and promotional activities
6.4.2 Distribution and Supply Chain Strategies
6.4.3 Expansion plans and new Product launches
6.4.4 Strategic partnerships and collaborations
6.5 Technological Advancements
6.6 Market Positioning and Branding
7. Technical Ceramics Market Segmentation, by Raw Material
7.1 Chapter Overview
7.2 Alumina Ceramics
7.2.1 Alumina Ceramics Market Trends Analysis (2020-2032)
7.2.2 Alumina Ceramics Market Size Estimates and Forecasts to 2032 (USD Billion)
7.3 Titanate Ceramics
7.3.1 Titanate Ceramics Market Trends Analysis (2020-2032)
7.3.2 Titanate Ceramics Market Size Estimates and Forecasts to 2032 (USD Billion)
7.4 Zirconate Ceramics
7.4.1 Zirconate Ceramics Market Trends Analysis (2020-2032)
7.4.2 Zirconate Ceramics Market Size Estimates and Forecasts to 2032 (USD Billion)
7.5 Ferrite Ceramics
7.5.1 Ferrite Ceramics Market Trends Analysis (2020-2032)
7.5.2 Ferrite Ceramics Market Size Estimates and Forecasts to 2032 (USD Billion)
7.6 Aluminium Nitride
7.6.1 Aluminium Nitride Market Trends Analysis (2020-2032)
7.6.2 Aluminium Nitride Market Size Estimates and Forecasts to 2032 (USD Billion)
7.7 Silicon Carbide
7.7.1 Silicon Carbide Market Trends Analysis (2020-2032)
7.7.2 Silicon Carbide Market Size Estimates and Forecasts to 2032 (USD Billion)
7.8 Silicon Nitride
7.8.1 Silicon Nitride Market Trends Analysis (2020-2032)
7.8.2 Silicon Nitride Market Size Estimates and Forecasts to 2032 (USD Billion)
8. Technical Ceramics Market Segmentation, by Product
8.1 Chapter Overview
8.2 Monolithic ceramics
8.2.1 Monolithic Ceramics Market Trends Analysis (2020-2032)
8.2.2 Monolithic Ceramics Market Size Estimates and Forecasts to 2032 (USD Billion)
8.3 Ceramic coatings
8.3.1 Ceramic Coatings Market Trends Analysis (2020-2032)
8.3.2 Ceramic Coatings Market Size Estimates and Forecasts to 2032 (USD Billion)
8.4 Ceramic matrix composites
8.4.1 Ceramic matrix composites Market Trends Analysis (2020-2032)
8.4.2 Ceramic matrix composites Market Size Estimates and Forecasts to 2032 (USD Billion)
9. Technical Ceramics Market Segmentation, by End-Use Industry
9.1 Chapter Overview
9.2 Automotive
9.2.1 Automotive Market Trends Analysis (2020-2032)
9.2.2 Automotive Market Size Estimates and Forecasts to 2032 (USD Billion)
9.3 Industrial
9.3.1 Industrial Market Trends Analysis (2020-2032)
9.3.2 Industrial Market Size Estimates and Forecasts to 2032 (USD Billion)
9.4 Medical
9.4.1 Medical Market Trends Analysis (2020-2032)
9.4.2 Medical Market Size Estimates and Forecasts to 2032 (USD Billion)
9.5 Military & Defense
9.5.1 Military & Defense Market Trends Analysis (2020-2032)
9.5.2 Military & Defense Market Size Estimates and Forecasts to 2032 (USD Billion)
9.6 Energy & Power
9.6.1 Energy & Power Market Trends Analysis (2020-2032)
9.6.2 Energy & Power Market Size Estimates and Forecasts to 2032 (USD Billion)
9.7 Others
9.7.1 Others Market Trends Analysis (2020-2032)
9.7.2 Others Market Size Estimates and Forecasts to 2032 (USD Billion)
10. Regional Analysis
10.1 Chapter Overview
10.2 North America
10.2.1 Trends Analysis
10.2.2 North America Technical Ceramics Market Estimates and Forecasts, by Country (2020-2032) (USD Billion)
10.2.3 North America Technical Ceramics Market Estimates and Forecasts, by Raw Material (2020-2032) (USD Billion)
10.2.4 North America Technical Ceramics Market Estimates and Forecasts, by Product (2020-2032) (USD Billion)
10.2.5 North America Technical Ceramics Market Estimates and Forecasts, by End-Use Industry (2020-2032) (USD Billion)
10.2.6 USA
10.2.6.1 USA Technical Ceramics Market Estimates and Forecasts, by Raw Material (2020-2032) (USD Billion)
10.2.6.2 USA Technical Ceramics Market Estimates and Forecasts, by Product (2020-2032) (USD Billion)
10.2.6.3 USA Technical Ceramics Market Estimates and Forecasts, by End-Use Industry (2020-2032) (USD Billion)
10.2.7 Canada
10.2.7.1 Canada Technical Ceramics Market Estimates and Forecasts, by Raw Material (2020-2032) (USD Billion)
10.2.7.2 Canada Technical Ceramics Market Estimates and Forecasts, by Product (2020-2032) (USD Billion)
10.2.7.3 Canada Technical Ceramics Market Estimates and Forecasts, by End-Use Industry (2020-2032) (USD Billion)
10.2.8 Mexico
10.2.8.1 Mexico Technical Ceramics Market Estimates and Forecasts, by Raw Material (2020-2032) (USD Billion)
10.2.8.2 Mexico Technical Ceramics Market Estimates and Forecasts, by Product (2020-2032) (USD Billion)
10.2.8.3 Mexico Technical Ceramics Market Estimates and Forecasts, by End-Use Industry (2020-2032) (USD Billion)
10.3 Europe
10.3.1 Eastern Europe
10.3.1.1 Trends Analysis
10.3.1.2 Eastern Europe Technical Ceramics Market Estimates and Forecasts, by Country (2020-2032) (USD Billion)
10.3.1.3 Eastern Europe Technical Ceramics Market Estimates and Forecasts, by Raw Material (2020-2032) (USD Billion)
10.3.1.4 Eastern Europe Technical Ceramics Market Estimates and Forecasts, by Product (2020-2032) (USD Billion)
10.3.1.5 Eastern Europe Technical Ceramics Market Estimates and Forecasts, by End-Use Industry (2020-2032) (USD Billion)
10.3.1.6 Poland
10.3.1.6.1 Poland Technical Ceramics Market Estimates and Forecasts, by Raw Material (2020-2032) (USD Billion)
10.3.1.6.2 Poland Technical Ceramics Market Estimates and Forecasts, by Product (2020-2032) (USD Billion)
10.3.1.6.3 Poland Technical Ceramics Market Estimates and Forecasts, by End-Use Industry (2020-2032) (USD Billion)
10.3.1.7 Romania
10.3.1.7.1 Romania Technical Ceramics Market Estimates and Forecasts, by Raw Material (2020-2032) (USD Billion)
10.3.1.7.2 Romania Technical Ceramics Market Estimates and Forecasts, by Product (2020-2032) (USD Billion)
10.3.1.7.3 Romania Technical Ceramics Market Estimates and Forecasts, by End-Use Industry (2020-2032) (USD Billion)
10.3.1.8 Hungary
10.3.1.8.1 Hungary Technical Ceramics Market Estimates and Forecasts, by Raw Material (2020-2032) (USD Billion)
10.3.1.8.2 Hungary Technical Ceramics Market Estimates and Forecasts, by Product (2020-2032) (USD Billion)
10.3.1.8.3 Hungary Technical Ceramics Market Estimates and Forecasts, by End-Use Industry (2020-2032) (USD Billion)
10.3.1.9 Turkey
10.3.1.9.1 Turkey Technical Ceramics Market Estimates and Forecasts, by Raw Material (2020-2032) (USD Billion)
10.3.1.9.2 Turkey Technical Ceramics Market Estimates and Forecasts, by Product (2020-2032) (USD Billion)
10.3.1.9.3 Turkey Technical Ceramics Market Estimates and Forecasts, by End-Use Industry (2020-2032) (USD Billion)
10.3.1.10 Rest of Eastern Europe
10.3.1.10.1 Rest of Eastern Europe Technical Ceramics Market Estimates and Forecasts, by Raw Material (2020-2032) (USD Billion)
10.3.1.10.2 Rest of Eastern Europe Technical Ceramics Market Estimates and Forecasts, by Product (2020-2032) (USD Billion)
10.3.1.10.3 Rest of Eastern Europe Technical Ceramics Market Estimates and Forecasts, by End-Use Industry (2020-2032) (USD Billion)
10.3.2 Western Europe
10.3.2.1 Trends Analysis
10.3.2.2 Western Europe Technical Ceramics Market Estimates and Forecasts, by Country (2020-2032) (USD Billion)
10.3.2.3 Western Europe Technical Ceramics Market Estimates and Forecasts, by Raw Material (2020-2032) (USD Billion)
10.3.2.4 Western Europe Technical Ceramics Market Estimates and Forecasts, by Product (2020-2032) (USD Billion)
10.3.2.5 Western Europe Technical Ceramics Market Estimates and Forecasts, by End-Use Industry (2020-2032) (USD Billion)
10.3.2.6 Germany
10.3.2.6.1 Germany Technical Ceramics Market Estimates and Forecasts, by Raw Material (2020-2032) (USD Billion)
10.3.2.6.2 Germany Technical Ceramics Market Estimates and Forecasts, by Product (2020-2032) (USD Billion)
10.3.2.6.3 Germany Technical Ceramics Market Estimates and Forecasts, by End-Use Industry (2020-2032) (USD Billion)
10.3.2.7 France
10.3.2.7.1 France Technical Ceramics Market Estimates and Forecasts, by Raw Material (2020-2032) (USD Billion)
10.3.2.7.2 France Technical Ceramics Market Estimates and Forecasts, by Product (2020-2032) (USD Billion)
10.3.2.7.3 France Technical Ceramics Market Estimates and Forecasts, by End-Use Industry (2020-2032) (USD Billion)
10.3.2.8 UK
10.3.2.8.1 UK Technical Ceramics Market Estimates and Forecasts, by Raw Material (2020-2032) (USD Billion)
10.3.2.8.2 UK Technical Ceramics Market Estimates and Forecasts, by Product (2020-2032) (USD Billion)
10.3.2.8.3 UK Technical Ceramics Market Estimates and Forecasts, by End-Use Industry (2020-2032) (USD Billion)
10.3.2.9 Italy
10.3.2.9.1 Italy Technical Ceramics Market Estimates and Forecasts, by Raw Material (2020-2032) (USD Billion)
10.3.2.9.2 Italy Technical Ceramics Market Estimates and Forecasts, by Product (2020-2032) (USD Billion)
10.3.2.9.3 Italy Technical Ceramics Market Estimates and Forecasts, by End-Use Industry (2020-2032) (USD Billion)
10.3.2.10 Spain
10.3.2.10.1 Spain Technical Ceramics Market Estimates and Forecasts, by Raw Material (2020-2032) (USD Billion)
10.3.2.10.2 Spain Technical Ceramics Market Estimates and Forecasts, by Product (2020-2032) (USD Billion)
10.3.2.10.3 Spain Technical Ceramics Market Estimates and Forecasts, by End-Use Industry (2020-2032) (USD Billion)
10.3.2.11 Netherlands
10.3.2.11.1 Netherlands Technical Ceramics Market Estimates and Forecasts, by Raw Material (2020-2032) (USD Billion)
10.3.2.11.2 Netherlands Technical Ceramics Market Estimates and Forecasts, by Product (2020-2032) (USD Billion)
10.3.2.11.3 Netherlands Technical Ceramics Market Estimates and Forecasts, by End-Use Industry (2020-2032) (USD Billion)
10.3.2.12 Switzerland
10.3.2.12.1 Switzerland Technical Ceramics Market Estimates and Forecasts, by Raw Material (2020-2032) (USD Billion)
10.3.2.12.2 Switzerland Technical Ceramics Market Estimates and Forecasts, by Product (2020-2032) (USD Billion)
10.3.2.12.3 Switzerland Technical Ceramics Market Estimates and Forecasts, by End-Use Industry (2020-2032) (USD Billion)
10.3.2.13 Austria
10.3.2.13.1 Austria Technical Ceramics Market Estimates and Forecasts, by Raw Material (2020-2032) (USD Billion)
10.3.2.13.2 Austria Technical Ceramics Market Estimates and Forecasts, by Product (2020-2032) (USD Billion)
10.3.2.13.3 Austria Technical Ceramics Market Estimates and Forecasts, by End-Use Industry (2020-2032) (USD Billion)
10.3.2.14 Rest of Western Europe
10.3.2.14.1 Rest of Western Europe Technical Ceramics Market Estimates and Forecasts, by Raw Material (2020-2032) (USD Billion)
10.3.2.14.2 Rest of Western Europe Technical Ceramics Market Estimates and Forecasts, by Product (2020-2032) (USD Billion)
10.3.2.14.3 Rest of Western Europe Technical Ceramics Market Estimates and Forecasts, by End-Use Industry (2020-2032) (USD Billion)
10.4 Asia Pacific
10.4.1 Trends Analysis
10.4.2 Asia Pacific Technical Ceramics Market Estimates and Forecasts, by Country (2020-2032) (USD Billion)
10.4.3 Asia Pacific Technical Ceramics Market Estimates and Forecasts, by Raw Material (2020-2032) (USD Billion)
10.4.4 Asia Pacific Technical Ceramics Market Estimates and Forecasts, by Product (2020-2032) (USD Billion)
10.4.5 Asia Pacific Technical Ceramics Market Estimates and Forecasts, by End-Use Industry (2020-2032) (USD Billion)
10.4.6 China
10.4.6.1 China Technical Ceramics Market Estimates and Forecasts, by Raw Material (2020-2032) (USD Billion)
10.4.6.2 China Technical Ceramics Market Estimates and Forecasts, by Product (2020-2032) (USD Billion)
10.4.6.3 China Technical Ceramics Market Estimates and Forecasts, by End-Use Industry (2020-2032) (USD Billion)
10.4.7 India
10.4.7.1 India Technical Ceramics Market Estimates and Forecasts, by Raw Material (2020-2032) (USD Billion)
10.4.7.2 India Technical Ceramics Market Estimates and Forecasts, by Product (2020-2032) (USD Billion)
10.4.7.3 India Technical Ceramics Market Estimates and Forecasts, by End-Use Industry (2020-2032) (USD Billion)
10.4.8 Japan
10.4.8.1 Japan Technical Ceramics Market Estimates and Forecasts, by Raw Material (2020-2032) (USD Billion)
10.4.8.2 Japan Technical Ceramics Market Estimates and Forecasts, by Product (2020-2032) (USD Billion)
10.4.8.3 Japan Technical Ceramics Market Estimates and Forecasts, by End-Use Industry (2020-2032) (USD Billion)
10.4.9 South Korea
10.4.9.1 South Korea Technical Ceramics Market Estimates and Forecasts, by Raw Material (2020-2032) (USD Billion)
10.4.9.2 South Korea Technical Ceramics Market Estimates and Forecasts, by Product (2020-2032) (USD Billion)
10.4.9.3 South Korea Technical Ceramics Market Estimates and Forecasts, by End-Use Industry (2020-2032) (USD Billion)
10.4.10 Vietnam
10.4.10.1 Vietnam Technical Ceramics Market Estimates and Forecasts, by Raw Material (2020-2032) (USD Billion)
10.4.10.2 Vietnam Technical Ceramics Market Estimates and Forecasts, by Product (2020-2032) (USD Billion)
10.4.10.3 Vietnam Technical Ceramics Market Estimates and Forecasts, by End-Use Industry (2020-2032) (USD Billion)
10.4.11 Singapore
10.4.11.1 Singapore Technical Ceramics Market Estimates and Forecasts, by Raw Material (2020-2032) (USD Billion)
10.4.11.2 Singapore Technical Ceramics Market Estimates and Forecasts, by Product (2020-2032) (USD Billion)
10.4.11.3 Singapore Technical Ceramics Market Estimates and Forecasts, by End-Use Industry (2020-2032) (USD Billion)
10.4.12 Australia
10.4.12.1 Australia Technical Ceramics Market Estimates and Forecasts, by Raw Material (2020-2032) (USD Billion)
10.4.12.2 Australia Technical Ceramics Market Estimates and Forecasts, by Product (2020-2032) (USD Billion)
10.4.12.3 Australia Technical Ceramics Market Estimates and Forecasts, by End-Use Industry (2020-2032) (USD Billion)
10.4.13 Rest of Asia Pacific
10.4.13.1 Rest of Asia Pacific Technical Ceramics Market Estimates and Forecasts, by Raw Material (2020-2032) (USD Billion)
10.4.13.2 Rest of Asia Pacific Technical Ceramics Market Estimates and Forecasts, by Product (2020-2032) (USD Billion)
10.4.13.3 Rest of Asia Pacific Technical Ceramics Market Estimates and Forecasts, by End-Use Industry (2020-2032) (USD Billion)
10.5 Middle East and Africa
10.5.1 Middle East
10.5.1.1 Trends Analysis
10.5.1.2 Middle East Technical Ceramics Market Estimates and Forecasts, by Country (2020-2032) (USD Billion)
10.5.1.3 Middle East Technical Ceramics Market Estimates and Forecasts, by Raw Material (2020-2032) (USD Billion)
10.5.1.4 Middle East Technical Ceramics Market Estimates and Forecasts, by Product (2020-2032) (USD Billion)
10.5.1.5 Middle East Technical Ceramics Market Estimates and Forecasts, by End-Use Industry (2020-2032) (USD Billion)
10.5.1.6 UAE
10.5.1.6.1 UAE Technical Ceramics Market Estimates and Forecasts, by Raw Material (2020-2032) (USD Billion)
10.5.1.6.2 UAE Technical Ceramics Market Estimates and Forecasts, by Product (2020-2032) (USD Billion)
10.5.1.6.3 UAE Technical Ceramics Market Estimates and Forecasts, by End-Use Industry (2020-2032) (USD Billion)
10.5.1.7 Egypt
10.5.1.7.1 Egypt Technical Ceramics Market Estimates and Forecasts, by Raw Material (2020-2032) (USD Billion)
10.5.1.7.2 Egypt Technical Ceramics Market Estimates and Forecasts, by Product (2020-2032) (USD Billion)
10.5.1.7.3 Egypt Technical Ceramics Market Estimates and Forecasts, by End-Use Industry (2020-2032) (USD Billion)
10.5.1.8 Saudi Arabia
10.5.1.8.1 Saudi Arabia Technical Ceramics Market Estimates and Forecasts, by Raw Material (2020-2032) (USD Billion)
10.5.1.8.2 Saudi Arabia Technical Ceramics Market Estimates and Forecasts, by Product (2020-2032) (USD Billion)
10.5.1.8.3 Saudi Arabia Technical Ceramics Market Estimates and Forecasts, by End-Use Industry (2020-2032) (USD Billion)
10.5.1.9 Qatar
10.5.1.9.1 Qatar Technical Ceramics Market Estimates and Forecasts, by Raw Material (2020-2032) (USD Billion)
10.5.1.9.2 Qatar Technical Ceramics Market Estimates and Forecasts, by Product (2020-2032) (USD Billion)
10.5.1.9.3 Qatar Technical Ceramics Market Estimates and Forecasts, by End-Use Industry (2020-2032) (USD Billion)
10.5.1.10 Rest of Middle East
10.5.1.10.1 Rest of Middle East Technical Ceramics Market Estimates and Forecasts, by Raw Material (2020-2032) (USD Billion)
10.5.1.10.2 Rest of Middle East Technical Ceramics Market Estimates and Forecasts, by Product (2020-2032) (USD Billion)
10.5.1.10.3 Rest of Middle East Technical Ceramics Market Estimates and Forecasts, by End-Use Industry (2020-2032) (USD Billion)
10.5.2 Africa
10.5.2.1 Trends Analysis
10.5.2.2 Africa Technical Ceramics Market Estimates and Forecasts, by Country (2020-2032) (USD Billion)
10.5.2.3 Africa Technical Ceramics Market Estimates and Forecasts, by Raw Material (2020-2032) (USD Billion)
10.5.2.4 Africa Technical Ceramics Market Estimates and Forecasts, by Product (2020-2032) (USD Billion)
10.5.2.5 Africa Technical Ceramics Market Estimates and Forecasts, by End-Use Industry (2020-2032) (USD Billion)
10.5.2.6 South Africa
10.5.2.6.1 South Africa Technical Ceramics Market Estimates and Forecasts, by Raw Material (2020-2032) (USD Billion)
10.5.2.6.2 South Africa Technical Ceramics Market Estimates and Forecasts, by Product (2020-2032) (USD Billion)
10.5.2.6.3 South Africa Technical Ceramics Market Estimates and Forecasts, by End-Use Industry (2020-2032) (USD Billion)
10.5.2.7 Nigeria
10.5.2.7.1 Nigeria Technical Ceramics Market Estimates and Forecasts, by Raw Material (2020-2032) (USD Billion)
10.5.2.7.2 Nigeria Technical Ceramics Market Estimates and Forecasts, by Product (2020-2032) (USD Billion)
10.5.2.7.3 Nigeria Technical Ceramics Market Estimates and Forecasts, by End-Use Industry (2020-2032) (USD Billion)
10.5.2.8 Rest of Africa
10.5.2.8.1 Rest of Africa Technical Ceramics Market Estimates and Forecasts, by Raw Material (2020-2032) (USD Billion)
10.5.2.8.2 Rest of Africa Technical Ceramics Market Estimates and Forecasts, by Product (2020-2032) (USD Billion)
10.5.2.8.3 Rest of Africa Technical Ceramics Market Estimates and Forecasts, by End-Use Industry (2020-2032) (USD Billion)
10.6 Latin America
10.6.1 Trends Analysis
10.6.2 Latin America Technical Ceramics Market Estimates and Forecasts, by Country (2020-2032) (USD Billion)
10.6.3 Latin America Technical Ceramics Market Estimates and Forecasts, by Raw Material (2020-2032) (USD Billion)
10.6.4 Latin America Technical Ceramics Market Estimates and Forecasts, by Product (2020-2032) (USD Billion)
10.6.5 Latin America Technical Ceramics Market Estimates and Forecasts, by End-Use Industry (2020-2032) (USD Billion)
10.6.6 Brazil
10.6.6.1 Brazil Technical Ceramics Market Estimates and Forecasts, by Raw Material (2020-2032) (USD Billion)
10.6.6.2 Brazil Technical Ceramics Market Estimates and Forecasts, by Product (2020-2032) (USD Billion)
10.6.6.3 Brazil Technical Ceramics Market Estimates and Forecasts, by End-Use Industry (2020-2032) (USD Billion)
10.6.7 Argentina
10.6.7.1 Argentina Technical Ceramics Market Estimates and Forecasts, by Raw Material (2020-2032) (USD Billion)
10.6.7.2 Argentina Technical Ceramics Market Estimates and Forecasts, by Product (2020-2032) (USD Billion)
10.6.7.3 Argentina Technical Ceramics Market Estimates and Forecasts, by End-Use Industry (2020-2032) (USD Billion)
10.6.8 Colombia
10.6.8.1 Colombia Technical Ceramics Market Estimates and Forecasts, by Raw Material (2020-2032) (USD Billion)
10.6.8.2 Colombia Technical Ceramics Market Estimates and Forecasts, by Product (2020-2032) (USD Billion)
10.6.8.3 Colombia Technical Ceramics Market Estimates and Forecasts, by End-Use Industry (2020-2032) (USD Billion)
10.6.9 Rest of Latin America
10.6.9.1 Rest of Latin America Technical Ceramics Market Estimates and Forecasts, by Raw Material (2020-2032) (USD Billion)
10.6.9.2 Rest of Latin America Technical Ceramics Market Estimates and Forecasts, by Product (2020-2032) (USD Billion)
10.6.9.3 Rest of Latin America Technical Ceramics Market Estimates and Forecasts, by End-Use Industry (2020-2032) (USD Billion)
11. Company Profiles
11.1 CeramTec GmbH
11.1.1 Company Overview
11.1.2 Financial
11.1.3 Product/ Services Offered
11.1.4 SWOT Analysis
11.2 Schott AG
11.2.1 Company Overview
11.2.2 Financial
11.2.3 Product/ Services Offered
11.2.4 SWOT Analysis
11.3 CoorsTek, Inc.
11.3.1 Company Overview
11.3.2 Financial
11.3.3 Product/ Services Offered
11.3.4 SWOT Analysis
11.4 Morgan Advanced Materials plc
11.4.1 Company Overview
11.4.2 Financial
11.4.3 Product/ Services Offered
11.4.4 SWOT Analysis
11.5 Carborundum Universal Limited (CUMI)
11.5.1 Company Overview
11.5.2 Financial
11.5.3 Product/ Services Offered
11.5.4 SWOT Analysis
11.6 Kyocera Corporation
11.6.1 Company Overview
11.6.2 Financial
11.6.3 Product/ Services Offered
11.6.4 SWOT Analysis
11.7 3M Company
11.7.1 Company Overview
11.7.2 Financial
11.7.3 Product/ Services Offered
11.7.4 SWOT Analysis
11.8 Saint-Gobain Ceramics & Plastics, Inc.
11.8.1 Company Overview
11.8.2 Financial
11.8.3 Product/ Services Offered
11.8.4 SWOT Analysis
11.9 NGK Insulators, Ltd.
11.9.1 Company Overview
11.9.2 Financial
11.9.3 Product/ Services Offered
11.9.4 SWOT Analysis
11.10 Corning Incorporated
11.10.1 Company Overview
11.10.2 Financial
11.10.3 Product/ Services Offered
11.10.4 SWOT Analysis
12. Use Cases and Best Practices
13. Conclusion
An accurate research report requires proper strategizing as well as implementation. There are multiple factors involved in the completion of good and accurate research report and selecting the best methodology to compete the research is the toughest part. Since the research reports we provide play a crucial role in any company’s decision-making process, therefore we at SNS Insider always believe that we should choose the best method which gives us results closer to reality. This allows us to reach at a stage wherein we can provide our clients best and accurate investment to output ratio.
Each report that we prepare takes a timeframe of 350-400 business hours for production. Starting from the selection of titles through a couple of in-depth brain storming session to the final QC process before uploading our titles on our website we dedicate around 350 working hours. The titles are selected based on their current market cap and the foreseen CAGR and growth.
The 5 steps process:
Step 1: Secondary Research:
Secondary Research or Desk Research is as the name suggests is a research process wherein, we collect data through the readily available information. In this process we use various paid and unpaid databases which our team has access to and gather data through the same. This includes examining of listed companies’ annual reports, Journals, SEC filling etc. Apart from this our team has access to various associations across the globe across different industries. Lastly, we have exchange relationships with various university as well as individual libraries.

Step 2: Primary Research
When we talk about primary research, it is a type of study in which the researchers collect relevant data samples directly, rather than relying on previously collected data. This type of research is focused on gaining content specific facts that can be sued to solve specific problems. Since the collected data is fresh and first hand therefore it makes the study more accurate and genuine.
We at SNS Insider have divided Primary Research into 2 parts.
Part 1 wherein we interview the KOLs of major players as well as the upcoming ones across various geographic regions. This allows us to have their view over the market scenario and acts as an important tool to come closer to the accurate market numbers. As many as 45 paid and unpaid primary interviews are taken from both the demand and supply side of the industry to make sure we land at an accurate judgement and analysis of the market.
This step involves the triangulation of data wherein our team analyses the interview transcripts, online survey responses and observation of on filed participants. The below mentioned chart should give a better understanding of the part 1 of the primary interview.

Part 2: In this part of primary research the data collected via secondary research and the part 1 of the primary research is validated with the interviews from individual consultants and subject matter experts.
Consultants are those set of people who have at least 12 years of experience and expertise within the industry whereas Subject Matter Experts are those with at least 15 years of experience behind their back within the same space. The data with the help of two main processes i.e., FGDs (Focused Group Discussions) and IDs (Individual Discussions). This gives us a 3rd party nonbiased primary view of the market scenario making it a more dependable one while collation of the data pointers.
Step 3: Data Bank Validation
Once all the information is collected via primary and secondary sources, we run that information for data validation. At our intelligence centre our research heads track a lot of information related to the market which includes the quarterly reports, the daily stock prices, and other relevant information. Our data bank server gets updated every fortnight and that is how the information which we collected using our primary and secondary information is revalidated in real time.

Step 4: QA/QC Process
After all the data collection and validation our team does a final level of quality check and quality assurance to get rid of any unwanted or undesired mistakes. This might include but not limited to getting rid of the any typos, duplication of numbers or missing of any important information. The people involved in this process include technical content writers, research heads and graphics people. Once this process is completed the title gets uploader on our platform for our clients to read it.
Step 5: Final QC/QA Process:
This is the last process and comes when the client has ordered the study. In this process a final QA/QC is done before the study is emailed to the client. Since we believe in giving our clients a good experience of our research studies, therefore, to make sure that we do not lack at our end in any way humanly possible we do a final round of quality check and then dispatch the study to the client.
Key Segments:
By Raw Material
Alumina Ceramics
Titanate Ceramics
Zirconate Ceramics
Ferrite Ceramics
Aluminium Nitride
Silicon Carbide
Silicon Nitride
By Product
Monolithic ceramics
Ceramic coatings
Ceramic matrix composites
By End Use Industry
Automotive
Industrial
Medical
Military & Defense
Energy & Power
Others
Request for Segment Customization as per your Business Requirement: Segment Customization Request
Regional Coverage:
North America
US
Canada
Mexico
Europe
Eastern Europe
Poland
Romania
Hungary
Turkey
Rest of Eastern Europe
Western Europe
Germany
France
UK
Italy
Spain
Netherlands
Switzerland
Austria
Rest of Western Europe
Asia Pacific
China
India
Japan
South Korea
Vietnam
Singapore
Australia
Rest of Asia Pacific
Middle East & Africa
Middle East
UAE
Egypt
Saudi Arabia
Qatar
Rest of Middle East
Africa
Nigeria
South Africa
Rest of Africa
Latin America
Brazil
Argentina
Colombia
Rest of Latin America
Request for Country Level Research Report: Country Level Customization Request
Available Customization
With the given market data, SNS Insider offers customization as per the company’s specific needs. The following customization options are available for the report:
Product Analysis
Criss-Cross segment analysis (e.g. Product X Application)
Product Matrix which gives a detailed comparison of the product portfolio of each company
Geographic Analysis
Additional countries in any of the regions
Company Information
Detailed analysis and profiling of additional market players (Up to five)
Precast Concrete Market size was valued at USD 136.2 billion in 2023 and is expected to reach USD 224.3 billion by 2032, at a CAGR of 5.70% from 2024-2032.
The Aluminum Nitride Market was Valued at USD 150.250 Million in 2023 and is now anticipated to grow to USD 245.58 Million by 2032, displaying a compound annual growth rate (CAGR) 4.98% of during the forecast Period 2024 - 2032.
Hot Melt Adhesives Market was valued at USD 8.44 billion in 2023 and is expected to reach USD 12.10 Billion by 2032, growing at a CAGR of 4.11 % from 2024-2032.
The Cold Flow Improver Market size was USD 812.49 Million in 2023 and is expected to reach USD 1348.74 Million by 2032, at a CAGR of 5.79 % from 2024-2032.
Explore the Specialty Oleochemicals Market, focusing on applications in personal care, pharmaceuticals, and industrial sectors. Learn about trends in bio-based chemicals, sustainability, and rising demand for specialty oleochemicals in cosmetics and food
Oilfield Chemicals Market was USD 28.5 billion in 2023 and is expected to reach USD 40.2 billion by 2032, growing at a CAGR of 3.9 % from 2024 to 2032.

Hi! Click one of our member below to chat on Phone
© 2025 All Rights Reserved by SNS Insider Pvt Ltd


