The Tab Leads and Tab Seal Film Market Size was esteemed at USD 374.65 Million in 2023 and is supposed to arrive at USD 1174.91 Million by 2032 with a growing CAGR of 13.54% over the forecast period 2024-2032. This report offers a unique perspective on the Tab Leads and Tab Seal Film Market by analyzing manufacturing output trends and production capacity utilization, providing insights into industry efficiency. It highlights maintenance and downtime patterns, addressing key operational challenges. The study explores technological advancements and adoption, showcasing innovations shaping the industry. Additionally, it examines export-import dynamics, identifying trade flows and supply chain dependencies. To enhance its uniqueness, the report also covers sustainability trends in battery packaging materials, emerging regulatory impacts on production, and strategic supplier collaborations, offering a forward-looking market outlook.

To get more information on Tab Leads and Tab Seal Film Market - Request Free Sample Report
Drivers
The growing demand for lithium-ion batteries in EVs, consumer electronics, and energy storage systems is driving the tab leads and tab seal film market.
The Tab Leads and Tab Seal Film Market is experiencing significant growth due to the rising adoption of lithium-ion batteries across multiple industries, electric vehicles (EVs) take off in production, the demand for efficient and durable battery components, including tab leads and seal films, is growing sharply. Moreover, the increasing demand for consumer electronics, including smartphones, laptops, and wearables, pushes up the market growth. There has also been an increasing demand for advanced battery technologies due to the developments of renewable energy storage systems, especially solar and wind energies. Other trending technologies include lightweight, high-performing materials to improve battery efficiency and sustainable, recyclable materials for battery packaging. Global governments are as well promoting EV adaption and energy storage projects, strengthening the market demand. Market growth is expected to remain steady in the coming years, as applications for lithium-ion batteries expand.
Restraint
The high production cost of tab leads and tab seal films is driven by complex manufacturing processes, expensive raw materials, and stringent quality standards.
The production of high-quality tab leads and tab seal films requires advanced manufacturing processes and specialized materials, significantly driving up costs. Such elements need to abide by rigorous performance requirements such as electrical conductivity, thermal resistance, and mechanical durability, which requires the utilization of high-quality products such as aluminum, copper, and nickel. Furthermore, specialized coating and lamination methods are also needed to optimize the performance and safety of the cells, thereby contributing to an additional rise in production costs. If we factor in the challenges of precision engineering, quality assurance, and regulatory compliance, the total cost burden is multiplied. In addition, raw material price volatility and supply chain disruptions could present further financial strain for manufacturers. This leads to limited affordability due to high production costs, making it tough for smaller and medium-sized battery producers to compete with big players. Factors such as technological advancements and economies of scale can lead to reductions in costs over time, with affordability long being a key restraint in the widespread adoption of these critical battery components.
Opportunities
The shift to sustainable and recyclable materials in battery packaging creates new revenue opportunities while supporting environmental regulations and circular economy initiatives.
The growing emphasis on sustainability is driving the demand for eco-friendly and recyclable materials in battery packaging, including tab leads and tab seal films. These materials include biodegradable polymers, recycled metals, and low-carbon-footprint materials that are better suited to environmental regulations and consumer preferences. Implementing sustainable materials not only helps curb battery waste from the environment but also bolsters brand reputation and aligns with sustainability initiatives on a global level. Governments and industry bodies are also pushing circular economy concepts, promoting recycling and material recovery of batteries. This transition also generates new opportunities for companies that are investing in green technologies because demand is increasing for sustainable solutions — both in electric vehicles, consumer electronics and energy storage systems. But, like any such thing, there are hurdles to clear in achieving the same durability, conductivity, and performance delivered by convention materials. Continuous research needs to be done, especially in material science, to develop sustainable tab leads and tab seal film that are commercially viable and widely adopted.
Challenges
Ensuring the thermal and mechanical stability of tab leads and tab seal films is challenging due to high temperatures, mechanical stress, and material degradation.
Ensuring the thermal and mechanical stability of tab leads and tab seal films is a critical challenge, as these components must withstand extreme operating conditions in batteries. Materials can break down, reducing conductiveness and battery efficiency, as a result of elevated temperatures created during charge and discharge. In-kind, repeated mechanical stress caused by vibrations, impacts, or continuous use could cause wear, cracks, or detachment that might affect the battery's safety and efficiency. Careful design of materials like aluminum, copper, and polyamide is necessary to find the right trade-off between flexibility, strength, and thermal resistance to ensure good electrical performance. Furthermore, each battery design and application is unique, so custom solutions are increasing complexity for manufacturers. To avoid failures, long-term durability is crucial in electric vehicles, industrial batteries, and energy storage systems under extreme conditions. To further discover these challenges, ongoing development of material science, coatings, and reinforcement technology will not only be critical to achieving next-generation power capabilities, but also ensuring the reliability of tab leads and tab seal films in modern battery applications well into the future.
By Material
The aluminum segment dominated with a market share of over 34% in 2023, due to its superior heat transfer efficiency, durability, and corrosion resistance. Aluminum is often used in ERV heat exchangers for optimal heat and moisture transfer while providing lasting performance. Light weight So easy to use and install ERV system, therefore manufacture extend its use. Moreover, its resistance to diverse environmental conditions makes aluminum a relatively reliable material for residential as well as commercial applications. This is because the increasing focus on energy efficiency and sustainability has driven demand for aluminum-based ERVs, which reduce energy expenses and promote indoor air quality without sacrificing ventilation performance.
By End User
The Consumer Electronics segment dominated with the market share of over 32% in 2023, due to the increasing demand for energy-efficient devices in residential and commercial electronics. While consumers are now more concerned about sustainability than ever, manufacturers are leveraging energy recovery systems that help to minimize energy consumption in units including air conditioners, refrigerators, and home appliances. The Electric Vehicles Segment is expected to grow at the highest growth rate, owing to the increasing penetration of electric vehicles and the need for efficient thermal management in battery systems. Military applications also help grow the market as energy recovery systems in advance equipment and combat drafts are widely implemented in combat vehicles to improve the power consumption. Strong growth is also to be expected in the Industrial segment with companies needing climate management to reduce energy costs and factories looking for energy-efficient ventilation solutions.
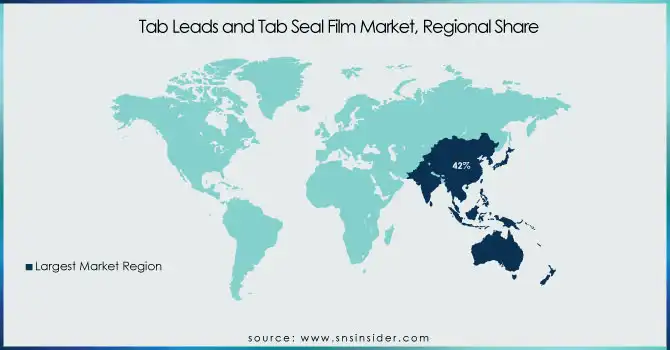
Asia-Pacific region dominated with a market share of over 42% in 2023, due to its expansive manufacturing base, with major contributions from countries like China, India, and Japan. These countries are major contributors in the electronics, automotive, packaging, and other industries, where extensive use of tab leads and tab seal films is being done across various application areas. The area has a developed supply chain, low-cost production, and speedy industrialization, supporting large-scale production and consumption. Moreover, the rise in demand for consumer electronics, automotive components, and advanced packaging solutions are also fueling the market position in Asia-Pacific. Consequently, the region is still at the head of the marketplace, and in particular, it acts as a focal point for manufacturing and innovation relating to these industries.
North America is experiencing rapid growth in the Tab Leads and Tab Seal Film Market, fueled by technological advancements and increasing demand for high-performance packaging solutions. This growth is being driven by critical industries such as pharmaceuticals, food and beverage, and electronics, which are looking for more reliable and efficient options for their packaging. Market growth in the region is primarily due to an emphasis on sustainability, and greater use of green materials. Moreover, the presence of key players in the packaging industry and ongoing innovations in either materials or processes also fuel market strides. North America is fast becoming the fastest growing region in this area as businesses are focusing more on functionality, and environmental sustainability when it comes to packaging technologies.
Get Customized Report as per Your Business Requirement - Enquiry Now
Avocet Steel (Battery Tab Materials)
Clavis Corporation (Tab Leads, Battery Packaging Materials)
Daest Coating India Pvt Ltd. (Adhesive Coated Films, Insulation Films)
Misuzu Holding (Battery Tabs, Conductive Films)
Nepes (Battery Packaging Films, Insulation Films)
Nitto Denko Corporation (Battery Seal Films, Insulation Tapes)
Okura Industrial Co., Ltd. (Battery Tab Leads, Flexible Packaging)
Sama (Battery Components, Sealing Films)
Soulbrain Co., Ltd. (Battery Tab Materials, Electrolyte Solutions)
Sumitomo Electric Industries (Battery Tab Leads, Conductive Films)
T&T Enertechno Co., Ltd. (Battery Tabs, Heat-Resistant Films)
Yujin Technology (Battery Tab Leads, High-Performance Films)
Zacros (Shenzhen) Co., Ltd. (Sealing Films, Battery Components)
Furukawa Electric Co., Ltd. (Battery Tab Materials, Copper Foils)
DNP Group (Dai Nippon Printing) (Battery Packaging Films, Electrode Materials)
Toyo Aluminium K.K. (Aluminum-Based Battery Tabs, Sealing Films)
Shenzhen Kejing Star Technology Co., Ltd. (Battery Tabs, Conductive Films)
Mitsui Mining & Smelting Co., Ltd. (Battery Tab Materials, Metal Foils)
Shanghai Tokuen Precision Materials Co., Ltd. (Battery Tabs, Laminated Films)
W-Scope Corporation (High-Barrier Films, Battery Insulation Materials)
Suppliers for (High-performance tab leads for lithium-ion batteries, known for reliability and conductivity) on Tab Leads and Tab Seal Film Market
Sumitomo Electric Industries, Ltd. (Japan)
MISUZU Holding (China)
SAMA (South Korea)
Yujin Technology (South Korea)
NEPES (South Korea)
Nitto Denko Corporation (Japan)
ZACROS (Shenzhen) Co., Ltd. (China)
T&T Enertechno Co., Ltd. (Japan)
Daest Coating India Pvt. Ltd. (India)
Dai Nippon Printing Co., Ltd. (Japan)
RECENT DEVELOPMENT
In January 2022: NEPES YAHAD, a subsidiary of NEPES specializing in battery components, provided lead tabs to international secondary battery manufacturers for the first time.
| Report Attributes | Details |
|---|---|
| Market Size in 2023 | USD 374.65 Million |
| Market Size by 2032 | USD 1174.91 Million |
| CAGR | CAGR of 13.54% From 2024 to 2032 |
| Base Year | 2023 |
| Forecast Period | 2024-2032 |
| Historical Data | 2020-2022 |
| Report Scope & Coverage | Market Size, Segments Analysis, Competitive Landscape, Regional Analysis, DROC & SWOT Analysis, Forecast Outlook |
| Key Segments | • By Material (Aluminum, Copper, Nickel, Polyamide, Others (polypropylene and other polyolefin) • By End User (Consumer Electronics, Electric Vehicles, Military, Industrial, Others (forklift, floor scrubber, and other specialty applications) |
| Regional Analysis/Coverage | North America (US, Canada, Mexico), Europe (Eastern Europe [Poland, Romania, Hungary, Turkey, Rest of Eastern Europe] Western Europe] Germany, France, UK, Italy, Spain, Netherlands, Switzerland, Austria, Rest of Western Europe]), Asia Pacific (China, India, Japan, South Korea, Vietnam, Singapore, Australia, Rest of Asia Pacific), Middle East & Africa (Middle East [UAE, Egypt, Saudi Arabia, Qatar, Rest of Middle East], Africa [Nigeria, South Africa, Rest of Africa], Latin America (Brazil, Argentina, Colombia, Rest of Latin America) |
| Company Profiles | Avocet Steel, Clavis Corporation, Daest Coating India Pvt Ltd., Misuzu Holding, Nepes, Nitto Denko Corporation, Okura Industrial Co., Ltd., Sama, Soulbrain Co., Ltd., Sumitomo Electric Industries, T&T Enertechno Co., Ltd., Yujin Technology, Zacros (Shenzhen) Co., Ltd., Furukawa Electric Co., Ltd., DNP Group (Dai Nippon Printing), Toyo Aluminium K.K., Shenzhen Kejing Star Technology Co., Ltd., Mitsui Mining & Smelting Co., Ltd., Shanghai Tokuen Precision Materials Co., Ltd., W-Scope Corporation. |
Ans: The Tab Leads and Tab Seal Film Market is expected to grow at a CAGR of 13.54% during 2024-2032.
Ans: The Tab Leads and Tab Seal Film Market was USD 374.65 Million in 2023 and is expected to Reach USD 1174.91 Million by 2032.
Ans: The growing demand for lithium-ion batteries in EVs, consumer electronics, and energy storage systems is driving the tab leads and tab seal film market.
Ans: The “aluminum” segment dominated the Tab Leads and Tab Seal Film Market.
Ans: Asia-Pacific dominated the Tab Leads and Tab Seal Film Market in 2023
Table of Contents:
1. Introduction
1.1 Market Definition
1.2 Scope (Inclusion and Exclusions)
1.3 Research Assumptions
2. Executive Summary
2.1 Market Overview
2.2 Regional Synopsis
2.3 Competitive Summary
3. Research Methodology
3.1 Top-Down Approach
3.2 Bottom-up Approach
3.3. Data Validation
3.4 Primary Interviews
4. Market Dynamics Impact Analysis
4.1 Market Driving Factors Analysis
4.1.2 Drivers
4.1.2 Restraints
4.1.3 Opportunities
4.1.4 Challenges
4.2 PESTLE Analysis
4.3 Porter’s Five Forces Model
5. Statistical Insights and Trends Reporting
5.1 Manufacturing Output of Tab Leads and Tab Seal Film, by Region (2020-2023)
5.2 Production Capacity and Utilization Rates, by Region (2020-2023)
5.3 Maintenance and Downtime Trends in Tab Leads and Tab Seal Film Manufacturing
5.4 Technological Advancements and Adoption Rates, by Region
5.5 Export and Import Trends of Tab Leads and Tab Seal Film, by Region (2023)
6. Competitive Landscape
6.1 List of Major Companies, By Region
6.2 Market Share Analysis, By Region
6.3 Product Benchmarking
6.3.1 Product specifications and features
6.3.2 Pricing
6.4 Strategic Initiatives
6.4.1 Marketing and promotional activities
6.4.2 Distribution and supply chain strategies
6.4.3 Expansion plans and new product launches
6.4.4 Strategic partnerships and collaborations
6.5 Technological Advancements
6.6 Market Positioning and Branding
7. Tab Leads and Tab Seal Film Market Segmentation, By Material
7.1 Chapter Overview
7.2 Aluminum
7.2.1 Aluminum Market Trends Analysis (2020-2032)
7.2.2 Aluminum Market Size Estimates and Forecasts to 2032 (USD Million)
7.3 Copper
7.3.1 Copper Market Trends Analysis (2020-2032)
7.3.2 Copper Market Size Estimates and Forecasts to 2032 (USD Million)
7.4 Nickel
7.4.1 Nickel Market Trends Analysis (2020-2032)
7.4.2 Nickel Market Size Estimates and Forecasts to 2032 (USD Million)
7.5 Polyamide
7.5.1 Polyamide Market Trends Analysis (2020-2032)
7.5.2 Polyamide Market Size Estimates and Forecasts to 2032 (USD Million)
7.6 Others (polypropylene and other polyolefin)
7.6.1 Others (polypropylene and other polyolefin) Market Trends Analysis (2020-2032)
7.6.2 Others (polypropylene and other polyolefin) Market Size Estimates and Forecasts to 2032 (USD Million)
8. Tab Leads and Tab Seal Film Market Segmentation, By End User
8.1 Chapter Overview
8.2 Consumer Electronics
8.2.1 Consumer Electronics Market Trends Analysis (2020-2032)
8.2.2 Consumer Electronics Market Size Estimates and Forecasts to 2032 (USD Million)
8.3Electric Vehicles
8.3.1Electric Vehicles Market Trends Analysis (2020-2032)
8.3.2Electric Vehicles Market Size Estimates and Forecasts to 2032 (USD Million)
8.4 Military
8.4.1Military Market Trends Analysis (2020-2032)
8.4.2Military Market Size Estimates and Forecasts to 2032 (USD Million)
8.5Industrial
8.5.1Industrial Market Trends Analysis (2020-2032)
8.5.2Industrial Market Size Estimates and Forecasts to 2032 (USD Million)
8.6 Others (forklift, floor scrubber, and other specialty applications)
8.6.1Others (forklift, floor scrubber, and other specialty applications) Market Trends Analysis (2020-2032)
8.6.2Others (forklift, floor scrubber, and other specialty applications) Market Size Estimates and Forecasts to 2032 (USD Million)
9. Regional Analysis
9.1 Chapter Overview
9.2 North America
9.2.1 Trends Analysis
9.2.2 North America Tab Leads and Tab Seal Film Market Estimates and Forecasts, by Country (2020-2032) (USD Million)
9.2.3 North America Tab Leads and Tab Seal Film Market Estimates and Forecasts, by Material (2020-2032) (USD Million)
9.2.4 North America Tab Leads and Tab Seal Film Market Estimates and Forecasts, by End-User (2020-2032) (USD Million)
9.2.5 USA
9.2.5.1 USA Tab Leads and Tab Seal Film Market Estimates and Forecasts, by Material (2020-2032) (USD Million)
9.2.5.2 USA Tab Leads and Tab Seal Film Market Estimates and Forecasts, by End-User (2020-2032) (USD Million)
9.2.6 Canada
9.2.6.1 Canada Tab Leads and Tab Seal Film Market Estimates and Forecasts, by Material (2020-2032) (USD Million)
9.2.6.2 Canada Tab Leads and Tab Seal Film Market Estimates and Forecasts, by End-User (2020-2032) (USD Million)
9.2.7 Mexico
9.2.7.1 Mexico Tab Leads and Tab Seal Film Market Estimates and Forecasts, by Material (2020-2032) (USD Million)
9.2.7.2 Mexico Tab Leads and Tab Seal Film Market Estimates and Forecasts, by End-User (2020-2032) (USD Million)
9.3 Europe
9.3.1 Eastern Europe
9.3.1.1 Trends Analysis
9.3.1.2 Eastern Europe Tab Leads and Tab Seal Film Market Estimates and Forecasts, by Country (2020-2032) (USD Million)
9.3.1.3 Eastern Europe Tab Leads and Tab Seal Film Market Estimates and Forecasts, by Material (2020-2032) (USD Million)
9.3.1.4 Eastern Europe Tab Leads and Tab Seal Film Market Estimates and Forecasts, by End-User (2020-2032) (USD Million)
9.3.1.5 Poland
9.3.1.5.1 Poland Tab Leads and Tab Seal Film Market Estimates and Forecasts, by Material (2020-2032) (USD Million)
9.3.1.5.2 Poland Tab Leads and Tab Seal Film Market Estimates and Forecasts, by End-User (2020-2032) (USD Million)
9.3.1.6 Romania
9.3.1.6.1 Romania Tab Leads and Tab Seal Film Market Estimates and Forecasts, by Material (2020-2032) (USD Million)
9.3.1.6.2 Romania Tab Leads and Tab Seal Film Market Estimates and Forecasts, by End-User (2020-2032) (USD Million)
9.3.1.7 Hungary
9.3.1.7.1 Hungary Tab Leads and Tab Seal Film Market Estimates and Forecasts, by Material (2020-2032) (USD Million)
9.3.1.7.2 Hungary Tab Leads and Tab Seal Film Market Estimates and Forecasts, by End-User (2020-2032) (USD Million)
9.3.1.8 Turkey
9.3.1.8.1 Turkey Tab Leads and Tab Seal Film Market Estimates and Forecasts, by Material (2020-2032) (USD Million)
9.3.1.8.2 Turkey Tab Leads and Tab Seal Film Market Estimates and Forecasts, by End-User (2020-2032) (USD Million)
9.3.1.9 Rest of Eastern Europe
9.3.1.9.1 Rest of Eastern Europe Tab Leads and Tab Seal Film Market Estimates and Forecasts, by Material (2020-2032) (USD Million)
9.3.1.9.2 Rest of Eastern Europe Tab Leads and Tab Seal Film Market Estimates and Forecasts, by End-User (2020-2032) (USD Million)
9.3.2 Western Europe
9.3.2.1 Trends Analysis
9.3.2.2 Western Europe Tab Leads and Tab Seal Film Market Estimates and Forecasts, by Country (2020-2032) (USD Million)
9.3.2.3 Western Europe Tab Leads and Tab Seal Film Market Estimates and Forecasts, by Material (2020-2032) (USD Million)
9.3.2.4 Western Europe Tab Leads and Tab Seal Film Market Estimates and Forecasts, by End-User (2020-2032) (USD Million)
9.3.2.5 Germany
9.3.2.5.1 Germany Tab Leads and Tab Seal Film Market Estimates and Forecasts, by Material (2020-2032) (USD Million)
9.3.2.5.2 Germany Tab Leads and Tab Seal Film Market Estimates and Forecasts, by End-User (2020-2032) (USD Million)
9.3.2.6 France
9.3.2.6.1 France Tab Leads and Tab Seal Film Market Estimates and Forecasts, by Material (2020-2032) (USD Million)
9.3.2.6.2 France Tab Leads and Tab Seal Film Market Estimates and Forecasts, by End-User (2020-2032) (USD Million)
9.3.2.7 UK
9.3.2.7.1 UK Tab Leads and Tab Seal Film Market Estimates and Forecasts, by Material (2020-2032) (USD Million)
9.3.2.7.2 UK Tab Leads and Tab Seal Film Market Estimates and Forecasts, by End-User (2020-2032) (USD Million)
9.3.2.8 Italy
9.3.2.8.1 Italy Tab Leads and Tab Seal Film Market Estimates and Forecasts, by Material (2020-2032) (USD Million)
9.3.2.8.2 Italy Tab Leads and Tab Seal Film Market Estimates and Forecasts, by End-User (2020-2032) (USD Million)
9.3.2.9 Spain
9.3.2.9.1 Spain Tab Leads and Tab Seal Film Market Estimates and Forecasts, by Material (2020-2032) (USD Million)
9.3.2.9.2 Spain Tab Leads and Tab Seal Film Market Estimates and Forecasts, by End-User (2020-2032) (USD Million)
9.3.2.10 Netherlands
9.3.2.10.1 Netherlands Tab Leads and Tab Seal Film Market Estimates and Forecasts, by Material (2020-2032) (USD Million)
9.3.2.10.2 Netherlands Tab Leads and Tab Seal Film Market Estimates and Forecasts, by End-User (2020-2032) (USD Million)
9.3.2.11 Switzerland
9.3.2.11.1 Switzerland Tab Leads and Tab Seal Film Market Estimates and Forecasts, by Material (2020-2032) (USD Million)
9.3.2.11.2 Switzerland Tab Leads and Tab Seal Film Market Estimates and Forecasts, by End-User (2020-2032) (USD Million)
9.3.2.12 Austria
9.3.2.12.1 Austria Tab Leads and Tab Seal Film Market Estimates and Forecasts, by Material (2020-2032) (USD Million)
9.3.2.12.2 Austria Tab Leads and Tab Seal Film Market Estimates and Forecasts, by End-User (2020-2032) (USD Million)
9.3.2.13 Rest of Western Europe
9.3.2.13.1 Rest of Western Europe Tab Leads and Tab Seal Film Market Estimates and Forecasts, by Material (2020-2032) (USD Million)
9.3.2.13.2 Rest of Western Europe Tab Leads and Tab Seal Film Market Estimates and Forecasts, by End-User (2020-2032) (USD Million)
9.4 Asia Pacific
9.4.1 Trends Analysis
9.4.2 Asia Pacific Tab Leads and Tab Seal Film Market Estimates and Forecasts, by Country (2020-2032) (USD Million)
9.4.3 Asia Pacific Tab Leads and Tab Seal Film Market Estimates and Forecasts, by Material (2020-2032) (USD Million)
9.4.4 Asia Pacific Tab Leads and Tab Seal Film Market Estimates and Forecasts, by End-User (2020-2032) (USD Million)
9.4.5 China
9.4.5.1 China Tab Leads and Tab Seal Film Market Estimates and Forecasts, by Material (2020-2032) (USD Million)
9.4.5.2 China Tab Leads and Tab Seal Film Market Estimates and Forecasts, by End-User (2020-2032) (USD Million)
9.4.6 India
9.4.5.1 India Tab Leads and Tab Seal Film Market Estimates and Forecasts, by Material (2020-2032) (USD Million)
9.4.5.2 India Tab Leads and Tab Seal Film Market Estimates and Forecasts, by End-User (2020-2032) (USD Million)
9.4.5 Japan
9.4.5.1 Japan Tab Leads and Tab Seal Film Market Estimates and Forecasts, by Material (2020-2032) (USD Million)
9.4.5.2 Japan Tab Leads and Tab Seal Film Market Estimates and Forecasts, by End-User (2020-2032) (USD Million)
9.4.6 South Korea
9.4.6.1 South Korea Tab Leads and Tab Seal Film Market Estimates and Forecasts, by Material (2020-2032) (USD Million)
9.4.6.2 South Korea Tab Leads and Tab Seal Film Market Estimates and Forecasts, by End-User (2020-2032) (USD Million)
9.4.7 Vietnam
9.4.7.1 Vietnam Tab Leads and Tab Seal Film Market Estimates and Forecasts, by Material (2020-2032) (USD Million)
9.2.7.2 Vietnam Tab Leads and Tab Seal Film Market Estimates and Forecasts, by End-User (2020-2032) (USD Million)
9.4.8 Singapore
9.4.8.1 Singapore Tab Leads and Tab Seal Film Market Estimates and Forecasts, by Material (2020-2032) (USD Million)
9.4.8.2 Singapore Tab Leads and Tab Seal Film Market Estimates and Forecasts, by End-User (2020-2032) (USD Million)
9.4.9 Australia
9.4.9.1 Australia Tab Leads and Tab Seal Film Market Estimates and Forecasts, by Material (2020-2032) (USD Million)
9.4.9.2 Australia Tab Leads and Tab Seal Film Market Estimates and Forecasts, by End-User (2020-2032) (USD Million)
9.4.10 Rest of Asia Pacific
9.4.10.1 Rest of Asia Pacific Tab Leads and Tab Seal Film Market Estimates and Forecasts, by Material (2020-2032) (USD Million)
9.4.10.2 Rest of Asia Pacific Tab Leads and Tab Seal Film Market Estimates and Forecasts, by End-User (2020-2032) (USD Million)
9.5 Middle East and Africa
9.5.1 Middle East
9.5.1.1 Trends Analysis
9.5.1.2 Middle East Tab Leads and Tab Seal Film Market Estimates and Forecasts, by Country (2020-2032) (USD Million)
9.5.1.3 Middle East Tab Leads and Tab Seal Film Market Estimates and Forecasts, by Material (2020-2032) (USD Million)
9.5.1.4 Middle East Tab Leads and Tab Seal Film Market Estimates and Forecasts, by End-User (2020-2032) (USD Million)
9.5.1.5 UAE
9.5.1.5.1 UAE Tab Leads and Tab Seal Film Market Estimates and Forecasts, by Material (2020-2032) (USD Million)
9.5.1.5.2 UAE Tab Leads and Tab Seal Film Market Estimates and Forecasts, by End-User (2020-2032) (USD Million)
9.5.1.6 Egypt
9.5.1.6.1 Egypt Tab Leads and Tab Seal Film Market Estimates and Forecasts, by Material (2020-2032) (USD Million)
9.5.1.6.2 Egypt Tab Leads and Tab Seal Film Market Estimates and Forecasts, by End-User (2020-2032) (USD Million)
9.5.1.7 Saudi Arabia
9.5.1.7.1 Saudi Arabia Tab Leads and Tab Seal Film Market Estimates and Forecasts, by Material (2020-2032) (USD Million)
9.5.1.7.2 Saudi Arabia Tab Leads and Tab Seal Film Market Estimates and Forecasts, by End-User (2020-2032) (USD Million)
9.5.1.8 Qatar
9.5.1.8.1 Qatar Tab Leads and Tab Seal Film Market Estimates and Forecasts, by Material (2020-2032) (USD Million)
9.5.1.8.2 Qatar Tab Leads and Tab Seal Film Market Estimates and Forecasts, by End-User (2020-2032) (USD Million)
9.5.1.9 Rest of Middle East
9.5.1.9.1 Rest of Middle East Tab Leads and Tab Seal Film Market Estimates and Forecasts, by Material (2020-2032) (USD Million)
9.5.1.9.2 Rest of Middle East Tab Leads and Tab Seal Film Market Estimates and Forecasts, by End-User (2020-2032) (USD Million)
9.5.2 Africa
9.5.2.1 Trends Analysis
9.5.2.2 Africa Tab Leads and Tab Seal Film Market Estimates and Forecasts, by Country (2020-2032) (USD Million)
9.5.2.3 Africa Tab Leads and Tab Seal Film Market Estimates and Forecasts, by Material (2020-2032) (USD Million)
9.5.2.4 Africa Tab Leads and Tab Seal Film Market Estimates and Forecasts, by End-User (2020-2032) (USD Million)
9.5.2.5 South Africa
9.5.2.5.1 South Africa Tab Leads and Tab Seal Film Market Estimates and Forecasts, by Material (2020-2032) (USD Million)
9.5.2.5.2 South Africa Tab Leads and Tab Seal Film Market Estimates and Forecasts, by End-User (2020-2032) (USD Million)
9.5.2.6 Nigeria
9.5.2.6.1 Nigeria Tab Leads and Tab Seal Film Market Estimates and Forecasts, by Material (2020-2032) (USD Million)
9.5.2.6.2 Nigeria Tab Leads and Tab Seal Film Market Estimates and Forecasts, by End-User (2020-2032) (USD Million)
9.5.2.7 Rest of Africa
9.5.2.7.1 Rest of Africa Tab Leads and Tab Seal Film Market Estimates and Forecasts, by Material (2020-2032) (USD Million)
9.5.2.7.2 Rest of Africa Tab Leads and Tab Seal Film Market Estimates and Forecasts, by End-User (2020-2032) (USD Million)
9.6 Latin America
9.6.1 Trends Analysis
9.6.2 Latin America Tab Leads and Tab Seal Film Market Estimates and Forecasts, by Country (2020-2032) (USD Million)
9.6.3 Latin America Tab Leads and Tab Seal Film Market Estimates and Forecasts, by Material (2020-2032) (USD Million)
9.6.4 Latin America Tab Leads and Tab Seal Film Market Estimates and Forecasts, by End-User (2020-2032) (USD Million)
9.6.5 Brazil
9.6.5.1 Brazil Tab Leads and Tab Seal Film Market Estimates and Forecasts, by Material (2020-2032) (USD Million)
9.6.5.2 Brazil Tab Leads and Tab Seal Film Market Estimates and Forecasts, by End-User (2020-2032) (USD Million)
9.6.6 Argentina
9.6.6.1 Argentina Tab Leads and Tab Seal Film Market Estimates and Forecasts, by Material (2020-2032) (USD Million)
9.6.6.2 Argentina Tab Leads and Tab Seal Film Market Estimates and Forecasts, by End-User (2020-2032) (USD Million)
9.6.7 Colombia
9.6.7.1 Colombia Tab Leads and Tab Seal Film Market Estimates and Forecasts, by Material (2020-2032) (USD Million)
9.6.7.2 Colombia Tab Leads and Tab Seal Film Market Estimates and Forecasts, by End-User (2020-2032) (USD Million)
9.6.8 Rest of Latin America
9.6.8.1 Rest of Latin America Tab Leads and Tab Seal Film Market Estimates and Forecasts, by Material (2020-2032) (USD Million)
9.6.8.2 Rest of Latin America Tab Leads and Tab Seal Film Market Estimates and Forecasts, by End-User (2020-2032) (USD Million)
10. Company Profiles
10.1 Avocet Steel
10.1.1 Company Overview
10.1.2 Financial
10.1.3 Products/ Services Offered
110.1.4 SWOT Analysis
10.2 Clavis Corporation
10.2.1 Company Overview
10.2.2 Financial
10.2.3 Products/ Services Offered
10.2.4 SWOT Analysis
10.3 Daest Coating India Pvt Ltd.
10.3.1 Company Overview
10.3.2 Financial
10.3.3 Products/ Services Offered
10.3.4 SWOT Analysis
10.4 Misuzu Holding
10.4.1 Company Overview
10.4.2 Financial
10.4.3 Products/ Services Offered
10.4.4 SWOT Analysis
10.5 Nepes
10.5.1 Company Overview
10.5.2 Financial
10.5.3 Products/ Services Offered
10.5.4 SWOT Analysis
10.6 Nitto Denko Corporation
10.6.1 Company Overview
10.6.2 Financial
10.6.3 Products/ Services Offered
10.6.4 SWOT Analysis
10.7 Okura Industrial Co., Ltd
10.7.1 Company Overview
10.7.2 Financial
10.7.3 Products/ Services Offered
10.7.4 SWOT Analysis
10.8 Sama
10.8.1 Company Overview
10.8.2 Financial
10.8.3 Products/ Services Offered
10.8.4 SWOT Analysis
10.9 Soulbrain Co., Ltd.
10.9.1 Company Overview
10.9.2 Financial
10.9.3 Products/ Services Offered
10.9.4 SWOT Analysis
10.10 Sumitomo Electric Industries
10.9.1 Company Overview
10.9.2 Financial
10.9.3 Products/ Services Offered
10.9.4 SWOT Analysis
11. Use Cases and Best Practices
12. Conclusion
An accurate research report requires proper strategizing as well as implementation. There are multiple factors involved in the completion of good and accurate research report and selecting the best methodology to compete the research is the toughest part. Since the research reports we provide play a crucial role in any company’s decision-making process, therefore we at SNS Insider always believe that we should choose the best method which gives us results closer to reality. This allows us to reach at a stage wherein we can provide our clients best and accurate investment to output ratio.
Each report that we prepare takes a timeframe of 350-400 business hours for production. Starting from the selection of titles through a couple of in-depth brain storming session to the final QC process before uploading our titles on our website we dedicate around 350 working hours. The titles are selected based on their current market cap and the foreseen CAGR and growth.
The 5 steps process:
Step 1: Secondary Research:
Secondary Research or Desk Research is as the name suggests is a research process wherein, we collect data through the readily available information. In this process we use various paid and unpaid databases which our team has access to and gather data through the same. This includes examining of listed companies’ annual reports, Journals, SEC filling etc. Apart from this our team has access to various associations across the globe across different industries. Lastly, we have exchange relationships with various university as well as individual libraries.

Step 2: Primary Research
When we talk about primary research, it is a type of study in which the researchers collect relevant data samples directly, rather than relying on previously collected data. This type of research is focused on gaining content specific facts that can be sued to solve specific problems. Since the collected data is fresh and first hand therefore it makes the study more accurate and genuine.
We at SNS Insider have divided Primary Research into 2 parts.
Part 1 wherein we interview the KOLs of major players as well as the upcoming ones across various geographic regions. This allows us to have their view over the market scenario and acts as an important tool to come closer to the accurate market numbers. As many as 45 paid and unpaid primary interviews are taken from both the demand and supply side of the industry to make sure we land at an accurate judgement and analysis of the market.
This step involves the triangulation of data wherein our team analyses the interview transcripts, online survey responses and observation of on filed participants. The below mentioned chart should give a better understanding of the part 1 of the primary interview.

Part 2: In this part of primary research the data collected via secondary research and the part 1 of the primary research is validated with the interviews from individual consultants and subject matter experts.
Consultants are those set of people who have at least 12 years of experience and expertise within the industry whereas Subject Matter Experts are those with at least 15 years of experience behind their back within the same space. The data with the help of two main processes i.e., FGDs (Focused Group Discussions) and IDs (Individual Discussions). This gives us a 3rd party nonbiased primary view of the market scenario making it a more dependable one while collation of the data pointers.
Step 3: Data Bank Validation
Once all the information is collected via primary and secondary sources, we run that information for data validation. At our intelligence centre our research heads track a lot of information related to the market which includes the quarterly reports, the daily stock prices, and other relevant information. Our data bank server gets updated every fortnight and that is how the information which we collected using our primary and secondary information is revalidated in real time.

Step 4: QA/QC Process
After all the data collection and validation our team does a final level of quality check and quality assurance to get rid of any unwanted or undesired mistakes. This might include but not limited to getting rid of the any typos, duplication of numbers or missing of any important information. The people involved in this process include technical content writers, research heads and graphics people. Once this process is completed the title gets uploader on our platform for our clients to read it.
Step 5: Final QC/QA Process:
This is the last process and comes when the client has ordered the study. In this process a final QA/QC is done before the study is emailed to the client. Since we believe in giving our clients a good experience of our research studies, therefore, to make sure that we do not lack at our end in any way humanly possible we do a final round of quality check and then dispatch the study to the client.
Key Segments
By Material
Aluminum
Copper
Nickel
Polyamide
Others (polypropylene and other polyolefin)
By End User
Consumer Electronics
Electric Vehicles
Military
Industrial
Others (forklift, floor scrubber, and other specialty applications)
Request for Segment Customization as per your Business Requirement: Segment Customization Request
Regional Coverage:
North America
US
Canada
Mexico
Europe
Eastern Europe
Poland
Romania
Hungary
Turkey
Rest of Eastern Europe
Western Europe
Germany
France
UK
Italy
Spain
Netherlands
Switzerland
Austria
Rest of Western Europe
Asia Pacific
China
India
Japan
South Korea
Vietnam
Singapore
Australia
Rest of Asia Pacific
Middle East & Africa
Middle East
UAE
Egypt
Saudi Arabia
Qatar
Rest of Middle East
Africa
Nigeria
South Africa
Rest of Africa
Latin America
Brazil
Argentina
Colombia
Rest of Latin America
Request for Country Level Research Report: Country Level Customization Request
Available Customization
With the given market data, SNS Insider offers customization as per the company’s specific needs. The following customization options are available for the report:
Detailed Volume Analysis
Criss-Cross segment analysis (e.g. Product X Application)
Competitive Product Benchmarking
Geographic Analysis
Additional countries in any of the regions
Customized Data Representation
Detailed analysis and profiling of additional market players
Shape Memory Alloys Market was estimated at USD 13.90 billion in 2023 and is supposed to reach USD 40.61 billion by 2032, at a CAGR of 12.65% from 2024-2032.
The Overhead Cranes Market size was valued at USD 5.24 Billion in 2023 and is expected to reach USD 8.68 Billion by 2032 and grow at a CAGR of 5.78% over the forecast period 2024-2032.
The Conveying Equipment Market Size was estimated at USD 52.39 billion in 2023 and is expected to arrive at USD 73.55 billion by 2032 with a growing CAGR of 3.84% over the forecast period 2024-2032.
The Oil & Gas Drill Bit Market was estimated at USD 5.83 billion in 2023 and is expected to reach USD 13.54 billion by 2032, with a growing CAGR of 9.81% over the forecast period 2024-2032.
The Ball Bearing Market Size was estimated at USD 10.66 billion in 2023 and is expected to arrive at USD 19.01 billion by 2032 with a growing CAGR of 6.64% over the forecast period 2024-2032.
The Industrial Dust Collector Market Size was estimated at USD 8.13 billion in 2023 and is expected to arrive at USD 13.12 billion by 2032 with a growing CAGR of 5.46% over the forecast period 2024-2032.

Hi! Click one of our member below to chat on Phone
© 2025 All Rights Reserved by SNS Insider Pvt Ltd


