Get More Information on System on Chip Market - Request Sample Report
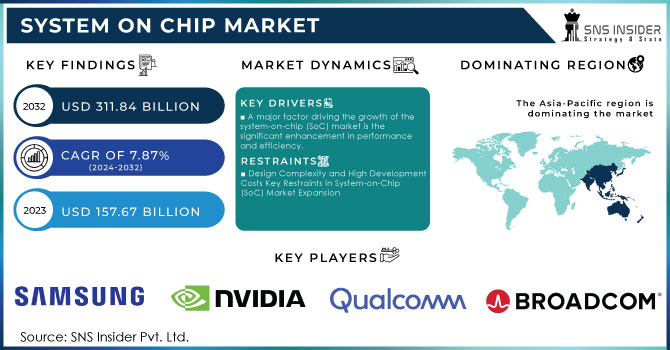
The System on Chip Market size was valued at USD 157.67 Billion in 2023 and is expected to reach USD 311.84 Billion by 2032 and grow at a CAGR of 7.87% over the forecast period 2024-2032.
The growing integration of artificial intelligence (AI) and machine learning (ML) technologies is a key driver for the expansion of the system-on-chip (SoC) market. As businesses in sectors like healthcare and finance aim to boost operational efficiency, the demand for specialized SoCs tailored for AI and ML applications is increasing. Notably, a report reveals that 78% of mainframe shops are now piloting AI applications, signaling a significant shift toward the adoption of advanced computing solutions. Companies such as Google and MediaTek are responding to this trend by developing AI chips that optimize data processing, highlighting the urgent need for innovative SoC designs. Various industries are witnessing a notable rise in AI adoption, with organizations increasingly depending on intelligent systems to enhance patient outcomes and streamline their operations. This trend is further supported by findings indicating that security concerns related to AI and AIOps are among the top challenges for mainframe users, reinforcing the necessity for robust SoCs capable of managing intricate AI tasks. The collaboration among system and chip manufacturers to create cohesive AI platforms also highlights the industry's momentum in utilizing SoCs for AI progress. In conclusion, the increasing demand for AI capabilities is propelling the SoC market forward, as companies aim to produce chips that align with the rapidly evolving technological landscape. This trend not only boosts processing power in data centers but also sets the stage for innovative solutions across diverse sectors, thereby driving future growth within the semiconductor industry.
The automotive applications sector is experiencing significant growth in the system-on-chip (SoC) market, largely fueled by the increasing demand for advanced driver-assistance systems (ADAS) and autonomous vehicles. Integrating SoCs into vehicles greatly enhances safety features and enriches in-car experiences. Major companies, including GM and Mercedes, are making substantial investments in chip technology, with reports highlighting a qualification for a USD 750 million U.S. chip grant aimed at advancing automotive chip development. Collaborations like the one between Bosch and Tenstorrent focus on standardizing automotive chips, highlighting the industry’s dedication to improving performance and integration. This momentum reflects the ongoing push for smarter and more connected vehicles, which is shaping the future of automotive technology while enhancing safety and user experience. Such trends underline the immense growth potential for SoCs within the automotive sector, aligning with broader advancements in semiconductor innovation
Drivers
A major factor driving the growth of the system-on-chip (SoC) market is the significant enhancement in performance and efficiency.
Recent advancements in semiconductor manufacturing technologies have led to the creation of more robust and efficient SoCs. Innovations such as smaller process nodes and refined architectural designs enable these chips to achieve superior performance while minimizing power consumption, making them highly attractive across various applications. This trend is particularly pronounced as industries increasingly turn to SoCs to handle demanding tasks, including artificial intelligence (AI) and machine learning (ML), which necessitate considerable computational resources. For instance, substantial investments are being made in the U.S. semiconductor industry to develop AI-integrated circuits, underscoring a strong commitment to technological advancement. Collaborations between key players like Synopsys and Taiwan Semiconductor Manufacturing Company highlight ongoing efforts to enhance chip performance. Such innovations not only fulfill the requirements of device manufacturers but also align with consumer expectations for faster and more efficient technology. As businesses aim for operational efficiency and improved user experiences, the demand for high-performance SoCs is expected to grow, further propelling expansion within the semiconductor sector.
Restraints
Design Complexity and High Development Costs Key Restraints in System-on-Chip (SoC) Market Expansion
The development of system-on-chip (SoC) technologies faces significant market restraints primarily due to the complexity of design and integration processes. As applications become more demanding, the architectural requirements for SoCs are evolving, leading to longer development cycles and increased costs. This intricate design landscape can deter smaller companies from entering the market or expanding their product offerings, as they may lack the necessary resources to navigate these challenges. Furthermore, developing cutting-edge SoCs necessitates substantial investment in research and development, specialized equipment, and highly skilled personnel. These high costs create barriers to entry for startups and smaller firms, making it difficult for them to compete with established players in the semiconductor industry. As a result, this dynamic may lead to market consolidation and reduced innovation, stifling the potential for new entrants to introduce novel solutions and technologies. Overall, the complexities associated with SoC development not only challenge smaller firms but also pose significant obstacles to the overall growth and evolution of the semiconductor market.
By Type
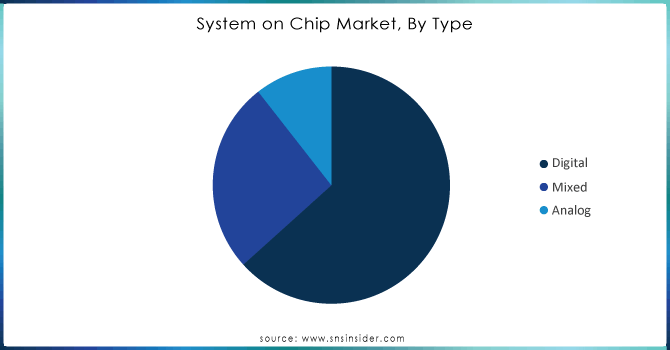
The digital segment of the System on Chip (SoC) market captured 58% of the revenue share in 2023, reflecting its significant role across various industries such as consumer electronics, telecommunications, and automotive. This segment includes critical components like microcontrollers, digital signal processors (DSPs), and application-specific integrated circuits (ASICs), essential for running complex algorithms and efficiently processing large data volumes, particularly in AI and machine learning. The growing adoption of connected devices, especially in the Internet of Things (IoT) domain, further enhances the demand for digital SoCs. Continued advancements in semiconductor technology are expected to sustain this growth.
Need Any Customization Research On System on Chip Market - Inquiry Now
By Application
In the System on Chip (SoC) market, portable electronic devices captured around 41% of the revenue share in 2023, reinforcing their dominance as the largest segment. This growth stems from the widespread use of smartphones, tablets, wearables, and smart home devices, all of which demand advanced SoCs that integrate processing power, connectivity, and sensor management to enhance user experience. The need for high-performance SoCs is fueled by consumer expectations for faster processing, better graphics, and longer battery life. Additionally, trends in miniaturization and the rise of Internet of Things (IoT) devices contribute to this segment's expansion. Companies like Qualcomm and Apple have introduced new SoCs, including the Snapdragon 8 Gen 2 and M2 chip, which focus on machine learning and graphics improvements, catering to the demand for immersive experiences.
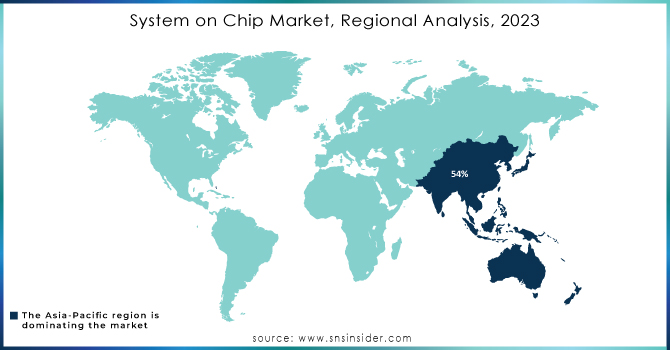
In 2023, the Asia-Pacific region emerged as a leader in the System on Chip (SoC) market, commanding approximately 54% of global revenue. This dominance stems from a surge in demand for electronic devices across multiple sectors, including consumer electronics, automotive, and telecommunications. Key semiconductor manufacturers in China, South Korea, Japan, and Taiwan have played a pivotal role in this growth, leveraging their advanced manufacturing capabilities and innovative technologies. Recent product launches highlight this trend; for example, Samsung introduced the Exynos 2200 SoC, designed for high-end smartphones and gaming devices, featuring advanced graphics and enhanced AI performance. MediaTek also made headlines with its Dimensity 9200 chip, aimed at flagship smartphones and optimized for AI applications and battery efficiency. Moreover, Qualcomm has solidified its presence in the region through collaborations with companies like Xiaomi and Oppo to integrate its Snapdragon chips into new devices.
In 2023, the North American System on Chips (SoC) market experienced notable growth, driven by advancements in technology and a focus on autonomous driving and advanced driver-assistance systems (ADAS). Key players such as Qualcomm, NVIDIA, and Intel are instrumental in this evolution, particularly within the automotive sector, where SoCs are integrated into ADAS and infotainment systems. The healthcare industry also shows increased adoption of SoCs for remote monitoring and wearable devices. Recent developments include Global Foundries' partnership with Microchip Technology on advanced memory solutions, Intel's innovations in high-performance computing, and NVIDIA's expansion in AI-driven automotive SoCs.
Intel Corporation (Meteor Lake SoCs, Intel Core processors)
Qualcomm Technologies, Inc. (Snapdragon processors, Snapdragon Ride™ Flex SoC)
Samsung Electronics Co., Ltd. (Exynos processors, Exynos ModAP)
NVIDIA Corporation (Tegra processors, Orin SoC)
Texas Instruments Incorporated (Sitara processors, Jacinto SoCs)
Broadcom Inc. (BCM series SoCs, StrataGX SoCs)
MediaTek Inc. (Dimensity processors, Helio series)
MaxLinear, Inc. (MXL17xxx series, Sierra platform)
Apple Inc. (Apple Silicon M-series, A-series chips)
Advanced Micro Devices, Inc. (AMD) (Ryzen Embedded, EPYC SoCs)
ARM Holdings (SoftBank Group) (Cortex series, Neoverse processors)
STMicroelectronics (STM32 microcontrollers, STR9 series)
Infineon Technologies AG (AURIX microcontrollers, XMC series)
ON Semiconductor Corporation (RSLK series SoCs, image sensors)
NXP Semiconductors N.V. (i.MX series, Layerscape SoCs)
Renesas Electronics Corporation (RZ/A series, RX microcontrollers)
Marvell Technology Group Ltd. (ThunderX processors, Armada SoCs)
Xilinx, Inc. (now part of AMD) (Zynq UltraScale+, Versal SoCs)
Siemens AG (Mentor Graphics)(Veloce emulation solutions, various ASIC designs)
Dialog Semiconductor (DA14531, DA1469x series)
List of suppliers of raw materials used in chip manufacturing, particularly for semiconductor and System-on-Chip (SoC) production:
SUMCO Corporation
Siltronic AG
Shin-Etsu Chemical Co., Ltd.
Chemical Suppliers
BASF SE (Photoresists, specialty chemicals)
Dow Inc. (Silicones, encapsulants)
Merck KGaA (Chemicals for semiconductor fabrication)
Cabot Microelectronics Corporation (Chemical Mechanical Planarization (CMP) slurries)
Metal Suppliers
Albemarle Corporation (Gallium, lithium, and specialty metals)
KMG Chemicals, Inc. (Chemicals and materials for electronic applications)
Heraeus Holding GmbH (Precious metals and materials for electronics)
Substrate Suppliers
NTT Advanced Technology Corporation (Wafer and substrate materials)
Kyocera Corporation (Ceramic substrates for electronic applications)
Epoxy and Adhesive Suppliers
Henkel AG & Co. KGaA (Adhesives and encapsulants for semiconductors)
3M Company (Adhesive solutions for electronic components)
Gas Suppliers
Air Products and Chemicals, Inc. (Specialty gases for semiconductor manufacturing)
Linde plc (Industrial gases for electronics and semiconductor processes)
In June 2024, Intel Corporation announced its upcoming processor series, featuring significant enhancements over the Meteor Lake SoCs, including improved power efficiency, a fourfold increase in NPU processing capability, and a 50% faster Intel Arc GPU using the next-gen Arc Battlemage architecture, alongside integrated on-chip memory for a more compact design.
In February 2024, MaxLinear, Inc. launched the MXL17xxx series, known as the 'Sierra' platform, designed for 4G/5G radio units in O-RAN, offering a versatile, all-in-one solution for various RU applications.
In January 2024, Robert Bosch GmbH and Qualcomm Technologies, Inc. revealed a vehicle computer combining infotainment and ADAS features within a single SoC, powered by the Snapdragon Ride™ Flex SoC as part of their ongoing collaboration in software-defined vehicle solutions.
Report Attributes | Details |
---|---|
Market Size in 2023 | USD 157.67 Billion |
Market Size by 2032 | USD 311.84 Billion |
CAGR | CAGR of 7.87% From 2024 to 2032 |
Base Year | 2023 |
Forecast Period | 2024-2032 |
Historical Data | 2020-2022 |
Report Scope & Coverage | Market Size, Segments Analysis, Competitive Landscape, Regional Analysis, DROC & SWOT Analysis, Forecast Outlook |
Key Segments | • By Type (Digital, Mixed, Analog) • By Applications (Home Appliance, ADAS System) • By End Use (Consumer Electronics, Automotive and Transportation, IT & Telecommunication, Aerospace & Defense, Healthcare, Power & Utility, Others) |
Regional Analysis/Coverage | North America (US, Canada, Mexico), Europe (Eastern Europe [Poland, Romania, Hungary, Turkey, Rest of Eastern Europe] Western Europe [Germany, France, UK, Italy, Spain, Netherlands, Switzerland, Austria, Rest of Western Europe]), Asia-Pacific (China, India, Japan, South Korea, Vietnam, Singapore, Australia, Rest of Asia-Pacific), Middle East & Africa (Middle East [UAE, Egypt, Saudi Arabia, Qatar, Rest of Middle East], Africa [Nigeria, South Africa, Rest of Africa], Latin America (Brazil, Argentina, Colombia, Rest of Latin America) |
Company Profiles | Intel Corporation, Qualcomm Technologies, Inc., Samsung Electronics Co., Ltd., NVIDIA Corporation, Texas Instruments Incorporated, Broadcom Inc., MediaTek Inc., MaxLinear, Inc., Apple Inc., Advanced Micro Devices, Inc. (AMD), ARM Holdings (SoftBank Group), STMicroelectronics, Infineon Technologies AG, ON Semiconductor Corporation, NXP Semiconductors N.V., Renesas Electronics Corporation, Marvell Technology Group Ltd., Xilinx, Inc. (now part of AMD), Siemens AG (Mentor Graphics), and Dialog Semiconductor. |
Key Drivers | • A major factor driving the growth of the system-on-chip (SoC) market is the significant enhancement in performance and efficiency. |
RESTRAINTS | • Design Complexity and High Development Costs Key Restraints in System-on-Chip (SoC) Market Expansion |
Ans: - The System on Chip Market size was valued at USD 157.67 Billion in 2023 and is expected to reach USD 311.84 Billion by 2032 and grow at a CAGR of 7.87% over the forecast period 2024-2032.
Ans: System on Chip Market grow at a CAGR of 7.87% over the forecast period 2024-2032.
Ans: The most significant restraining factor for the global System on Chip (SoC) market is the complex design and integration processes that lead to longer development cycles and higher costs, particularly affecting smaller firms' ability to compete effectively
Ans: North America is dominating in System on Chip Market in 2023
Ans: Digital is dominating segment in System on Chip Market in 2023
Table of Content
1. Introduction
1.1 Market Definition
1.2 Scope (Inclusion and Exclusions)
1.3 Research Assumptions
2. Executive Summary
2.1 Market Overview
2.2 Regional Synopsis
2.3 Competitive Summary
3. Research Methodology
3.1 Top-Down Approach
3.2 Bottom-up Approach
3.3. Data Validation
3.4 Primary Interviews
4. Market Dynamics Impact Analysis
4.1 Market Driving Factors Analysis
4.1.1 Drivers
4.1.2 Restraints
4.1.3 Opportunities
4.1.4 Challenges
4.2 PESTLE Analysis
4.3 Porter’s Five Forces Model
5. Statistical Insights and Trends Reporting
5.1 Production Capacity and Utilization Analysis by Region
5.2 Feedstock Prices Analysis by Region
5.3 Regulatory Impact: Effects of regulations on production and usage.
5.4 Environmental Metrics Analysis by Region
5.5 Innovation and R&D
6. Competitive Landscape
6.1 List of Major Companies, By Region
6.2 Market Share Analysis, By Region
6.3 Product Benchmarking
6.3.1 Product specifications and features
6.3.2 Pricing
6.4 Strategic Initiatives
6.4.1 Marketing and promotional activities
6.4.2 Distribution and supply chain strategies
6.4.3 Expansion plans and new product launches
6.4.4 Strategic partnerships and collaborations
6.5 Technological Advancements
6.6 Market Positioning and Branding
7. System on Chip Market Segmentation, by Type
7.1 Chapter Overview
7.2 Digital
7.2.1 Digital Market Trends Analysis (2020-2032)
7.2.2 Digital Market Size Estimates and Forecasts to 2032 (USD Billion )
7.3 Mixed
7.3.1 Mixed Market Trends Analysis (2020-2032)
7.3.2 Mixed Market Size Estimates and Forecasts to 2032 (USD Billion )
7.4 Analog
7.4.1 Analog Market Trends Analysis (2020-2032)
7.4.2 Analog Market Size Estimates and Forecasts to 2032 (USD Billion )
8. System on Chip Market Segmentation, by Application
8.1 Chapter Overview
8.2 Home Appliance
8.2.1 Home Appliance Market Trends Analysis (2020-2032)
8.2.2 Home Appliance Market Size Estimates and Forecasts to 2032 (USD Billion )
8.3 Portable Electronic Device
8.3.1 Portable Electronic Device Market Trends Analysis (2020-2032)
8.3.2 Portable Electronic Device Market Size Estimates and Forecasts to 2032 (USD Billion )
8.4 ADAS System
8.4.1 ADAS System Market Trends Analysis (2020-2032)
8.4.2 ADAS System Market Size Estimates and Forecasts to 2032 (USD Billion )
8.5 Medical Device
8.5.1 Medical Device Market Trends Analysis (2020-2032)
8.5.2 Medical Device Market Size Estimates and Forecasts to 2032 (USD Billion )
8.6 RF Device
8.6.1 RF Device Market Trends Analysis (2020-2032)
8.6.2 RF Device Market Size Estimates and Forecasts to 2032 (USD Billion )
8.7 Power Electronic Device
8.7.1 Power Electronic Device Market Trends Analysis (2020-2032)
8.7.2 Power Electronic Device Market Size Estimates and Forecasts to 2032 (USD Billion )
8.8 Wired & Wireless Communication Device
8.8.1 Wired & Wireless Communication Device Market Trends Analysis (2020-2032)
8.8.2 Wired & Wireless Communication Device Market Size Estimates and Forecasts to 2032 (USD Billion )
8.9 Others
8.9.1 Others Market Trends Analysis (2020-2032)
8.9.2 Others Market Size Estimates and Forecasts to 2032 (USD Billion )
9. System on Chip Market Segmentation, by End Use
9.1 Chapter Overview
9.2 Consumer Electronics
9.2.1 Consumer Electronics Market Trends Analysis (2020-2032)
9.2.2 Consumer Electronics Market Size Estimates and Forecasts to 2032 (USD Billion )
9.3 Automotive and Transportation
9.3.1 Automotive and Transportation Market Trends Analysis (2020-2032)
9.3.2 Automotive and Transportation Market Size Estimates and Forecasts to 2032 (USD Billion )
9.4 IT & Telecommunication
9.4.1 IT & Telecommunication Market Trends Analysis (2020-2032)
9.4.2 IT & Telecommunication Market Size Estimates and Forecasts to 2032 (USD Billion )
9.5 Aerospace & Defense
9.5.1 Aerospace & Defense Market Trends Analysis (2020-2032)
9.5.2 Aerospace & Defense Market Size Estimates and Forecasts to 2032 (USD Billion )
9.6 Healthcare
9.6.1 Healthcare Market Trends Analysis (2020-2032)
9.6.2 Healthcare Market Size Estimates and Forecasts to 2032 (USD Billion )
9.7 Power & Utility
9.7.1 Power & Utility Market Trends Analysis (2020-2032)
9.7.2 Power & Utility Market Size Estimates and Forecasts to 2032 (USD Billion )
9.8 Others
9.8.1 Others Market Trends Analysis (2020-2032)
9.8.2 Others Market Size Estimates and Forecasts to 2032 (USD Billion )
10. Regional Analysis
10.1 Chapter Overview
10.2 North America
10.2.1 Trends Analysis
10.2.2 North America System on Chip Market Estimates and Forecasts, by Country (2020-2032) (USD Billion )
10.2.3 North America System on Chip Market Estimates and Forecasts, by Type (2020-2032) (USD Billion )
10.2.4 North America System on Chip Market Estimates and Forecasts, by Application (2020-2032) (USD Billion )
10.2.5 North America System on Chip Market Estimates and Forecasts, by End Use (2020-2032) (USD Billion )
10.2.6 USA
10.2.6.1 USA System on Chip Market Estimates and Forecasts, by Type (2020-2032) (USD Billion )
10.2.6.2 USA System on Chip Market Estimates and Forecasts, by Application (2020-2032) (USD Billion )
10.2.6.3 USA System on Chip Market Estimates and Forecasts, by End Use (2020-2032) (USD Billion )
10.2.7 Canada
10.2.7.1 Canada System on Chip Market Estimates and Forecasts, by Type (2020-2032) (USD Billion )
10.2.7.2 Canada System on Chip Market Estimates and Forecasts, by Application (2020-2032) (USD Billion )
10.2.7.3 Canada System on Chip Market Estimates and Forecasts, by End Use (2020-2032) (USD Billion )
10.2.8 Mexico
10.2.8.1 Mexico System on Chip Market Estimates and Forecasts, by Type (2020-2032) (USD Billion )
10.2.8.2 Mexico System on Chip Market Estimates and Forecasts, by Application (2020-2032) (USD Billion )
10.2.8.3 Mexico System on Chip Market Estimates and Forecasts, by End Use (2020-2032) (USD Billion )
10.3 Europe
10.3.1 Eastern Europe
10.3.1.1 Trends Analysis
10.3.1.2 Eastern Europe System on Chip Market Estimates and Forecasts, by Country (2020-2032) (USD Billion )
10.3.1.3 Eastern Europe System on Chip Market Estimates and Forecasts, by Type (2020-2032) (USD Billion )
10.3.1.4 Eastern Europe System on Chip Market Estimates and Forecasts, by Application (2020-2032) (USD Billion )
10.3.1.5 Eastern Europe System on Chip Market Estimates and Forecasts, by End Use (2020-2032) (USD Billion )
10.3.1.6 Poland
10.3.1.6.1 Poland System on Chip Market Estimates and Forecasts, by Type (2020-2032) (USD Billion )
10.3.1.6.2 Poland System on Chip Market Estimates and Forecasts, by Application (2020-2032) (USD Billion )
10.3.1.6.3 Poland System on Chip Market Estimates and Forecasts, by End Use (2020-2032) (USD Billion )
10.3.1.7 Romania
10.3.1.7.1 Romania System on Chip Market Estimates and Forecasts, by Type (2020-2032) (USD Billion )
10.3.1.7.2 Romania System on Chip Market Estimates and Forecasts, by Application (2020-2032) (USD Billion )
10.3.1.7.3 Romania System on Chip Market Estimates and Forecasts, by End Use (2020-2032) (USD Billion )
10.3.1.8 Hungary
10.3.1.8.1 Hungary System on Chip Market Estimates and Forecasts, by Type (2020-2032) (USD Billion )
10.3.1.8.2 Hungary System on Chip Market Estimates and Forecasts, by Application (2020-2032) (USD Billion )
10.3.1.8.3 Hungary System on Chip Market Estimates and Forecasts, by End Use (2020-2032) (USD Billion )
10.3.1.9 Turkey
10.3.1.9.1 Turkey System on Chip Market Estimates and Forecasts, by Type (2020-2032) (USD Billion )
10.3.1.9.2 Turkey System on Chip Market Estimates and Forecasts, by Application (2020-2032) (USD Billion )
10.3.1.9.3 Turkey System on Chip Market Estimates and Forecasts, by End Use (2020-2032) (USD Billion )
10.3.1.10 Rest of Eastern Europe
10.3.1.10.1 Rest of Eastern Europe System on Chip Market Estimates and Forecasts, by Type (2020-2032) (USD Billion )
10.3.1.10.2 Rest of Eastern Europe System on Chip Market Estimates and Forecasts, by Application (2020-2032) (USD Billion )
10.3.1.10.3 Rest of Eastern Europe System on Chip Market Estimates and Forecasts, by End Use (2020-2032) (USD Billion )
10.3.2 Western Europe
10.3.2.1 Trends Analysis
10.3.2.2 Western Europe System on Chip Market Estimates and Forecasts, by Country (2020-2032) (USD Billion )
10.3.2.3 Western Europe System on Chip Market Estimates and Forecasts, by Type (2020-2032) (USD Billion )
10.3.2.4 Western Europe System on Chip Market Estimates and Forecasts, by Application (2020-2032) (USD Billion )
10.3.2.5 Western Europe System on Chip Market Estimates and Forecasts, by End Use (2020-2032) (USD Billion )
10.3.2.6 Germany
10.3.2.6.1 Germany System on Chip Market Estimates and Forecasts, by Type (2020-2032) (USD Billion )
10.3.2.6.2 Germany System on Chip Market Estimates and Forecasts, by Application (2020-2032) (USD Billion )
10.3.2.6.3 Germany System on Chip Market Estimates and Forecasts, by End Use (2020-2032) (USD Billion )
10.3.2.7 France
10.3.2.7.1 France System on Chip Market Estimates and Forecasts, by Type (2020-2032) (USD Billion )
10.3.2.7.2 France System on Chip Market Estimates and Forecasts, by Application (2020-2032) (USD Billion )
10.3.2.7.3 France System on Chip Market Estimates and Forecasts, by End Use (2020-2032) (USD Billion )
10.3.2.8 UK
10.3.2.8.1 UK System on Chip Market Estimates and Forecasts, by Type (2020-2032) (USD Billion )
10.3.2.8.2 UK System on Chip Market Estimates and Forecasts, by Application (2020-2032) (USD Billion )
10.3.2.8.3 UK System on Chip Market Estimates and Forecasts, by End Use (2020-2032) (USD Billion )
10.3.2.9 Italy
10.3.2.9.1 Italy System on Chip Market Estimates and Forecasts, by Type (2020-2032) (USD Billion )
10.3.2.9.2 Italy System on Chip Market Estimates and Forecasts, by Application (2020-2032) (USD Billion )
10.3.2.9.3 Italy System on Chip Market Estimates and Forecasts, by End Use (2020-2032) (USD Billion )
10.3.2.10 Spain
10.3.2.10.1 Spain System on Chip Market Estimates and Forecasts, by Type (2020-2032) (USD Billion )
10.3.2.10.2 Spain System on Chip Market Estimates and Forecasts, by Application (2020-2032) (USD Billion )
10.3.2.10.3 Spain System on Chip Market Estimates and Forecasts, by End Use (2020-2032) (USD Billion )
10.3.2.11 Netherlands
10.3.2.11.1 Netherlands System on Chip Market Estimates and Forecasts, by Type (2020-2032) (USD Billion )
10.3.2.11.2 Netherlands System on Chip Market Estimates and Forecasts, by Application (2020-2032) (USD Billion )
10.3.2.11.3 Netherlands System on Chip Market Estimates and Forecasts, by End Use (2020-2032) (USD Billion )
10.3.2.12 Switzerland
10.3.2.12.1 Switzerland System on Chip Market Estimates and Forecasts, by Type (2020-2032) (USD Billion )
10.3.2.12.2 Switzerland System on Chip Market Estimates and Forecasts, by Application (2020-2032) (USD Billion )
10.3.2.12.3 Switzerland System on Chip Market Estimates and Forecasts, by End Use (2020-2032) (USD Billion )
10.3.2.13 Austria
10.3.2.13.1 Austria System on Chip Market Estimates and Forecasts, by Type (2020-2032) (USD Billion )
10.3.2.13.2 Austria System on Chip Market Estimates and Forecasts, by Application (2020-2032) (USD Billion )
10.3.2.13.3 Austria System on Chip Market Estimates and Forecasts, by End Use (2020-2032) (USD Billion )
10.3.2.14 Rest of Western Europe
10.3.2.14.1 Rest of Western Europe System on Chip Market Estimates and Forecasts, by Type (2020-2032) (USD Billion )
10.3.2.14.2 Rest of Western Europe System on Chip Market Estimates and Forecasts, by Application (2020-2032) (USD Billion )
10.3.2.14.3 Rest of Western Europe System on Chip Market Estimates and Forecasts, by End Use (2020-2032) (USD Billion )
10.4 Asia-Pacific
10.4.1 Trends Analysis
10.4.2 Asia-Pacific System on Chip Market Estimates and Forecasts, by Country (2020-2032) (USD Billion )
10.4.3 Asia-Pacific System on Chip Market Estimates and Forecasts, by Type (2020-2032) (USD Billion )
10.4.4 Asia-Pacific System on Chip Market Estimates and Forecasts, by Application (2020-2032) (USD Billion )
10.4.5 Asia-Pacific System on Chip Market Estimates and Forecasts, by End Use (2020-2032) (USD Billion )
10.4.6 China
10.4.6.1 China System on Chip Market Estimates and Forecasts, by Type (2020-2032) (USD Billion )
10.4.6.2 China System on Chip Market Estimates and Forecasts, by Application (2020-2032) (USD Billion )
10.4.6.3 China System on Chip Market Estimates and Forecasts, by End Use (2020-2032) (USD Billion )
10.4.7 India
10.4.7.1 India System on Chip Market Estimates and Forecasts, by Type (2020-2032) (USD Billion )
10.4.7.2 India System on Chip Market Estimates and Forecasts, by Application (2020-2032) (USD Billion )
10.4.7.3 India System on Chip Market Estimates and Forecasts, by End Use (2020-2032) (USD Billion )
10.4.8 Japan
10.4.8.1 Japan System on Chip Market Estimates and Forecasts, by Type (2020-2032) (USD Billion )
10.4.8.2 Japan System on Chip Market Estimates and Forecasts, by Application (2020-2032) (USD Billion )
10.4.8.3 Japan System on Chip Market Estimates and Forecasts, by End Use (2020-2032) (USD Billion )
10.4.9 South Korea
10.4.9.1 South Korea System on Chip Market Estimates and Forecasts, by Type (2020-2032) (USD Billion )
10.4.9.2 South Korea System on Chip Market Estimates and Forecasts, by Application (2020-2032) (USD Billion )
10.4.9.3 South Korea System on Chip Market Estimates and Forecasts, by End Use (2020-2032) (USD Billion )
10.4.10 Vietnam
10.4.10.1 Vietnam System on Chip Market Estimates and Forecasts, by Type (2020-2032) (USD Billion )
10.4.10.2 Vietnam System on Chip Market Estimates and Forecasts, by Application (2020-2032) (USD Billion )
10.4.10.3 Vietnam System on Chip Market Estimates and Forecasts, by End Use (2020-2032) (USD Billion )
10.4.11 Singapore
10.4.11.1 Singapore System on Chip Market Estimates and Forecasts, by Type (2020-2032) (USD Billion )
10.4.11.2 Singapore System on Chip Market Estimates and Forecasts, by Application (2020-2032) (USD Billion )
10.4.11.3 Singapore System on Chip Market Estimates and Forecasts, by End Use (2020-2032) (USD Billion )
10.4.12 Australia
10.4.12.1 Australia System on Chip Market Estimates and Forecasts, by Type (2020-2032) (USD Billion )
10.4.12.2 Australia System on Chip Market Estimates and Forecasts, by Application (2020-2032) (USD Billion )
10.4.12.3 Australia System on Chip Market Estimates and Forecasts, by End Use (2020-2032) (USD Billion )
10.4.13 Rest of Asia-Pacific
10.4.13.1 Rest of Asia-Pacific System on Chip Market Estimates and Forecasts, by Type (2020-2032) (USD Billion )
10.4.13.2 Rest of Asia-Pacific System on Chip Market Estimates and Forecasts, by Application (2020-2032) (USD Billion )
10.4.13.3 Rest of Asia-Pacific System on Chip Market Estimates and Forecasts, by End Use (2020-2032) (USD Billion )
10.5 Middle East and Africa
10.5.1 Middle East
10.5.1.1 Trends Analysis
10.5.1.2 Middle East System on Chip Market Estimates and Forecasts, by Country (2020-2032) (USD Billion )
10.5.1.3 Middle East System on Chip Market Estimates and Forecasts, by Type (2020-2032) (USD Billion )
10.5.1.4 Middle East System on Chip Market Estimates and Forecasts, by Application (2020-2032) (USD Billion )
10.5.1.5 Middle East System on Chip Market Estimates and Forecasts, by End Use (2020-2032) (USD Billion )
10.5.1.6 UAE
10.5.1.6.1 UAE System on Chip Market Estimates and Forecasts, by Type (2020-2032) (USD Billion )
10.5.1.6.2 UAE System on Chip Market Estimates and Forecasts, by Application (2020-2032) (USD Billion )
10.5.1.6.3 UAE System on Chip Market Estimates and Forecasts, by End Use (2020-2032) (USD Billion )
10.5.1.7 Egypt
10.5.1.7.1 Egypt System on Chip Market Estimates and Forecasts, by Type (2020-2032) (USD Billion )
10.5.1.7.2 Egypt System on Chip Market Estimates and Forecasts, by Application (2020-2032) (USD Billion )
10.5.1.7.3 Egypt System on Chip Market Estimates and Forecasts, by End Use (2020-2032) (USD Billion )
10.5.1.8 Saudi Arabia
10.5.1.8.1 Saudi Arabia System on Chip Market Estimates and Forecasts, by Type (2020-2032) (USD Billion )
10.5.1.8.2 Saudi Arabia System on Chip Market Estimates and Forecasts, by Application (2020-2032) (USD Billion )
10.5.1.8.3 Saudi Arabia System on Chip Market Estimates and Forecasts, by End Use (2020-2032) (USD Billion )
10.5.1.9 Qatar
10.5.1.9.1 Qatar System on Chip Market Estimates and Forecasts, by Type (2020-2032) (USD Billion )
10.5.1.9.2 Qatar System on Chip Market Estimates and Forecasts, by Application (2020-2032) (USD Billion )
10.5.1.9.3 Qatar System on Chip Market Estimates and Forecasts, by End Use (2020-2032) (USD Billion )
10.5.1.10 Rest of Middle East
10.5.1.10.1 Rest of Middle East System on Chip Market Estimates and Forecasts, by Type (2020-2032) (USD Billion )
10.5.1.10.2 Rest of Middle East System on Chip Market Estimates and Forecasts, by Application (2020-2032) (USD Billion )
10.5.1.10.3 Rest of Middle East System on Chip Market Estimates and Forecasts, by End Use (2020-2032) (USD Billion )
10.5.2 Africa
10.5.2.1 Trends Analysis
10.5.2.2 Africa System on Chip Market Estimates and Forecasts, by Country (2020-2032) (USD Billion )
10.5.2.3 Africa System on Chip Market Estimates and Forecasts, by Type (2020-2032) (USD Billion )
10.5.2.4 Africa System on Chip Market Estimates and Forecasts, by Application (2020-2032) (USD Billion )
10.5.2.5 Africa System on Chip Market Estimates and Forecasts, by End Use (2020-2032) (USD Billion )
10.5.2.6 South Africa
10.5.2.6.1 South Africa System on Chip Market Estimates and Forecasts, by Type (2020-2032) (USD Billion )
10.5.2.6.2 South Africa System on Chip Market Estimates and Forecasts, by Application (2020-2032) (USD Billion )
10.5.2.6.3 South Africa System on Chip Market Estimates and Forecasts, by End Use (2020-2032) (USD Billion )
10.5.2.7 Nigeria
10.5.2.7.1 Nigeria System on Chip Market Estimates and Forecasts, by Type (2020-2032) (USD Billion )
10.5.2.7.2 Nigeria System on Chip Market Estimates and Forecasts, by Application (2020-2032) (USD Billion )
10.5.2.7.3 Nigeria System on Chip Market Estimates and Forecasts, by End Use (2020-2032) (USD Billion )
10.5.2.8 Rest of Africa
10.5.2.8.1 Rest of Africa System on Chip Market Estimates and Forecasts, by Type (2020-2032) (USD Billion )
10.5.2.8.2 Rest of Africa System on Chip Market Estimates and Forecasts, by Application (2020-2032) (USD Billion )
10.5.2.8.3 Rest of Africa System on Chip Market Estimates and Forecasts, by End Use (2020-2032) (USD Billion )
10.6 Latin America
10.6.1 Trends Analysis
10.6.2 Latin America System on Chip Market Estimates and Forecasts, by Country (2020-2032) (USD Billion )
10.6.3 Latin America System on Chip Market Estimates and Forecasts, by Type (2020-2032) (USD Billion )
10.6.4 Latin America System on Chip Market Estimates and Forecasts, by Application (2020-2032) (USD Billion )
10.6.5 Latin America System on Chip Market Estimates and Forecasts, by End Use (2020-2032) (USD Billion )
10.6.6 Brazil
10.6.6.1 Brazil System on Chip Market Estimates and Forecasts, by Type (2020-2032) (USD Billion )
10.6.6.2 Brazil System on Chip Market Estimates and Forecasts, by Application (2020-2032) (USD Billion )
10.6.6.3 Brazil System on Chip Market Estimates and Forecasts, by End Use (2020-2032) (USD Billion )
10.6.7 Argentina
10.6.7.1 Argentina System on Chip Market Estimates and Forecasts, by Type (2020-2032) (USD Billion )
10.6.7.2 Argentina System on Chip Market Estimates and Forecasts, by Application (2020-2032) (USD Billion )
10.6.7.3 Argentina System on Chip Market Estimates and Forecasts, by End Use (2020-2032) (USD Billion )
10.6.8 Colombia
10.6.8.1 Colombia System on Chip Market Estimates and Forecasts, by Type (2020-2032) (USD Billion )
10.6.8.2 Colombia System on Chip Market Estimates and Forecasts, by Application (2020-2032) (USD Billion )
10.6.8.3 Colombia System on Chip Market Estimates and Forecasts, by End Use (2020-2032) (USD Billion )
10.6.9 Rest of Latin America
10.6.9.1 Rest of Latin America System on Chip Market Estimates and Forecasts, by Type (2020-2032) (USD Billion )
10.6.9.2 Rest of Latin America System on Chip Market Estimates and Forecasts, by Application (2020-2032) (USD Billion )
10.6.9.3 Rest of Latin America System on Chip Market Estimates and Forecasts, by End Use (2020-2032) (USD Billion )
11. Company Profiles
11.1 Intel Corporation
11.1.1 Company Overview
11.1.2 Financial
11.1.3 Products/ Services Offered
11.1.4 SWOT Analysis
11.2 Qualcomm Technologies, Inc.
11.2.1 Company Overview
11.2.2 Financial
11.2.3 Products/ Services Offered
11.2.4 SWOT Analysis
11.3 Samsung Electronics Co., Ltd.
11.3.1 Company Overview
11.3.2 Financial
11.3.3 Products/ Services Offered
11.3.4 SWOT Analysis
11.4 NVIDIA Corporation
11.4.1 Company Overview
11.4.2 Financial
11.4.3 Products/ Services Offered
11.4.4 SWOT Analysis
11.5 Texas Instruments Incorporated
11.5.1 Company Overview
11.5.2 Financial
11.5.3 Products/ Services Offered
11.5.4 SWOT Analysis
11.6 Broadcom Inc.
11.6.1 Company Overview
11.6.2 Financial
11.6.3 Products/ Services Offered
11.6.4 SWOT Analysis
11.7 MediaTek Inc.
11.7.1 Company Overview
11.7.2 Financial
11.7.3 Products/ Services Offered
11.7.4 SWOT Analysis
11.8 MaxLinear, Inc.
11.8.1 Company Overview
11.8.2 Financial
11.8.3 Products/ Services Offered
11.8.4 SWOT Analysis
11.9 Apple Inc.
11.9.1 Company Overview
11.9.2 Financial
11.9.3 Products/ Services Offered
11.9.4 SWOT Analysis
11.10 Advanced Micro Devices, Inc. (AMD)
11.10.1 Company Overview
11.10.2 Financial
11.10.3 Products/ Services Offered
11.10.4 SWOT Analysis
12. Use Cases and Best Practices
13. Conclusion
An accurate research report requires proper strategizing as well as implementation. There are multiple factors involved in the completion of good and accurate research report and selecting the best methodology to compete the research is the toughest part. Since the research reports we provide play a crucial role in any company’s decision-making process, therefore we at SNS Insider always believe that we should choose the best method which gives us results closer to reality. This allows us to reach at a stage wherein we can provide our clients best and accurate investment to output ratio.
Each report that we prepare takes a timeframe of 350-400 business hours for production. Starting from the selection of titles through a couple of in-depth brain storming session to the final QC process before uploading our titles on our website we dedicate around 350 working hours. The titles are selected based on their current market cap and the foreseen CAGR and growth.
The 5 steps process:
Step 1: Secondary Research:
Secondary Research or Desk Research is as the name suggests is a research process wherein, we collect data through the readily available information. In this process we use various paid and unpaid databases which our team has access to and gather data through the same. This includes examining of listed companies’ annual reports, Journals, SEC filling etc. Apart from this our team has access to various associations across the globe across different industries. Lastly, we have exchange relationships with various university as well as individual libraries.
Step 2: Primary Research
When we talk about primary research, it is a type of study in which the researchers collect relevant data samples directly, rather than relying on previously collected data. This type of research is focused on gaining content specific facts that can be sued to solve specific problems. Since the collected data is fresh and first hand therefore it makes the study more accurate and genuine.
We at SNS Insider have divided Primary Research into 2 parts.
Part 1 wherein we interview the KOLs of major players as well as the upcoming ones across various geographic regions. This allows us to have their view over the market scenario and acts as an important tool to come closer to the accurate market numbers. As many as 45 paid and unpaid primary interviews are taken from both the demand and supply side of the industry to make sure we land at an accurate judgement and analysis of the market.
This step involves the triangulation of data wherein our team analyses the interview transcripts, online survey responses and observation of on filed participants. The below mentioned chart should give a better understanding of the part 1 of the primary interview.
Part 2: In this part of primary research the data collected via secondary research and the part 1 of the primary research is validated with the interviews from individual consultants and subject matter experts.
Consultants are those set of people who have at least 12 years of experience and expertise within the industry whereas Subject Matter Experts are those with at least 15 years of experience behind their back within the same space. The data with the help of two main processes i.e., FGDs (Focused Group Discussions) and IDs (Individual Discussions). This gives us a 3rd party nonbiased primary view of the market scenario making it a more dependable one while collation of the data pointers.
Step 3: Data Bank Validation
Once all the information is collected via primary and secondary sources, we run that information for data validation. At our intelligence centre our research heads track a lot of information related to the market which includes the quarterly reports, the daily stock prices, and other relevant information. Our data bank server gets updated every fortnight and that is how the information which we collected using our primary and secondary information is revalidated in real time.
Step 4: QA/QC Process
After all the data collection and validation our team does a final level of quality check and quality assurance to get rid of any unwanted or undesired mistakes. This might include but not limited to getting rid of the any typos, duplication of numbers or missing of any important information. The people involved in this process include technical content writers, research heads and graphics people. Once this process is completed the title gets uploader on our platform for our clients to read it.
Step 5: Final QC/QA Process:
This is the last process and comes when the client has ordered the study. In this process a final QA/QC is done before the study is emailed to the client. Since we believe in giving our clients a good experience of our research studies, therefore, to make sure that we do not lack at our end in any way humanly possible we do a final round of quality check and then dispatch the study to the client.
Key Segments:
By Type
Digital
Mixed
Analog
By Application
Home Appliance
Portable Electronic Device
ADAS System
Medical Device
RF Device
Power Electronic Device
Wired & Wireless Communication Device
Others
By End Use
Consumer Electronics
Automotive and Transportation
IT & Telecommunication
Aerospace & Defense
Healthcare
Power & Utility
Others
Request for Segment Customization as per your Business Requirement: Segment Customization Request
REGIONAL COVERAGE:
North America
US
Canada
Mexico
Europe
Eastern Europe
Poland
Romania
Hungary
Turkey
Rest of Eastern Europe
Western Europe
Germany
France
UK
Italy
Spain
Netherlands
Switzerland
Austria
Rest of Western Europe
Asia-Pacific
China
India
Japan
South Korea
Vietnam
Singapore
Australia
Rest of Asia Pacific
Middle East & Africa
Middle East
UAE
Egypt
Saudi Arabia
Qatar
Rest of the Middle East
Africa
Nigeria
South Africa
Rest of Africa
Latin America
Brazil
Argentina
Colombia
Rest of Latin America
Request for Country Level Research Report: Country Level Customization Request
Available Customization
With the given market data, SNS Insider offers customization as per the company’s specific needs. The following customization options are available for the report:
Product Analysis
Criss-Cross segment analysis (e.g. Product X Application)
Product Matrix which gives a detailed comparison of the product portfolio of each company
Geographic Analysis
Additional countries in any of the regions
Company Information
Detailed analysis and profiling of additional market players (Up to five)
The Capacitive Sensor market size was $ 30.62 Billion in 2023 & expects a good growth by reaching USD 49.06 billion till end of year2032 at CAGR about 5.43% during forecast period 2023-2032
The Battery Materials Market size was valued at USD 43.63 billion in 2023 and is expected to reach USD 89.27 billion by 2032, with growing at a CAGR of 8.31% over the forecast period 2024-2032.
The Smart Irrigation Controllers Market size was valued at $2.00 Billion in 2023 and is expected to reach $5.23 Billion at a CAGR of 11.30% by 2024 to 2032
RFID Tags Market Size was valued at USD 12.42 Billion in 2023 and is expected to reach USD 29.05 Billion by 2032 and grow at a CAGR of 9.91% over the forecast period 2024-2032.
Biometric Technology Market size was valued at USD 46.31 billion in 2023. It is expected to hit USD 248.49 billion by 2032 and grow at a CAGR of 20.53 % over the forecast period of 2024-2032.
The Passport Reader Market Size was valued at USD 0.37 Billion in 2023 and is expected to reach USD 0.97 Billion by 2032 and grow at a CAGR of 11.4% over the forecast period 2024-2032.
Hi! Click one of our member below to chat on Phone