Get more information on Synthetic Lubricants Market - Request Sample Report
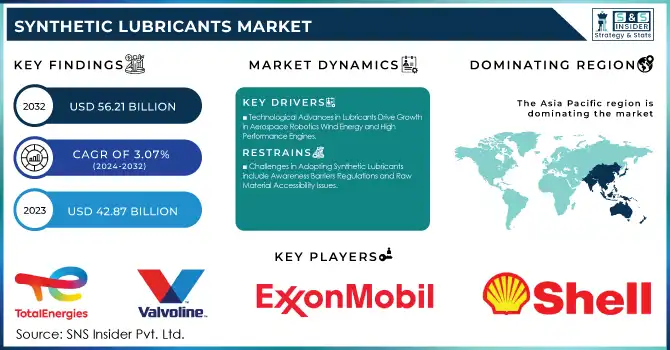
The Synthetic Lubricants Market was valued at USD 42.87 billion in 2023 and is expected to reach USD 56.21 Billion by 2032, growing at a CAGR of 3.07 % over the forecast period 2024-2032.
The global synthetic lubricants market share is primarily achieved due to the growing demand for high-performance lubricants along with enhanced efficiency, longer durability, and eco-friendly traits offered by these products. A major element in this is the increased emphasis on sustainability and carbon neutrality. Do not waste energy: Synthetic lubricants reduce waste and energy consumption compared to conventional lubricants, since they are stable at extreme temperatures and allow longer drain intervals. This makes them very enticing to sectors like automotive, aviation, and manufacturing that need to comply with strict environmental standards. Furthermore, the rise of electric vehicles (EVs) has led to the increased requirement for dedicated lubricants to fulfill distinct components of an EV such as e-transmissions and battery cooling systems. Compared to conventional oils, synthetic lubricants deliver up to 50% longer oil drain intervals and within many industrial applications, provide a 12% reduction in energy consumption. Expected to comprise 70% of new vehicle models in North America and Europe by 2024, they reduce greenhouse gas emissions by 30% or more. Global EV sales are expected to be up 35% year-on-year in 2024, supporting demand for new specialty lubricants like e-transmission fluids and battery coolants.
The other major growth factor includes the industrialization widespread and automation around the emerging economies. The demand for synthetic lubricants is attributable to the need for improved thermal stability, oxidation resistance, and longer service life, particularly for heavy machinery, robotics, and production equipment. Market growth is amplified by the energy-efficient solutions demand across power generation and rising applications in other industries such as construction and mining. In addition, sophisticated investment in research and development (R&D) for bio-based synthetic lubricants and government initiatives toward using green products will add new opportunities for growth in the coming years. These factors make a sure shot entry for synthetic lubricants into the market in the long run. Renewable generation capacity increased by 24.1 GW in 2023, and energy storage added a record 6.2 GW for the fourth year in a row. Fortescue Metals Group signed a USD 4.06 billion agreement to retrofit two-thirds of its mining fleet for zero-emissions battery technology, which includes 360 electric trucks and 55 electric excavators in the construction and mining industry. The clean energy jobs that increased in 2023 also counted 148,000 new jobs or 59% of new energy jobs from the U.S. Energy and Employment Report 2024.
KEY DRIVERS:
Technological developments in lubricant formulation are one of the major factors driving the synthetic lubricants market. Advancements in chemical engineering and molecular synthesis have led to advanced synthetic lubricants with higher viscosity index, oxidation resistance, and greater thermal stability. Such properties enable lubricants to function under high temperatures and heavy-load conditions, which are critical in industries such as aerospace, marine, and high-precision manufacturing. In addition, the rising demand for tailor-made and application-oriented lubricants in industrial robotics, wind energy, and advanced automotive engines has further contributed to the increase in R&D of the market. Nanotechnology-based lubricants with superior friction and wear properties are also anticipated to change the dynamics of the market by encouraging more adoption of synthetic lubricants in high-tech industries. By 2023, synthetic lubricants were lasting 3–4 times longer than their mineral oils counterparts, the aviation sector benefitted from this extended lifespan. More than 3 million industrial robots are in operation all over the globe and increasingly need specialized industrial lubricants. Wind energy has increased in turbine capacity by 12% which calls for high-performance lubricants for gearboxes. Friction in high-performance machines was reduced by 40% with nanotechnology lubricants. Consumer Vehicles Electric vehicles (EV) need oils that can endure 30% more thermal loads than conventional gasoline and diesel vehicles. In the marine industry, 10% of fuel use was reported with synthetic oils, and in high-performance automotive engines, specialized lubricants have enabled the handling of 40% higher stress.
Industrial automation along with smart manufacturing is one of the major drivers for the synthetic lubricants market. The growing trend of utilizing more automated systems, robotics, and Industry 4.0 machinery in factories around the globe has significantly increased the demand for high-performance lubricants that fulfill the requirements of extended service life and excellent protection against wear. Due to their continuous operation and high workload, automated machinery and smart production lines require lubricants that reduce downtime, reduce maintenance frequency, and improve usability efficiency. Used primarily to increase the length of an oil change interval and insulate machinery from damage, synthetic lubricants have become a must-have item for manufacturers looking to keep production running without interruption and offer a solution to reduce the risk of equipment breakdowns and the subsequent loss of production per hour, by eliminating one of the root cause opportunities. Moreover, the growing deployment of predictive maintenance solutions that use IoT sensors to monitor the performance of the lubricant in real-time, has further increased the demand for synthetic lubricants. More than 45% of the worldwide manufacturers adopt IoT-enabled predictive maintenance solutions saving up to 30% of downtime and increasing the life of machinery from 30%. With the introduction of synthetic lubricants, oil change intervals are coming down by 50%, thus contributing to lower maintenance costs for the operators. North American and European manufacturing accounts for about 70% of the implementation of automation in the manufacturing industry to minimize labor work and ensure consistency which, in turn, indirectly contributes to the use of synthetic lubricants to withstand the proper functioning of the machineries.
RESTRAIN:
The major factor restraining the growth of the synthetic lubricants market is the awareness and understanding levels of the benefits of synthetic lubricants in smaller industries and consumers. Several businesses stick to their conventional lubricants as they are already used to them, and there is a hesitation to switch from long-established habits. In other cases, certain industries may not be entirely well aware of the long-term performance benefits, such as increased service intervals and better efficiency, that synthetics deliver. Another problem has to do with the strict regulations covering the manufacturing and disposal of synthetic lubes. Even though these lubricants are less harmful to the environment, their production process as well as their disposal are still under strict regulation in some regions. Other factors may include a lack of accessibility of raw materials along with supply chain issues which may lead to production timelines being delayed especially in the case of bio-based synthetic lubricants which are relatively more difficult to produce. In some markets, these are an impediment to greater adoption and growth of synthetic lubricants.
BY TYPE
In 2023, polyalphaolefins (PAOs) held the largest share of 47.2% of the global synthetic lubricants market, owing to their extensive use in high-performance applications. PAOs exhibit remarkable properties including high thermal stability low volatility and high wear protection and are good candidates for automotive industrial and high-temperature applications. The versatility, excellent shelf-life, and resistance to extreme conditions turn this technology into a dominant one, especially in the automotive and heavy machinery sectors, where reliability is of the utmost importance. PAOs are equally a good fit for applications focused on emissions/fuel efficiency improvements in internal combustion engines to global sustainability trends.
Polyalkylene Glycols (PAGs) are projected to experience the fastest growing CAGR for the period of 2024-2032 due to their high-water solubility, which makes them an excellent choice for specialized mean needs such as refrigeration, air conditioning, and industrial processing. PAGs also better operate at extremely cold temperatures and high-load situations, both a plus for industries focused on efficiency and sustainability. However, with more industries utilizing advanced eco-friendly systems, the demand for PAG-based lubricants, especially in sectors concerned with the environment such as renewable energy and electric vehicles, is projected to increase. Moreover, the further development of PAG formulations as well as the rise of their deployment in high-precision machinery will accelerate the market growth further.
BY PRODUCT TYPE
In 2023, engine oils accounted for 29.6% of the synthetic lubricants market owing to the significant applications of synthetic lubricants in the automotive sector. Engine oils are essential to internal combustion engines as they reduce friction, limit wear, and increase engine efficiency. Increasing demand for high-performance and fuel-efficient vehicles has, in turn, spurred the adoption of advanced engine oils with fully synthetic and semi-synthetic formulations. Additionally, emissions regulations and the demand for extended oil change intervals have increased the demand for improved engine oils which provide greater stability, reduced carbon deposits, and increased performance under higher temperature and load conditions of modern engines.
Hydraulic fluids are projected to register the highest CAGR of over 5% from 2024 to 2032 as they are essential to many manufacturing and construction processes. Hydraulic fluids play an important role in machinery, they are used to keep things running and systems that rely on fluid power for movement and operation, such as construction equipment, mining machinery, and manufacturing lines. As the industrialization and automation trend continues to grow, coupled with the demand for heavy machinery in emerging economies, the demand for high-performance hydraulic fluids is growing. Synthetic hydraulic fluids offer excellent viscosity, thermal stability, and wear protection so that lubricant performance in hydraulic systems can be enhanced. Moreover, the increased development of sustainable hydraulic fluids that are eco-friendly and Biodegradable, with numerous sectors focusing on cleaner production and stricter environmental laws, is further boosting the hydraulic fluids segment.
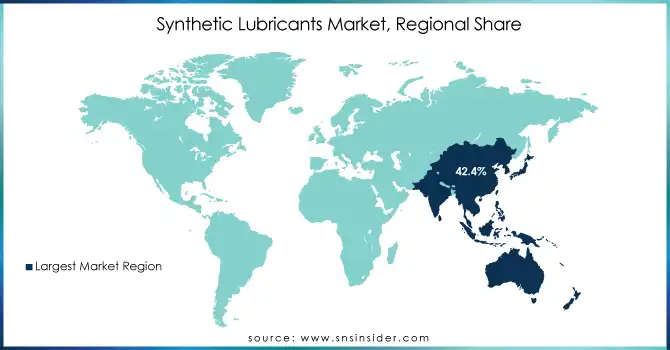
In 2023, Asia Pacific held the largest share of the synthetic lubricants market, accounting for 42.4%, owing to a strong industrial base and expanding automotive and manufacturing sectors in the region. The high-performance lubricants market is driven by countries such as China, India, and Japan. These countries have a significant share of the demand for high-quality lubricants for automotive, industrial, and electronic applications. As an illustration, the demand for advanced synthetic engine oils has been significantly boosted in China due to its rapidly expanding automotive market and the efforts by the government towards the production of energy-efficient and environment-friendly vehicles. Furthermore, the growth of the manufacturing sector in India fueled by the development of infrastructure and industrialization is expected to create further demand for specialty lubricants such as hydraulic fluids and industrial oils. The automotive sector in Japan has been undergoing a paradigm shift, driven by OEM-focused R&D for advanced technologies, such as electric, automation, and robotics resulting in enhanced adoption of high-performance synthetic lubricants, especially in precision machinery and high-tech manufacturing.
Europe is projected to have the fastest CAGR during the forecast period from 2024-2032, due to strict environmental regulations, technological developments, and an emphasis on sustainability. The increasing focus on carbon emission reduction and energy efficiency in sectors including automotive, aerospace, and industrial machinery in the region is driving the demand for synthetic lubricants with improved operating performance properties. As an example, the German automotive sector, known for brands such as BMW, Mercedes-Benz, and Volkswagen, is quickly uploading onto synthetic oils to achieve fuel economy and emission regulations. It is also driving demand for specialty lubricants for electric vehicle (EV) powertrains and battery cooling systems as the market for EVs in Europe grows with the focus of Tesla and many European automakers on EVs. For instance, the use of bio-based and biodegradable lubricants is increasingly gaining proportion in European countries which will help the dominance of the region for the synthetic lubricant market.
Get Customized Report as per your Business Requirement - Request For Customized Report
KEY PLAYERS
Some of the major players in the Synthetic Lubricants Market are:
Some of the Raw Material Suppliers for Synthetic Lubricants companies:
RECENT TRENDS
| Report Attributes | Details |
|---|---|
| Market Size in 2023 | USD 42.87 Billion |
| Market Size by 2032 | USD 56.21 Billion |
| CAGR | CAGR of 3.07% From 2024 to 2032 |
| Base Year | 2023 |
| Forecast Period | 2024-2032 |
| Historical Data | 2020-2022 |
| Report Scope & Coverage | Market Size, Segments Analysis, Competitive Landscape, Regional Analysis, DROC & SWOT Analysis, Forecast Outlook |
| Key Segments | • By Type (Esters, PAOs, Group III (Hydrocracking), PAGs) • By Product Type (Gear Oils, Metalworking Fluids, Compressor Oils, Transmission Fluids, Refrigerant Oils, Hydraulic Fluids, Engine Oils, Turbine Oils) |
| Regional Analysis/Coverage | North America (US, Canada, Mexico), Europe (Eastern Europe [Poland, Romania, Hungary, Turkey, Rest of Eastern Europe] Western Europe] Germany, France, UK, Italy, Spain, Netherlands, Switzerland, Austria, Rest of Western Europe]), Asia Pacific (China, India, Japan, South Korea, Vietnam, Singapore, Australia, Rest of Asia Pacific), Middle East & Africa (Middle East [UAE, Egypt, Saudi Arabia, Qatar, Rest of Middle East], Africa [Nigeria, South Africa, Rest of Africa], Latin America (Brazil, Argentina, Colombia, Rest of Latin America) |
| Company Profiles | Shell, ExxonMobil, BP, TotalEnergies, Chevron, FUCHS, Valvoline, Amsoil, PetroChina, Sinopec, JAX INC., Klüber Lubrication, Kano Laboratories, McLube, MagLube, Micro Surface Corporation, Moore & Balliew Oil Company, Mars Supply, Mars Company, Mars Supply |
| Key Drivers | • Technological Advances in Lubricants Drive Growth in Aerospace Robotics Wind Energy and High-Performance Engines • Industrial Automation and Smart Manufacturing Drive Increased Demand for Synthetic Lubricants in Global Markets |
| Restraints | • Challenges in Adopting Synthetic Lubricants include Awareness Barriers Regulations and Raw Material Accessibility Issues |
Ans: Asia Pacific dominated the Synthetic Lubricants Market in 2023.
Ans: The PAOs segment dominated the Synthetic Lubricants Market in 2023.
Ans: The major growth factor of the synthetic lubricants market is the increasing demand for high-performance, environmentally-friendly lubricants in industries like automotive, manufacturing, and aerospace.
Ans: Synthetic Lubricants Market size was USD 42.87 Billion in 2023 and is expected to Reach USD 56.21 Billion by 2032.
Ans: The Synthetic Lubricants Market is expected to grow at a CAGR of 3.07% during 2024-2032.
Table of Contents:
1. Introduction
1.1 Market Definition
1.2 Scope (Inclusion and Exclusions)
1.3 Research Assumptions
2. Executive Summary
2.1 Market Overview
2.2 Regional Synopsis
2.3 Competitive Summary
3. Research Methodology
3.1 Top-Down Approach
3.2 Bottom-up Approach
3.3. Data Validation
3.4 Primary Interviews
4. Market Dynamics Impact Analysis
4.1 Market Driving Factors Analysis
4.1.1 Drivers
4.1.2 Restraints
4.2 PESTLE Analysis
4.3 Porter’s Five Forces Model
5. Statistical Insights and Trends Reporting
5.1 Synthetic Lubricants Price Trends (2023)
5.2 Synthetic Lubricants Volume of Lubricant Sales (2023)
5.3 Synthetic Lubricants Environmental Impact Metrics
5.4 Synthetic Lubricants Supply Chain Analysis
6. Competitive Landscape
6.1 List of Major Companies, By Region
6.2 Market Share Analysis, By Region
6.3 Product Benchmarking
6.3.1 Product specifications and features
6.3.2 Pricing
6.4 Strategic Initiatives
6.4.1 Marketing and promotional activities
6.4.2 Distribution and Supply Chain Strategies
6.4.3 Expansion plans and new product launches
6.4.4 Strategic partnerships and collaborations
6.5 Technological Advancements
6.6 Market Positioning and Branding
7. Synthetic Lubricants Market Segmentation, By Type
7.1 Chapter Overview
7.2 Esters
7.2.1 Esters Market Trends Analysis (2020-2032)
7.2.2 Esters Market Size Estimates and Forecasts to 2032 (USD BILLION)
7.3 PAOs
7.3.1 PAOs Market Trends Analysis (2020-2032)
7.3.2 PAOs Market Size Estimates and Forecasts to 2032 (USD BILLION)
7.4 Group III (Hydrocracking)
7.4.1 Group III (Hydrocracking) Market Trends Analysis (2020-2032)
7.4.2 Group III (Hydrocracking) Market Size Estimates and Forecasts to 2032 (USD BILLION)
7.5 PAGs
7.5.1 PAGs Market Trends Analysis (2020-2032)
7.5.2 PAGs Market Size Estimates and Forecasts to 2032 (USD BILLION)
8. Synthetic Lubricants Market Segmentation, By Product Type
8.1 Chapter Overview
8.2 Gear Oils
8.2.1 Gear Oils Market Trends Analysis (2020-2032)
8.2.2 Gear Oils Market Size Estimates and Forecasts to 2032 (USD BILLION)
8.3 Metalworking Fluids
8.3.1 Metalworking Fluids Market Trends Analysis (2020-2032)
8.3.2 Metalworking Fluids Market Size Estimates and Forecasts to 2032 (USD BILLION)
8.4 Compressor Oils
8.4.1 Compressor Oils Market Trends Analysis (2020-2032)
8.4.2 Compressor Oils Market Size Estimates and Forecasts to 2032 (USD BILLION)
8.5 Transmission Fluids
8.5.1 Transmission Fluids Market Trends Analysis (2020-2032)
8.5.2 Transmission Fluids Market Size Estimates and Forecasts to 2032 (USD BILLION)
8.6 Refrigerant Oils
8.6.1 Refrigerant Oils Market Trends Analysis (2020-2032)
8.6.2 Refrigerant Oils Market Size Estimates and Forecasts to 2032 (USD BILLION)
8.7 Hydraulic Fluids
8.7.1 Hydraulic Fluids Market Trends Analysis (2020-2032)
8.7.2 Hydraulic Fluids Market Size Estimates and Forecasts to 2032 (USD BILLION)
8.8 Engine Oils
8.8.1 Engine Oils Market Trends Analysis (2020-2032)
8.8.2 Engine Oils Market Size Estimates and Forecasts to 2032 (USD BILLION)
8.9 Turbine Oils
8.9.1 Turbine Oils Market Trends Analysis (2020-2032)
8.9.2 Turbine Oils Market Size Estimates and Forecasts to 2032 (USD BILLION)
9. Regional Analysis
9.1 Chapter Overview
9.2 North America
9.2.1 Trends Analysis
9.2.2 North America Synthetic Lubricants Market Estimates and Forecasts, by Country (2020-2032) (USD BILLION)
9.2.3 North America Synthetic Lubricants Market Estimates and Forecasts, By Type (2020-2032) (USD BILLION)
9.2.4 North America Synthetic Lubricants Market Estimates and Forecasts, By Product Type (2020-2032) (USD BILLION)
9.2.5 USA
9.2.5.1 USA Synthetic Lubricants Market Estimates and Forecasts, By Type (2020-2032) (USD BILLION)
9.2.5.2 USA Synthetic Lubricants Market Estimates and Forecasts, By Product Type (2020-2032) (USD BILLION)
9.2.6 Canada
9.2.6.1 Canada Synthetic Lubricants Market Estimates and Forecasts, By Type (2020-2032) (USD BILLION)
9.2.6.2 Canada Synthetic Lubricants Market Estimates and Forecasts, By Product Type (2020-2032) (USD BILLION)
9.2.7 Mexico
9.2.7.1 Mexico Synthetic Lubricants Market Estimates and Forecasts, By Type (2020-2032) (USD BILLION)
9.2.7.2 Mexico Synthetic Lubricants Market Estimates and Forecasts, By Product Type (2020-2032) (USD BILLION)
9.3 Europe
9.3.1 Eastern Europe
9.3.1.1 Trends Analysis
9.3.1.2 Eastern Europe Synthetic Lubricants Market Estimates and Forecasts, by Country (2020-2032) (USD BILLION)
9.3.1.3 Eastern Europe Synthetic Lubricants Market Estimates and Forecasts, By Type (2020-2032) (USD BILLION)
9.3.1.4 Eastern Europe Synthetic Lubricants Market Estimates and Forecasts, By Product Type (2020-2032) (USD BILLION)
9.3.1.5 Poland
9.3.1.5.1 Poland Synthetic Lubricants Market Estimates and Forecasts, By Type (2020-2032) (USD BILLION)
9.3.1.5.2 Poland Synthetic Lubricants Market Estimates and Forecasts, By Product Type (2020-2032) (USD BILLION)
9.3.1.6 Romania
9.3.1.6.1 Romania Synthetic Lubricants Market Estimates and Forecasts, By Type (2020-2032) (USD BILLION)
9.3.1.6.2 Romania Synthetic Lubricants Market Estimates and Forecasts, By Product Type (2020-2032) (USD BILLION)
9.3.1.7 Hungary
9.3.1.7.1 Hungary Synthetic Lubricants Market Estimates and Forecasts, By Type (2020-2032) (USD BILLION)
9.3.1.7.2 Hungary Synthetic Lubricants Market Estimates and Forecasts, By Product Type (2020-2032) (USD BILLION)
9.3.1.8 turkey
9.3.1.8.1 Turkey Synthetic Lubricants Market Estimates and Forecasts, By Type (2020-2032) (USD BILLION)
9.3.1.8.2 Turkey Synthetic Lubricants Market Estimates and Forecasts, By Product Type (2020-2032) (USD BILLION)
9.3.1.9 Rest of Eastern Europe
9.3.1.9.1 Rest of Eastern Europe Synthetic Lubricants Market Estimates and Forecasts, By Type (2020-2032) (USD BILLION)
9.3.1.9.2 Rest of Eastern Europe Synthetic Lubricants Market Estimates and Forecasts, By Product Type (2020-2032) (USD BILLION)
9.3.2 Western Europe
9.3.2.1 Trends Analysis
9.3.2.2 Western Europe Synthetic Lubricants Market Estimates and Forecasts, by Country (2020-2032) (USD BILLION)
9.3.2.3 Western Europe Synthetic Lubricants Market Estimates and Forecasts, By Type (2020-2032) (USD BILLION)
9.3.2.4 Western Europe Synthetic Lubricants Market Estimates and Forecasts, By Product Type (2020-2032) (USD BILLION)
9.3.2.5 Germany
9.3.2.5.1 Germany Synthetic Lubricants Market Estimates and Forecasts, By Type (2020-2032) (USD BILLION)
9.3.2.5.2 Germany Synthetic Lubricants Market Estimates and Forecasts, By Product Type (2020-2032) (USD BILLION)
9.3.2.6 France
9.3.2.6.1 France Synthetic Lubricants Market Estimates and Forecasts, By Type (2020-2032) (USD BILLION)
9.3.2.6.2 France Synthetic Lubricants Market Estimates and Forecasts, By Product Type (2020-2032) (USD BILLION)
9.3.2.7 UK
9.3.2.7.1 UK Synthetic Lubricants Market Estimates and Forecasts, By Type (2020-2032) (USD BILLION)
9.3.2.7.2 UK Synthetic Lubricants Market Estimates and Forecasts, By Product Type (2020-2032) (USD BILLION)
9.3.2.8 Italy
9.3.2.8.1 Italy Synthetic Lubricants Market Estimates and Forecasts, By Type (2020-2032) (USD BILLION)
9.3.2.8.2 Italy Synthetic Lubricants Market Estimates and Forecasts, By Product Type (2020-2032) (USD BILLION)
9.3.2.9 Spain
9.3.2.9.1 Spain Synthetic Lubricants Market Estimates and Forecasts, By Type (2020-2032) (USD BILLION)
9.3.2.9.2 Spain Synthetic Lubricants Market Estimates and Forecasts, By Product Type (2020-2032) (USD BILLION)
9.3.2.10 Netherlands
9.3.2.10.1 Netherlands Synthetic Lubricants Market Estimates and Forecasts, By Type (2020-2032) (USD BILLION)
9.3.2.10.2 Netherlands Synthetic Lubricants Market Estimates and Forecasts, By Product Type (2020-2032) (USD BILLION)
9.3.2.11 Switzerland
9.3.2.11.1 Switzerland Synthetic Lubricants Market Estimates and Forecasts, By Type (2020-2032) (USD BILLION)
9.3.2.11.2 Switzerland Synthetic Lubricants Market Estimates and Forecasts, By Product Type (2020-2032) (USD BILLION)
9.3.2.12 Austria
9.3.2.12.1 Austria Synthetic Lubricants Market Estimates and Forecasts, By Type (2020-2032) (USD BILLION)
9.3.2.12.2 Austria Synthetic Lubricants Market Estimates and Forecasts, By Product Type (2020-2032) (USD BILLION)
9.3.2.13 Rest of Western Europe
9.3.2.13.1 Rest of Western Europe Synthetic Lubricants Market Estimates and Forecasts, By Type (2020-2032) (USD BILLION)
9.3.2.13.2 Rest of Western Europe Synthetic Lubricants Market Estimates and Forecasts, By Product Type (2020-2032) (USD BILLION)
9.4 Asia Pacific
9.4.1 Trends Analysis
9.4.2 Asia Pacific Synthetic Lubricants Market Estimates and Forecasts, by Country (2020-2032) (USD BILLION)
9.4.3 Asia Pacific Synthetic Lubricants Market Estimates and Forecasts, By Type (2020-2032) (USD BILLION)
9.4.4 Asia Pacific Synthetic Lubricants Market Estimates and Forecasts, By Product Type (2020-2032) (USD BILLION)
9.4.5 China
9.4.5.1 China Synthetic Lubricants Market Estimates and Forecasts, By Type (2020-2032) (USD BILLION)
9.4.5.2 China Synthetic Lubricants Market Estimates and Forecasts, By Product Type (2020-2032) (USD BILLION)
9.4.6 India
9.4.5.1 India Synthetic Lubricants Market Estimates and Forecasts, By Type (2020-2032) (USD BILLION)
9.4.5.2 India Synthetic Lubricants Market Estimates and Forecasts, By Product Type (2020-2032) (USD BILLION)
9.4.5 japan
9.4.5.1 Japan Synthetic Lubricants Market Estimates and Forecasts, By Type (2020-2032) (USD BILLION)
9.4.5.2 Japan Synthetic Lubricants Market Estimates and Forecasts, By Product Type (2020-2032) (USD BILLION)
9.4.6 South Korea
9.4.6.1 South Korea Synthetic Lubricants Market Estimates and Forecasts, By Type (2020-2032) (USD BILLION)
9.4.6.2 South Korea Synthetic Lubricants Market Estimates and Forecasts, By Product Type (2020-2032) (USD BILLION)
9.4.7 Vietnam
9.4.7.1 Vietnam Synthetic Lubricants Market Estimates and Forecasts, By Type (2020-2032) (USD BILLION)
9.2.7.2 Vietnam Synthetic Lubricants Market Estimates and Forecasts, By Product Type (2020-2032) (USD BILLION)
9.4.8 Singapore
9.4.8.1 Singapore Synthetic Lubricants Market Estimates and Forecasts, By Type (2020-2032) (USD BILLION)
9.4.8.2 Singapore Synthetic Lubricants Market Estimates and Forecasts, By Product Type (2020-2032) (USD BILLION)
9.4.9 Australia
9.4.9.1 Australia Synthetic Lubricants Market Estimates and Forecasts, By Type (2020-2032) (USD BILLION)
9.4.9.2 Australia Synthetic Lubricants Market Estimates and Forecasts, By Product Type (2020-2032) (USD BILLION)
9.4.10 Rest of Asia Pacific
9.4.10.1 Rest of Asia Pacific Synthetic Lubricants Market Estimates and Forecasts, By Type (2020-2032) (USD BILLION)
9.4.10.2 Rest of Asia Pacific Synthetic Lubricants Market Estimates and Forecasts, By Product Type (2020-2032) (USD BILLION)
9.5 Middle East and Africa
9.5.1 Middle East
9.5.1.1 Trends Analysis
9.5.1.2 Middle East Synthetic Lubricants Market Estimates and Forecasts, by Country (2020-2032) (USD BILLION)
9.5.1.3 Middle East Synthetic Lubricants Market Estimates and Forecasts, By Type (2020-2032) (USD BILLION)
9.5.1.4 Middle East Synthetic Lubricants Market Estimates and Forecasts, By Product Type (2020-2032) (USD BILLION)
9.5.1.5 UAE
9.5.1.5.1 UAE Synthetic Lubricants Market Estimates and Forecasts, By Type (2020-2032) (USD BILLION)
9.5.1.5.2 UAE Synthetic Lubricants Market Estimates and Forecasts, By Product Type (2020-2032) (USD BILLION)
9.5.1.6 Egypt
9.5.1.6.1 Egypt Synthetic Lubricants Market Estimates and Forecasts, By Type (2020-2032) (USD BILLION)
9.5.1.6.2 Egypt Synthetic Lubricants Market Estimates and Forecasts, By Product Type (2020-2032) (USD BILLION)
9.5.1.7 Saudi Arabia
9.5.1.7.1 Saudi Arabia Synthetic Lubricants Market Estimates and Forecasts, By Type (2020-2032) (USD BILLION)
9.5.1.7.2 Saudi Arabia Synthetic Lubricants Market Estimates and Forecasts, By Product Type (2020-2032) (USD BILLION)
9.5.1.8 Qatar
9.5.1.8.1 Qatar Synthetic Lubricants Market Estimates and Forecasts, By Type (2020-2032) (USD BILLION)
9.5.1.8.2 Qatar Synthetic Lubricants Market Estimates and Forecasts, By Product Type (2020-2032) (USD BILLION)
9.5.1.9 Rest of Middle East
9.5.1.9.1 Rest of Middle East Synthetic Lubricants Market Estimates and Forecasts, By Type (2020-2032) (USD BILLION)
9.5.1.9.2 Rest of Middle East Synthetic Lubricants Market Estimates and Forecasts, By Product Type (2020-2032) (USD BILLION)
9.5.2 Africa
9.5.2.1 Trends Analysis
9.5.2.2 Africa Synthetic Lubricants Market Estimates and Forecasts, by Country (2020-2032) (USD BILLION)
9.5.2.3 Africa Synthetic Lubricants Market Estimates and Forecasts, By Type (2020-2032) (USD BILLION)
9.5.2.4 Africa Synthetic Lubricants Market Estimates and Forecasts, By Product Type (2020-2032) (USD BILLION)
9.5.2.5 South Africa
9.5.2.5.1 South Africa Synthetic Lubricants Market Estimates and Forecasts, By Type (2020-2032) (USD BILLION)
9.5.2.5.2 South Africa Synthetic Lubricants Market Estimates and Forecasts, By Product Type (2020-2032) (USD BILLION)
9.5.2.6 Nigeria
9.5.2.6.1 Nigeria Synthetic Lubricants Market Estimates and Forecasts, By Type (2020-2032) (USD BILLION)
9.5.2.6.2 Nigeria Synthetic Lubricants Market Estimates and Forecasts, By Product Type (2020-2032) (USD BILLION)
9.5.2.7 Rest of Africa
9.5.2.7.1 Rest of Africa Synthetic Lubricants Market Estimates and Forecasts, By Type (2020-2032) (USD BILLION)
9.5.2.7.2 Rest of Africa Synthetic Lubricants Market Estimates and Forecasts, By Product Type (2020-2032) (USD BILLION)
9.6 Latin America
9.6.1 Trends Analysis
9.6.2 Latin America Synthetic Lubricants Market Estimates and Forecasts, by Country (2020-2032) (USD BILLION)
9.6.3 Latin America Synthetic Lubricants Market Estimates and Forecasts, By Type (2020-2032) (USD BILLION)
9.6.4 Latin America Synthetic Lubricants Market Estimates and Forecasts, By Product Type (2020-2032) (USD BILLION)
9.6.5 brazil
9.6.5.1 Brazil Synthetic Lubricants Market Estimates and Forecasts, By Type (2020-2032) (USD BILLION)
9.6.5.2 Brazil Synthetic Lubricants Market Estimates and Forecasts, By Product Type (2020-2032) (USD BILLION)
9.6.6 Argentina
9.6.6.1 Argentina Synthetic Lubricants Market Estimates and Forecasts, By Type (2020-2032) (USD BILLION)
9.6.6.2 Argentina Synthetic Lubricants Market Estimates and Forecasts, By Product Type (2020-2032) (USD BILLION)
9.6.7 Colombia
9.6.7.1 Colombia Synthetic Lubricants Market Estimates and Forecasts, By Type (2020-2032) (USD BILLION)
9.6.7.2 Colombia Synthetic Lubricants Market Estimates and Forecasts, By Product Type (2020-2032) (USD BILLION)
9.6.8 Rest of Latin America
9.6.8.1 Rest of Latin America Synthetic Lubricants Market Estimates and Forecasts, By Type (2020-2032) (USD BILLION)
9.6.8.2 Rest of Latin America Synthetic Lubricants Market Estimates and Forecasts, By Product Type (2020-2032) (USD BILLION)
10. Company Profiles
10.1 Shell
10.1.1 Company Overview
10.1.2 Financial
10.1.3 Products/ Services Offered
110.1.4 SWOT Analysis
10.2 ExxonMobil
10.2.1 Company Overview
10.2.2 Financial
10.2.3 Products/ Services Offered
10.2.4 SWOT Analysis
10.3 BP
10.3.1 Company Overview
10.3.2 Financial
10.3.3 Products/ Services Offered
10.3.4 SWOT Analysis
10.4 TotalEnergies
10.4.1 Company Overview
10.4.2 Financial
10.4.3 Products/ Services Offered
10.4.4 SWOT Analysis
10.5 Chevron
10.5.1 Company Overview
10.5.2 Financial
10.5.3 Products/ Services Offered
10.5.4 SWOT Analysis
10.6 FUCHS
10.6.1 Company Overview
10.6.2 Financial
10.6.3 Products/ Services Offered
10.6.4 SWOT Analysis
10.7 Valvoline
10.7.1 Company Overview
10.7.2 Financial
10.7.3 Products/ Services Offered
10.7.4 SWOT Analysis
10.8 Amsoil
10.8.1 Company Overview
10.8.2 Financial
10.8.3 Products/ Services Offered
10.8.4 SWOT Analysis
10.9 PetroChina
10.9.1 Company Overview
10.9.2 Financial
10.9.3 Products/ Services Offered
10.9.4 SWOT Analysis
10.10 Sinopec
10.9.1 Company Overview
10.9.2 Financial
10.9.3 Products/ Services Offered
10.9.4 SWOT Analysis
11. Use Cases and Best Practices
12. Conclusion
An accurate research report requires proper strategizing as well as implementation. There are multiple factors involved in the completion of good and accurate research report and selecting the best methodology to compete the research is the toughest part. Since the research reports we provide play a crucial role in any company’s decision-making process, therefore we at SNS Insider always believe that we should choose the best method which gives us results closer to reality. This allows us to reach at a stage wherein we can provide our clients best and accurate investment to output ratio.
Each report that we prepare takes a timeframe of 350-400 business hours for production. Starting from the selection of titles through a couple of in-depth brain storming session to the final QC process before uploading our titles on our website we dedicate around 350 working hours. The titles are selected based on their current market cap and the foreseen CAGR and growth.
The 5 steps process:
Step 1: Secondary Research:
Secondary Research or Desk Research is as the name suggests is a research process wherein, we collect data through the readily available information. In this process we use various paid and unpaid databases which our team has access to and gather data through the same. This includes examining of listed companies’ annual reports, Journals, SEC filling etc. Apart from this our team has access to various associations across the globe across different industries. Lastly, we have exchange relationships with various university as well as individual libraries.

Step 2: Primary Research
When we talk about primary research, it is a type of study in which the researchers collect relevant data samples directly, rather than relying on previously collected data. This type of research is focused on gaining content specific facts that can be sued to solve specific problems. Since the collected data is fresh and first hand therefore it makes the study more accurate and genuine.
We at SNS Insider have divided Primary Research into 2 parts.
Part 1 wherein we interview the KOLs of major players as well as the upcoming ones across various geographic regions. This allows us to have their view over the market scenario and acts as an important tool to come closer to the accurate market numbers. As many as 45 paid and unpaid primary interviews are taken from both the demand and supply side of the industry to make sure we land at an accurate judgement and analysis of the market.
This step involves the triangulation of data wherein our team analyses the interview transcripts, online survey responses and observation of on filed participants. The below mentioned chart should give a better understanding of the part 1 of the primary interview.

Part 2: In this part of primary research the data collected via secondary research and the part 1 of the primary research is validated with the interviews from individual consultants and subject matter experts.
Consultants are those set of people who have at least 12 years of experience and expertise within the industry whereas Subject Matter Experts are those with at least 15 years of experience behind their back within the same space. The data with the help of two main processes i.e., FGDs (Focused Group Discussions) and IDs (Individual Discussions). This gives us a 3rd party nonbiased primary view of the market scenario making it a more dependable one while collation of the data pointers.
Step 3: Data Bank Validation
Once all the information is collected via primary and secondary sources, we run that information for data validation. At our intelligence centre our research heads track a lot of information related to the market which includes the quarterly reports, the daily stock prices, and other relevant information. Our data bank server gets updated every fortnight and that is how the information which we collected using our primary and secondary information is revalidated in real time.

Step 4: QA/QC Process
After all the data collection and validation our team does a final level of quality check and quality assurance to get rid of any unwanted or undesired mistakes. This might include but not limited to getting rid of the any typos, duplication of numbers or missing of any important information. The people involved in this process include technical content writers, research heads and graphics people. Once this process is completed the title gets uploader on our platform for our clients to read it.
Step 5: Final QC/QA Process:
This is the last process and comes when the client has ordered the study. In this process a final QA/QC is done before the study is emailed to the client. Since we believe in giving our clients a good experience of our research studies, therefore, to make sure that we do not lack at our end in any way humanly possible we do a final round of quality check and then dispatch the study to the client.
Key Segments:
By Type
Esters
PAOs
Group III (Hydrocracking)
PAGs
By Product Type
Gear Oils
Metalworking Fluids
Compressor Oils
Transmission Fluids
Refrigerant Oils
Hydraulic Fluids
Engine Oils
Turbine Oils
Request for Segment Customization as per your Business Requirement: Segment Customization Request
REGIONAL COVERAGE:
North America
US
Canada
Mexico
Europe
Eastern Europe
Poland
Romania
Hungary
Turkey
Rest of Eastern Europe
Western Europe
Germany
France
UK
Italy
Spain
Netherlands
Switzerland
Austria
Rest of Western Europe
Asia Pacific
China
India
Japan
South Korea
Vietnam
Singapore
Australia
Rest of Asia Pacific
Middle East & Africa
Middle East
UAE
Egypt
Saudi Arabia
Qatar
Rest of the Middle East
Africa
Nigeria
South Africa
Rest of Africa
Latin America
Brazil
Argentina
Colombia
Rest of Latin America
Request for Country Level Research Report: Country Level Customization Request
Available Customization
With the given market data, SNS Insider offers customization as per the company’s specific needs. The following customization options are available for the report:
Product Analysis
Criss-Cross segment analysis (e.g. Product X Application)
Product Matrix which gives a detailed comparison of the product portfolio of each company
Geographic Analysis
Additional countries in any of the regions
Company Information
Detailed analysis and profiling of additional market players (Up to five)
Medical Tubing Market was valued at USD 10.7 billion in 2023 and is expected to reach USD 21.8 billion by 2032 at a CAGR of 8.3% from 2024 to 2032.
The Mulch Film Market Size was valued at USD 4.07 Billion in 2023 and is expected to reach USD 7.59 Billion by 2032, growing at a CAGR of 7.17% over the forecast period of 2024-2032.
The Construction Chemicals Market was worth USD 58.4 billion in 2023 and is expected to grow to USD 107.1 billion by 2032, with a CAGR of 7.0% in the forecast period 2024-2032.
The Levulinic Acid Market Size was USD 55.5 Million in 2023 and is expected to reach USD 104.2 Million by 2032 and grow at a CAGR of 7.3% by 2024-2032.
The Point of Use Water Treatment Systems Market Size was valued at USD 29.48 billion in 2023, and is expected to reach USD 63.50 billion by 2032, and grow at a CAGR of 8.90% over the forecast period 2024-2032.
The HVAC Filters Market size was valued at USD 3.90 billion in 2023 and is expected to reach USD 6.59 billion by 2032 and grow at a CAGR of 6.00% over the forecast period of 2024-2032.

Hi! Click one of our member below to chat on Phone
© 2025 All Rights Reserved by SNS Insider Pvt Ltd


