Switching Regulators Power Management IC Market Size Analysis:
The Switching Regulators Power Management IC Market was valued at 9.56 Billion in 2023 and is projected to reach USD 13.47 Billion by 2032, growing at a CAGR of 3.88% from 2024 to 2032.
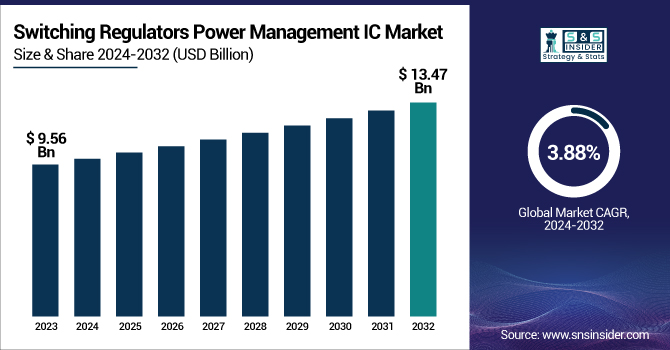
To Get more information on Switching Regulators Power Management IC Market - Request Free Sample Report
The growing demand of various industrial sectors such as automotive, consumer electronics, telecommunications, and industrial automation for eco-friendly electronic devices is contributing significantly toward the growth of this market." Switching regulators for mobile devices and data centers are seeing uptake owing to electrification of the automotive market and small power supplies maintaining high-efficiency. Trends like improved thermal performance, a higher integration ratio for system miniaturization as well as lifecycle sustainability, are also propelling new design and manufacturing choices.
In the United States, the market was valued at USD 2.91 billion in 2023 and is expected to reach USD 3.19 billion by 2032, growing at a CAGR of 1.31%. There's been a movement toward artificial intelligence power management systems, especially in the U.S., designed to make smart devices and harangue them about their energy consumption in real-time to grow this segment. The Green Electronics/End of Life and Regulations Compliance also highly influence the Switching Regulators Power Management IC Market dynamics apart from these trends.
Switching Regulators Power Management IC Market Dynamics:
Drivers:
-
Rising Demand and Innovation Fuel Growth in Switching Regulators Power Management IC Market
Switching regulators have become more popular by effectively controlling high power loads and stable output voltage under different input levels, enabling greater flexibility and performance. The growing utilization becomes more apparent to see in the automotive and consumer electronics sectors. In June 2022, for example, ROHM introduced a new generation of high-performance automotive LDO regulator ICs with its Nano Cap technology, which provides superior voltage stability at low output capacitance, making it useful in powertrain systems, ADAS, infotainment and body electronics. Meanwhile, consumer electronics are on the rise and demand is skyrocketing, with US smartphone sales totaling USD 74.7 billion in 2021 (US Census Bureau, CTA). Switch regulator PMICs have never been more common than in recent years as the demand has only risen for both the platform's products and their applications like in wireless electronics, smartphones, computers, and robotics. In addition, the global expansion of battery-operated infrastructure, including mobile power banks and EVCharging stations, propels the market growth. This involves Power Global's 25 million investment in India that was announced in October 2021 to establish a manufacturing facility for lithium-ion batteries, set up battery swapping networks and convert 800,000 three-wheelers into electric vehicles. These trends also emphasize the proliferation of PMICs powering mobility and energy management solutions everywhere.
Restraints:
-
Factors Affecting Growth in the Switching Regulators Power Management IC Market
Many industries, particularly in the automotive and industrial sectors, continue to rely on older, less efficient power management solutions. This means that switching regulators, which possess better efficiency and performance characteristics, would require a massive overhaul of existing infrastructure. Shifting to a new system can be an expensive and time-consuming process due to the systems and hardware required to replace or upgrade existing systems that typically have an impact on business continuity. They may also struggle with staff retraining and ensuring new PMICs are compatible with preexisting equipment. This, coupled with the downtime required to integrate these upgrades have made it difficult for businesses to adopt the latest in power management technology.
Opportunities:
-
Rising Demand for Consumer Electronics Driving the Power Management IC Market
The growing demand for smartphones, tablets, wearables, and other portable devices offers significant opportunities for power management ICs. These devices require efficient power regulation to optimize battery life, enhance performance, and ensure longer usability between charges. With the relentless evolution of consumer electronics towards more features, faster processors and greater power needs, power management ICs are a cornerstone of next-generation products. These devices use switching regulators that help improve energy consumption and performance of the device, leading to increased battery life. Power management ICs are pivotal in driving innovation around the ever-evolving needs of the consumer electronics landscape rest on innovations in feature areas such as fast charging and great power efficiency. Power management ICs are specifically driven by new technologies and the consumer need for more power, portability, battery life, and performance technology has grown significantly in the data processing.
Challenges:
-
Regulatory Compliance and Energy Standards Increase Costs and Complexity for Switching Regulators Manufacturers
Complying with strict energy efficiency and environmental regulations presents a major challenge for switching regulator manufacturers. Such regulations typically drive the implementation of new, more advanced, and technologies that are more efficient that are more expensive and complex to manufacture. To meet increasing government demands to decarbonize and to enhance energy efficiency, product design innovation is crucial. That is resource and time-heavy of both which drive up development costs and slow time-to-market. Manufacturers will also have to spend a great deal on research and development to stay up to date with the new standards and that could take their focus away from other aspects of their businesses. Such regulations underscore the more focused aspect on environment sustainability; but on the other side, they increasingly push the manufacturers to comply with the compliancy norms, along with cost efficiency and performance, which may limit the growth and competitiveness of the market.
Switching Regulators Power Management IC Market Segment Analysis:
By Architecture Type
The Integrated Circuits (IC) segment holds the largest share of the Switching Regulators Power Management IC market, accounting for approximately 58% of the total revenue in 2023. The Increasing demand for power management solutions from consumer electronics, automotive, industrial applications is fuelling this dominance. Integrated Circuits are small, efficient and relatively inexpensive, so they can be used in a wide variety of applications, where application space and performance are very important. The capabilities to perform complex power management tasks, including voltage regulation, conversion and protection, make them the prefered choice of the manufacturers. And market leaderships of ICs had boon in parallel because the proliferation of emerging technologies is driving demand for integrated circuits (ICs) such as IoT devices, electric vehicles, and renewable energy systems. With innovation leading the way, we are confident the IC segment will remain both the largest and the best for ongoing design enhancement and efficiency.
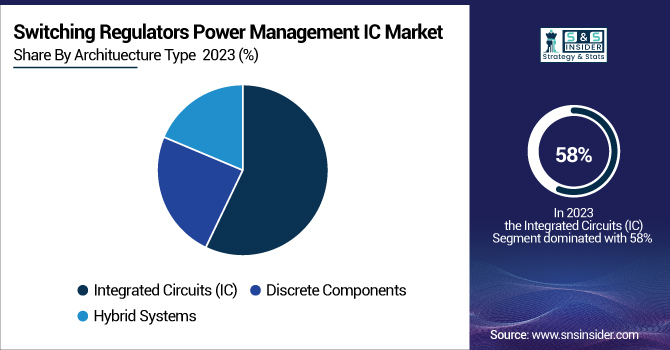
The Hybrid Systems segment is expected to experience significant growth between 2024 and 2032, This integration allows for improved power consumption, versatility and expanded operating range, helping to suit this system to advanced industrial and automotive use cases. A hybrid system can potentially ensure both an effective balance in cost and performance in cases like Telecom Domain, where efficiency and reduction affect the majority of the processes. Further, hybrid systems optimize both performance and cost and thus become a cost-optimal solution. And with a growing number of sectors ever more eager to stretch the boundaries of smart, sustainable solutions, hybrid systems look set to lead the way in the evolution of power management technologies. The emergence of hybrid systems across various domains highlights their relevance in the power management IC verticals.
By Output Type
The Step-Down (or Buck) segment dominated the Switching Regulators Power Management IC Market in 2023, accounting for approximately 46% of the total revenue share. This makes it very efficient for the conversion of higher input voltages into smaller output voltages, which makes it essential for all modern electronics and systems. Hence, small step-down regulators are very common in consumer, automotive and industrial applications, because they provide a small footprint and low cost at the same time, with low power loss. Their ability to keep them within stable voltage levels, even when supplied with fluctuating electricity input, allows them to be perfect for portable and battery-driven environments where power saving is crucial. The increasing need for energy-efficient solutions and miniaturized electronics further drives the adoption of step-down switching regulators. Their versatile performance and integration into a wide array of power-sensitive applications further cement their leading market position.
The Buck-Boost segment is expected to be significant growth in the Switching Regulators Power Management IC Market over the forecast period from 2024 to 2032. This growth is accompanied by the ability of the segment to supply to the output uninterrupted voltage levels above and below the specified output value, making it therefore a very adaptable one to a multitude of energy scenarios. Buck-Boost converters are essential for battery powered and portable products where the input voltage can swing orders of magnitude as the battery drains. They are well-suited for everything from smartphones and wearables to IoT devices, medical electronics and automotive systems, supporting step-up and step-down as well. Growing demand for energy-efficient and compact power solutions is triggering demand for power conversion technologies across application segments, with adaptive power regulation technologies such as Buck-Boost regulators forecasting the fastest growth in this segment, and with robust breathing space opportunities expected to trigger at a later stage of the forecast period.
By Application
The Consumer Electronics segment dominated the Switching Regulators Power Management IC Market in 2023, accounting for approximately 35% of the total revenue share. This dominance is primarily attributed to the massive global demand for smartphones, tablets, laptops, gaming devices, and wearable technologies, all of which rely heavily on efficient power management to ensure optimal battery performance and compact design. Switching regulators are more efficient than LDOs and less prone to thermal issues, both of which are vital for battery-powered applications and high-speed compact consumer electronics in order to maximize battery life and minimize heat dissipation. With innovation in high-resolution displays, faster processors, and 5G connectivity, we have witnessed a steep rise in the demand for advanced power regulation solutions. In addition, increasing use of smart home devices and connected electronic in products is driving the demand for reliable and compact power management integrated circuits, which is enabling the Consumer Electronics sub-segment to maintain its dominant presence across the market.
The Automotive segment is forecasted to witness the fastest growth in the Switching Regulators Power Management IC Market over the period 2024–2032. This forecast is underpinned by the pace of vehicle electrification, proliferation of ADAS systems, and pervasive realisation of In-Vehicle Infotainment and Connectivity, as mentioned above. As a result, the increasing number of electric vehicles (EVs) and hybrid electric vehicles (HEVs) presents a burgeoning demand for compact, efficient power management devices such as switching regulators for their subsystems. Multiple such application specific Integrated Circuits (ICs) are utilized for battery optimization, energy management and thermal management under different load scenarios. In addition to that the autonomous driving functionality requires highly reliable and energy efficient voltage regulation for sensor, control unit and communication modules.
By End Use
The Industrial segment dominated the Switching Regulators Power Management IC Market in 2023 with a revenue share of around 41% and is expected to experience rapid growth over the forecast period from 2024 to 2032. This dominance is due to the increasing implementation of automation, smart manufacturing, connected industrial systems, which must maintain smooth, consistent power regulation. Switching linear regulators are needed in industrial applications to effectively handle voltage fluctuations in the input, while keeping a consistent output, necessary for actuation of high-power machinery or sensitive control units. The rise of Industry 4.0 and the emerging industrial Internet of Things (IIoT) reinforce the requirement for small, efficient power management circuitry. Additionally, the industrial applications of advanced power management ICs are expected to increase significantly over the coming years as industries retrofit their facilities and spend on energy-efficiency solutions.
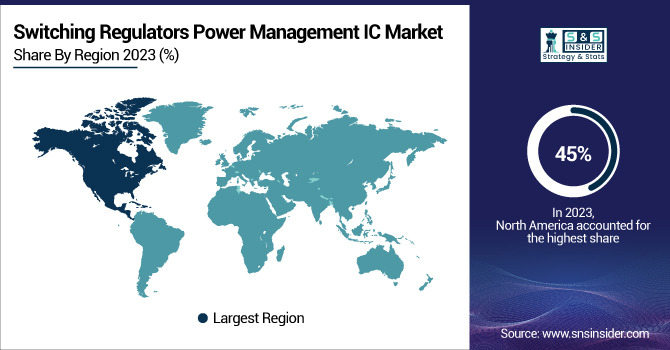
Switching Regulators Power Management IC Market Regional Analysis:
In 2023, North America dominated the Switching Regulators Power Management IC Market, accounting for approximately 45% of the total revenue share. This robust regional presence is primarily supported by industries having advanced technological infrastructure, presence of leading semiconductor and electronics manufacturers, and the maximum demand for power efficient solutions across sectors including consumer electronics, automotive and industrial automation. Research and development (R&D), large-scale manufacturing of such sites, and incorporation of advanced power management systems in smart appliances and electric vehicles place the U.S. well ahead of the region in terms of overall dominance. In addition, growing government initiatives towards energy efficiency and sustainability has also facilitated the growth of the market. Growing advancement for the usage of IoT and AI in various American industries has led to a sharp rise in demand for effective manipulation of power, resulting in North America leading the consumption of power regulation systems. Canada is also doing its part to contribute, leveraging its growing tech sector and redoubling efforts on clean energy systems.
The Asia-Pacific region is projected to witness the fastest growth in the Switching Regulators Power Management IC Market over the forecast period from 2024 to 2032. The rapid industrialization, a rise in consumer electronics and continued penetration of electric vehicles among large economies like China, India, Japan and South Korea fuel this surge. The concentration of large semiconductor — manufacturing industries, including in China and Taiwan, bolsters both local production capacity and innovation. In addition, initiatives from government bodies supporting the energy-efficient technologies for the boom of smart infrastructure further accelerates the advance in demand for complex power management ICs. The widespread use of mobile devices, as well as huge investments in 5G networks and data centers, have driven the demand for more efficient switching regulators.
Get Customized Report as per Your Business Requirement - Enquiry Now
Key Players in Switching Regulators Power Management IC Market along with their Products:
-
Qualcomm (USA) - Snapdragon Power Management ICs
-
Maxim Integrated (USA) - Max16903, Max16912 step-down regulators
-
Skyworks Solutions (USA) - SkyOne integrated power management solutions
-
Renesas Electronics (Japan) - RL78/G13, RX series microcontrollers with power management
-
NXP Semiconductors (Netherlands) - LPC1100 series microcontrollers with power management
-
Analog Devices (USA) - ADM8317, ADM7150 power management ICs
-
Microchip Technology (USA) - MIC5365, MIC5366 low dropout regulators
-
Broadcom (USA) - Power management ICs for Wi-Fi and Bluetooth modules
-
Infineon Technologies (Germany) - IR3847, IR3837 step-down voltage regulators
-
ON Semiconductor (USA) - NCP4681 low dropout regulators
-
STMicroelectronics (Switzerland) - L6920 step-down regulator
-
Texas Instruments (USA) - TPS7A02 ultra-low noise LDO, LMZM23600 step-down regulator
-
Linear Technology (USA) - LTC3565 switching regulators
-
Cree (USA) - Power management solutions for LED drivers
-
Vishay Intertechnology (USA) - SiP32447, SiP32415 integrated power management ICs
List of Key suppliers who provide raw materials and components for the Switching Regulators Power Management IC Market:
-
Taiwan Semiconductor Manufacturing Company (TSMC) (Taiwan)
-
GlobalFoundries (USA)
-
Samsung Electronics (South Korea)
-
SK hynix (South Korea)
-
Intel Corporation (USA)
-
Murata Manufacturing (Japan)
-
Vishay Intertechnology (USA)
-
Rohm Semiconductor (Japan)
-
Texas Instruments (USA)
-
ON Semiconductor (USA)
Recent Development:
-
On October 24, 2024, Renesas Electronics teamed with Intel to create a power management solution for Intel’s Core Ultra 200V processors, optimizing laptops’ battery usage, with an emphasis on AI. This collaboration simplified power management for mobile computing by adding the RAA225019 PMIC, RAA489301 pre-regulator, and ISL9241 battery charger.
-
On Feb 21, 2025 Broadcom revealed their breakthroughs in 200G/lane copper link and 224 Gbps/448 Gbps CEI. They also noted initiatives about empowering women engineers with Cathy Liu speaking on the need for more support for young women in the field.
| Report Attributes | Details |
|---|---|
| Market Size in 2023 | USD 9.56 Billion |
| Market Size by 2032 | USD 13.47 Billion |
| CAGR | CAGR of 3.88% From 2024 to 2032 |
| Base Year | 2023 |
| Forecast Period | 2024-2032 |
| Historical Data | 2020-2022 |
| Report Scope & Coverage | Market Size, Segments Analysis, Competitive Landscape, Regional Analysis, DROC & SWOT Analysis, Forecast Outlook |
| Key Segments | • By Architecture Type (Integrated Circuits, Discrete Components, Hybrid Systems) • By Output Type (Step-Down, Step-Up, Buck-Boost, Linear) • By Application (Consumer Electronics, Industrial Automation, Telecommunications, Automotive, Medical Devices) • By End Use(Residential, Commercial, Industrial) |
| Regional Analysis/Coverage | North America (US, Canada, Mexico), Europe (Eastern Europe [Poland, Romania, Hungary, Turkey, Rest of Eastern Europe] Western Europe] Germany, France, UK, Italy, Spain, Netherlands, Switzerland, Austria, Rest of Western Europe]), Asia-Pacific (China, India, Japan, South Korea, Vietnam, Singapore, Australia, Rest of Asia-Pacific), Middle East & Africa (Middle East [UAE, Egypt, Saudi Arabia, Qatar, Rest of Middle East], Africa [Nigeria, South Africa, Rest of Africa], Latin America (Brazil, Argentina, Colombia, Rest of Latin America) |
| Company Profiles | Qualcomm (USA), Maxim Integrated (USA), Skyworks Solutions (USA), Renesas Electronics (Japan), NXP Semiconductors (Netherlands), Analog Devices (USA), Microchip Technology (USA), Broadcom (USA), Infineon Technologies (Germany), ON Semiconductor (USA), STMicroelectronics (Switzerland), Texas Instruments (USA), Linear Technology (USA), Cree (USA), and Vishay Intertechnology (USA). |
