To get more information on SUV Market - Request Free Sample Report
The SUV Market Size was valued at USD 873.98 Billion in 2023 and is expected to reach USD 1549.42 Billion by 2032 and grow at a CAGR of 6.60% over the forecast period 2024-2032.
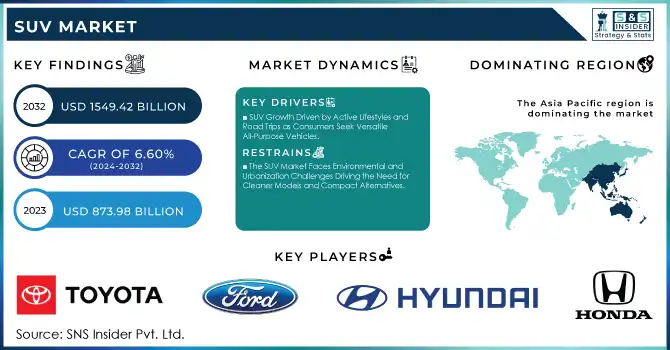
The growth of the SUV segment is due to changing consumer preferences and technological progress. With urban boundaries growing outward, a spacious SUV that can do it all commutes, errands, and off-highway excursions is enticing to consumers. The compact and mid-size SUV segment is especially booming as consumers demand a family-oriented vehicle with plenty of space, but also prefer to have better band-for-buck with gas mileage. SUVs are also appealing to consumers due to the elevated seating position and safety elements the segment provides, making it popular with a range of demographics as well as across several different geographical regions.
In 2023, SUVs measuring less than 4 meters were accountable for around 50% of total car sales in India, fueled by an increasing number of models such as the Tata Nexon and Mahindra XUV700. However, compact SUVs such as the Honda CR-V and Toyota RAV4 gained 12 percent in the U.S. in 2023. Safety was touted as one of the key features listed by more than 60% of U.S. SUV buyers, citing advanced driver-assistance systems (ADAS) as an important factor in their decision-making. The compact SUVs (the likes of Volkswagen T-Roc and Renault Captur) climbed up to 15% in 2023 in Europe.
At the same time, improvements in automotive technology especially hybrid and electric powertrains are propelling SUV sales even higher. Governments across the globe are providing incentives and subsidies for low-emission vehicles and zero-emission vehicles, which has led manufacturers to double down on electric and hybrid SUVs. Battery technology and charging infrastructure have also matured, making electric SUVs a realistic proposition for buyers seeking lower emissions, and some strong growth forecasts for this segment. All of which dovetails with a wider industry move toward sustainability, so expect the SUV sector to remain well-placed for growth throughout the next decade. Fueling the rapid rise, hybrid and electric vehicle sales gained 55% in the U.S. in 2023, spearheaded by such models as the Toyota RAV4 Prime and Ford Mustang Mach-E. Various government incentives are responsible too. The EU provides as much as Euro 5,000 in EV subsidies, whilst China saw EV sales skyrocket by 90% in 2023.
KEY DRIVERS:
SUV Growth Driven by Active Lifestyles and Road Trips as Consumers Seek Versatile All-Purpose Vehicles
The key trends driving SUV market growth are changing lifestyle trends. As more consumers embrace active lifestyles, SUVs provide the space and utility those consumers seem to be demanding. The modern SUV is designed to accommodate hobbies, whether it be camping, fishing, biking, or off-roading, as it usually possesses ample cargo space, towing capacity, and off-road capabilities all features of interest to the adventure-minded consumer. With the popularity of road trips and outdoor recreation, SUVs offer the capability and versatility that sedans or smaller vehicles do not. The resulting change in lifestyle has given SUVs the best-selling title with consumers wanting multi-practicality from their cars. SUVs fueled by active pursuits rose from 2023 to 2024. 20% of U.S. SUV buyers got their vehicles for outdoor pursuits such as camping and biking. 40% of Americans traveled in SUVs for road trips in 2023. In the EU, 40% of new Car Registration SUVs were largely developed for off-road and leisure duties. They emphasize the need for all-purpose vehicles equipped with cargo space, towing, and off-road capability.
SUVs Drive Growth with Digitalization and Advanced Safety Features Meeting Consumer Demand for Tech Integration
The second key driver is the trend to significant levels of digitalization and safety content that are now common features in many SUVs. With consumers looking for more convenience and safer, more entertaining technology in their vehicles, SUVs have evolved to feature advanced driver assistance systems (ADAS), smart infotainment platforms, and access to smartphones through dot-matrix screens. Technologies like adaptive cruise control, lane-keeping assist, and collision avoidance systems appeal to tech-focused consumers who are seeking safer driving experiences. Plus, as infotainment and connected services have become key differentiators, SUVs are also a hotbed of high-tech systems that provide a personalized driving experience. This has played a big part in boosting the demand for SUVs since buyers are looking for tech-enabled travel. Between 2023 and 2024, 70% of newly registered SUVs in the U.S. were equipped with ADAS (adaptive cruise control, lane-keeping assist, collision avoidance, among others). Overall, 70% of SUV buyers around the world were at least moderately interested in smart infotainment and connected services like Apple CarPlay and Android Auto. 45% share of SUVs in Europe sold in 2023 featured advanced safety and infotainment technology, proof of strong demand for increasingly digitally integrated vehicles.
RESTRAIN:
The SUV Market Faces Environmental and Urbanization Challenges Driving the Need for Cleaner Models and Compact Alternatives
A major challenge for the SUV market is the environmental impact and regulatory pressures due to the high emissions associated with traditional SUVs. Many governments are enacting stricter emissions standards and promoting green policies, which can restrict sales and require manufacturers to develop cleaner models, like electric SUVs, which come with their own technical and infrastructure challenges. This shift puts pressure on automakers to innovate rapidly in emissions-reduction technology and battery advancements to meet both consumer demand and compliance standards. Another restraint is the size and weight of SUVs, which often make them less efficient and harder in densely populated urban areas. Their larger dimensions can limit parking and handling convenience, which can be off-putting for some buyers in city settings. As urbanization grows, consumers may seek more compact alternatives, which could challenge the SUV market. Addressing these factors requires manufacturers to rethink design and functionality to align with evolving consumer preferences and regulatory landscapes.
BY SEATING CAPACITY
In 2023, the 5-seater SUV had the largest market share of SUV market segments with 64% part of total sales. This segment continues to dominate the market largely because most urban/suburban consumers are looking for the best trade-off between space and efficiency. The Compact and mid-size SUV, generally delivered in five-opening setups, is viable for families and individual drivers who need an adaptable, extensive vehicle at a moderate cost, and while simpler to explore in city conditions.
The >5-seater will grow with the fastest compound annual growth rate in the SUV segment is forecast from 2024 to 2032. Demand for bigger vehicles capable of carrying more people is fueling this growth, with family-oriented and premium SUVs more prevalent in some markets. The introduction of hybrid and electric options in the >5-seater category is also likely to appeal to environmentally conscious consumers, further driving growth.
BY TYPE
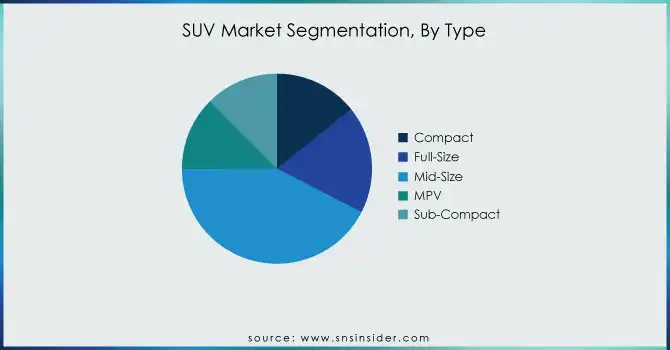
The mid-size SUVs segment accounted for a dominant market share of 42 % in global SUV market. Mid-size SUVs succeed by mixing interior space, comfort, and performance for families and even commuters seeking practicality. With seating for up to five passengers and plenty of cargo space, these SUVs tend to be just as capable of tackling a daily commute as they are a week-long road saga. Consumers across North America, Europe, and parts of Asia have taken a liking to the mid-size SUV segment thanks to their higher ride, advanced safety features, and improved fuel economy compared to full-size SUVs. Plus, mid-size SUVs span affordable and premium models, expanding their market even further.
Compact SUVs are anticipated to register the fastest growth in the market during the forecast period spanning 2024 to 2032, notably in developed regions where citizens are conscious of urban population density along with environmental concerns. Compact SUVs are built to deliver much of the benefit of larger SUVs in terms of high rides, and high cargo volume all while being cheaper, more fuel-efficient, and easier to drive in a cramped city. As electrification diverts growing attention, compact SUVs are receiving electric and hybrid models as well, making them attractive to green-minded buyers. Features like ADAS and high-tech infotainment are adding to the tech-fresh appeal of this segment while the characteristics of compact SUVs make it irresistible to younger, city-dwelling customers. Coupled with the demand for compact SUVs for superior functional, technological, and environmental offers, this combination will expand the ground for the rapidly growing compact SUV segment until 2032.
BY FUEL TYPE
Gasoline-powered SUVs easily accounted for the largest market share during 2023 as they represented about 54% of the total SUV market thanks to their ubiquity, the existing fueling infrastructure, and the fact that most consumers are familiar with internal combustion engine (ICE) vehicles. For now, gasoline SUVs are still a big market, as they offer unmatched performance and versatility wherever infrastructure hasn’t fully developed for electric charging. That dominance also contours along with consumer preference, in other areas where fuel is cheap and any incentives for electric vehicle uptake are limited. Like any SUV, though, most of these represent a compromise between power, range, and cost that's likely to appeal to traditional SUV buyers who need dependability under varied driving conditions.
Electric SUVs are projected to exhibit the highest compound annual growth rate from 2024 to 2032. This projected growth is due to a few different reasons, such as more stringent emissions standards, significant government incentives, and improved battery technology. One of the greatest attractions for consumers eventually becomes the environmental advantage of electric SUVs, in addition to lower operating costs as charging infrastructure improves across the world. Automakers are pouring resources into electric SUV models with long ranges, rapid charging, and low prices, opening up electric vehicles to a much wider range of buyers. Driving this transition will be mostly in Europe and the Asia-Pacific as philosophies around greener energy policies mature with consumers in these regions.
BY PROPULSION
In 2023, ICE vehicles dominated the SUV space with a 63% market share. Their prevalence is due to availability, general consumer understanding, and the existing fueling infrastructure for gas/diesel cars, particularly in areas where EV charging networks are still nascent. In markets with relatively low fuel costs and less stringent emissions regulations, however, ICE SUVs have always been appreciated for their power, performance, and range provide any basis for serious criticism. However, ICE SUVs remain the choice to serve a wide base of SUV buyers due to their reliability, all-purpose versatility, and lower initial costs than electric SUV models.
Electric vehicles are expected to be the fastest-growing segment from 2024 to 2032, with a high compound annual growth rate. This progress is fueled by stricter emission regulations, rising government incentives, and fast-paced developments in EV technology: major advancements in battery efficiency and charging speed. With more availability of EVs from manufacturers and increasing infrastructure, many consumers will likely make the transition to electrified sport-utility vehicles given their nominal operating costs and greenness. We anticipate that electric SUVs will experience robust demand in several regions around the world, including Europe, North America, and parts of Asia-Pacific, with regional emissions targets and changing passenger vehicle buying behaviors combined to create a completely new automotive landscape. It also puts electric SUVs at the center of the electric vehicle growth story in the industry over the next ten years.
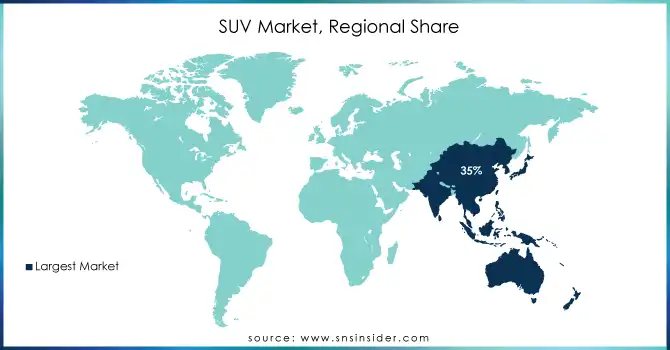
The Asia-Pacific region led the global SUV market in 2023 with 35% market share. The increase mainly relates to the economic prosperity growth, urbanization, and middle-class rise in countries like China, India, and Japan. Demand for the compact and mid-size SUV segments is robust in the region, in part due to a sustainable automotive manufacturing base within the region, a major contributor to market dominance. Meanwhile, in China, the world's biggest automotive market, local brands such as Geely and BYD are taking advantage of the rising preference for SUVs, especially among nano-eco-conscious consumers, to market China’s ecologically aware consumer base. India, on the other hand, is seeing a rise in affordability, practicality, and the start of adoption of EVs with vehicles such as the Tata Nexon and Mahindra XUV700.
North America is projected to grow with the rapidest-growing CAGR between 2024 to 2032, owing to both consumer demand and technology acceleration in the SUV segment. Incentives from governments, along with changing consumer demand for sustainable, high-performing vehicles, result in the quick shift to larger SUVs and EV variants within the regions. This trend is especially taking shape in the United States, where automakers like Ford and General Motors (GM) have debuted electric SUVs like the Ford Mustang Mach-E and Chevrolet Equinox EV. The spread of charging infrastructure and the increasing cost of fuel are making EVs a more tempting proposition for North American buyers. Whereas new SUV all-electric remain in their infancy, traditional SUVs are becoming extremely popular making sure a dual purpose for growth via North America as a region to end up being in tow with it.
Get Customized Report as per Your Business Requirement - Enquiry Now
Some of the major players in the SUV Market are:
Toyota (RAV4, Highlander)
Honda (CR-V, Pilot)
Ford (Explorer, Escape)
Chevrolet (Tahoe, Equinox)
Hyundai (Tucson, Santa Fe)
Nissan (Rogue, Pathfinder)
BMW (X5, X3)
Mercedes-Benz (GLC, GLE)
Jeep (Cherokee, Grand Cherokee)
Kia (Sorento, Sportage)
Audi (Q5, Q7)
Volkswagen (Tiguan, Atlas)
Subaru (Outback, Forester)
Mazda (CX-5, CX-9)
Porsche (Cayenne, Macan)
Land Rover (Range Rover, Defender)
GMC (Yukon, Terrain)
Ram (1500, 2500)
Mitsubishi (Outlander, Eclipse Cross)
Volvo (XC60, XC90)
ArcelorMittal
BASF
Alcoa
Toray Industries
Saint-Gobain
3M
DuPont
SABIC
Magna International
Nippon Steel Corporation
In November 2024, Škoda Auto India unveiled the Škoda Kylaq, its first model in the popular sub-4-metre SUV segment, which comprises nearly 50% of India's car sales. The Kylaq features Škoda’s new Modern Solid design language, catering to the growing demand for compact SUVs in the country.
In November 2024, Mahindra & Mahindra Ltd. achieved its highest-ever SUV sales in India, with 54,504 vehicles sold in the domestic market. This milestone underscores the growing demand for Mahindra’s SUVs, further solidifying its leadership in the segment.
In November 2024, Kia India unveiled its highly anticipated SUV, Kia Syros, blending bold design, advanced technology, and mythological heritage.
Report Attributes | Details |
---|---|
Market Size in 2023 | USD 873.98 Billion |
Market Size by 2032 | USD 1549.42 Billion |
CAGR | CAGR of 6.60% From 2024 to 2032 |
Base Year | 2023 |
Forecast Period | 2024-2032 |
Historical Data | 2020-2022 |
Report Scope & Coverage | Market Size, Segments Analysis, Competitive Landscape, Regional Analysis, DROC & SWOT Analysis, Forecast Outlook |
Key Segments | • by Seating Capacity (5-Seater, >5-Seater) • by Type (Compact, Full-Size, Mid-Size, MPV, Sub-Compact) • by Fuel Type (Gasoline, Diesel, Electric SUV) • by Propulsion (Electric Vehicles, Hybrid (HEV, PHEV), Internal Combustion Engine) |
Regional Analysis/Coverage | North America (US, Canada, Mexico), Europe (Eastern Europe [Poland, Romania, Hungary, Turkey, Rest of Eastern Europe] Western Europe] Germany, France, UK, Italy, Spain, Netherlands, Switzerland, Austria, Rest of Western Europe]), Asia Pacific (China, India, Japan, South Korea, Vietnam, Singapore, Australia, Rest of Asia Pacific), Middle East & Africa (Middle East [UAE, Egypt, Saudi Arabia, Qatar, Rest of Middle East], Africa [Nigeria, South Africa, Rest of Africa], Latin America (Brazil, Argentina, Colombia, Rest of Latin America) |
Company Profiles | Toyota, Honda, Ford, Chevrolet, Hyundai, Nissan, BMW, Mercedes-Benz, Jeep, Kia, Audi, Volkswagen, Subaru, Mazda, Porsche, Land Rover, GMC, Ram, Mitsubishi, Volvo. |
Key Drivers | • SUV Growth Driven by Active Lifestyles and Road Trips as Consumers Seek Versatile All-Purpose Vehicles • SUVs Drive Growth with Digitalization and Advanced Safety Features Meeting Consumer Demand for Tech Integration |
Restraints | • The SUV Market Faces Environmental and Urbanization Challenges Driving the Need for Cleaner Models and Compact Alternatives |
Ans: The SUV Market is expected to grow at a CAGR of 6.60% during 2024-2032.
Ans: SUV Market size was USD 873.98 billion in 2023 and is expected to Reach USD 1549.42 billion by 2032.
Ans: The major growth factor of the SUV market is the increasing consumer preference for versatility, higher driving positions, and advanced safety features, combined with rising demand for compact and eco-friendly models, including electric and hybrid variants.
Ans: The Mid-Size segment dominated the SUV Market in 2023.
Ans: Asia Pacific dominated the SUV Market in 2023.
Table of Contents
1. Introduction
1.1 Market Definition
1.2 Scope (Inclusion and Exclusions)
1.3 Research Assumptions
2. Executive Summary
2.1 Market Overview
2.2 Regional Synopsis
2.3 Competitive Summary
3. Research Methodology
3.1 Top-Down Approach
3.2 Bottom-up Approach
3.3. Data Validation
3.4 Primary Interviews
4. Market Dynamics Impact Analysis
4.1 Market Driving Factors Analysis
4.1.1 Drivers
4.1.2 Restraints
4.1.3 Opportunities
4.1.4 Challenges
4.2 PESTLE Analysis
4.3 Porter’s Five Forces Model
5. Statistical Insights and Trends Reporting
5.1 SUV by Brand and Model (2023)
5.2 SUV Customer Demographics (2023)
5.3 SUV Consumer Preferences for SUV Features
5.4 SUV Technological Advancements
5.5 SUV Fuel Efficiency and Environmental Impact
6. Competitive Landscape
6.1 List of Major Companies, By Region
6.2 Market Share Analysis, By Region
6.3 Product Benchmarking
6.3.1 Product specifications and features
6.3.2 Pricing
6.4 Strategic Initiatives
6.4.1 Marketing and promotional activities
6.4.2 Distribution and Supply Chain Strategies
6.4.3 Expansion plans and new product launches
6.4.4 Strategic partnerships and collaborations
6.5 Technological Advancements
6.6 Market Positioning and Branding
7. SUV Market Segmentation, by Seating Capacity
7.1 Chapter Overview
7.2 5-Seater
7.2.1 5-Seater Market Trends Analysis (2020-2032)
7.2.2 5-Seater Market Size Estimates and Forecasts to 2032 (USD Billion)
7.3 >5-Seater
7.3.1 >5-Seater Market Trends Analysis (2020-2032)
7.3.2 >5-Seater Market Size Estimates and Forecasts to 2032 (USD Billion)
8. SUV Market Segmentation, By Type
8.1 Chapter Overview
8.2 Compact
8.2.1 Compact Market Trends Analysis (2020-2032)
8.2.2 Compact Market Size Estimates and Forecasts to 2032 (USD Billion)
8.3 Full-Size
8.3.1 Full-Size Market Trends Analysis (2020-2032)
8.3.2 Full-Size Market Size Estimates and Forecasts to 2032 (USD Billion)
8.4 Mid-Size
8.4.1 Mid-Size Market Trends Analysis (2020-2032)
8.4.2 Mid-Size Market Size Estimates and Forecasts to 2032 (USD Billion)
8.5 MPV
8.5.1 MPV Market Trends Analysis (2020-2032)
8.5.2 MPV Market Size Estimates and Forecasts to 2032 (USD Billion)
8.6 Sub-Compact
8.6.1 Sub-Compact Market Trends Analysis (2020-2032)
8.6.2 Sub-Compact Market Size Estimates and Forecasts to 2032 (USD Billion)
9. SUV Market Segmentation, By Fuel Type
9.1 Chapter Overview
9.2 Gasoline
9.2.1 Gasoline Market Trends Analysis (2020-2032)
9.2.2 Gasoline Market Size Estimates and Forecasts to 2032 (USD Billion)
9.3 Diesel
9.3.1 Diesel Market Trends Analysis (2020-2032)
9.3.2 Diesel Market Size Estimates and Forecasts to 2032 (USD Billion)
9.4 Electric SUV
9.4.1 Electric SUV Market Trends Analysis (2020-2032)
9.4.2 Electric SUV Market Size Estimates and Forecasts to 2032 (USD Billion)
10. SUV Market Segmentation, by Propulsion
10.1 Chapter Overview
10.2 Electric Vehicles
10.2.1 Electric Vehicles Market Trends Analysis (2020-2032)
10.2.2 Electric Vehicles Market Size Estimates and Forecasts to 2032 (USD Billion)
10.3 Hybrid (HEV, PHEV)
10.3.1 Hybrid (HEV, PHEV) Market Trends Analysis (2020-2032)
10.3.2 Hybrid (HEV, PHEV) Market Size Estimates and Forecasts to 2032 (USD Billion)
10.4 Internal Combustion Engine
10.4.1 Internal Combustion Engine Market Trends Analysis (2020-2032)
10.4.2 Internal Combustion Engine Market Size Estimates and Forecasts to 2032 (USD Billion)
11. Regional Analysis
11.1 Chapter Overview
11.2 North America
11.2.1 Trends Analysis
11.2.2 North America SUV Market Estimates and Forecasts, by Country (2020-2032) (USD Billion)
11.2.3 North America SUV Market Estimates and Forecasts, by Seating Capacity (2020-2032) (USD Billion)
11.2.4 North America SUV Market Estimates and Forecasts, By Type (2020-2032) (USD Billion)
11.2.5 North America SUV Market Estimates and Forecasts, By Fuel Type (2020-2032) (USD Billion)
11.2.6 North America SUV Market Estimates and Forecasts, by Propulsion (2020-2032) (USD Billion)
11.2.7 USA
11.2.7.1 USA SUV Market Estimates and Forecasts, by Seating Capacity (2020-2032) (USD Billion)
11.2.7.2 USA SUV Market Estimates and Forecasts, By Type (2020-2032) (USD Billion)
11.2.7.3 USA SUV Market Estimates and Forecasts, By Fuel Type (2020-2032) (USD Billion)
11.2.7.4 USA SUV Market Estimates and Forecasts, by Propulsion (2020-2032) (USD Billion)
11.2.8 Canada
11.2.8.1 Canada SUV Market Estimates and Forecasts, by Seating Capacity (2020-2032) (USD Billion)
11.2.8.2 Canada SUV Market Estimates and Forecasts, By Type (2020-2032) (USD Billion)
11.2.8.3 Canada SUV Market Estimates and Forecasts, By Fuel Type (2020-2032) (USD Billion)
11.2.8.4 Canada SUV Market Estimates and Forecasts, by Propulsion (2020-2032) (USD Billion)
11.2.9 Mexico
11.2.9.1 Mexico SUV Market Estimates and Forecasts, by Seating Capacity (2020-2032) (USD Billion)
11.2.9.2 Mexico SUV Market Estimates and Forecasts, By Type (2020-2032) (USD Billion)
11.2.9.3 Mexico SUV Market Estimates and Forecasts, By Fuel Type (2020-2032) (USD Billion)
11.2.9.4 Mexico SUV Market Estimates and Forecasts, by Propulsion (2020-2032) (USD Billion)
11.3 Europe
11.3.1 Eastern Europe
11.3.1.1 Trends Analysis
11.3.1.2 Eastern Europe SUV Market Estimates and Forecasts, by Country (2020-2032) (USD Billion)
11.3.1.3 Eastern Europe SUV Market Estimates and Forecasts, by Seating Capacity (2020-2032) (USD Billion)
11.3.1.4 Eastern Europe SUV Market Estimates and Forecasts, By Type (2020-2032) (USD Billion)
11.3.1.5 Eastern Europe SUV Market Estimates and Forecasts, By Fuel Type (2020-2032) (USD Billion)
11.3.1.6 Eastern Europe SUV Market Estimates and Forecasts, by Propulsion (2020-2032) (USD Billion)
11.3.1.7 Poland
11.3.1.7.1 Poland SUV Market Estimates and Forecasts, by Seating Capacity (2020-2032) (USD Billion)
11.3.1.7.2 Poland SUV Market Estimates and Forecasts, By Type (2020-2032) (USD Billion)
11.3.1.7.3 Poland SUV Market Estimates and Forecasts, By Fuel Type (2020-2032) (USD Billion)
11.3.1.7.4 Poland SUV Market Estimates and Forecasts, by Propulsion (2020-2032) (USD Billion)
11.3.1.8 Romania
11.3.1.8.1 Romania SUV Market Estimates and Forecasts, by Seating Capacity (2020-2032) (USD Billion)
11.3.1.8.2 Romania SUV Market Estimates and Forecasts, By Type (2020-2032) (USD Billion)
11.3.1.8.3 Romania SUV Market Estimates and Forecasts, By Fuel Type (2020-2032) (USD Billion)
11.3.1.8.4 Romania SUV Market Estimates and Forecasts, by Propulsion (2020-2032) (USD Billion)
11.3.1.9 Hungary
11.3.1.9.1 Hungary SUV Market Estimates and Forecasts, by Seating Capacity (2020-2032) (USD Billion)
11.3.1.9.2 Hungary SUV Market Estimates and Forecasts, By Type (2020-2032) (USD Billion)
11.3.1.9.3 Hungary SUV Market Estimates and Forecasts, By Fuel Type (2020-2032) (USD Billion)
11.3.1.9.4 Hungary SUV Market Estimates and Forecasts, by Propulsion (2020-2032) (USD Billion)
11.3.1.10 turkey
11.3.1.10.1 Turkey SUV Market Estimates and Forecasts, by Seating Capacity (2020-2032) (USD Billion)
11.3.1.10.2 Turkey SUV Market Estimates and Forecasts, By Type (2020-2032) (USD Billion)
11.3.1.10.3 Turkey SUV Market Estimates and Forecasts, By Fuel Type (2020-2032) (USD Billion)
11.3.1.10.4 Turkey SUV Market Estimates and Forecasts, by Propulsion (2020-2032) (USD Billion)
11.3.1.11 Rest of Eastern Europe
11.3.1.11.1 Rest of Eastern Europe SUV Market Estimates and Forecasts, by Seating Capacity (2020-2032) (USD Billion)
11.3.1.11.2 Rest of Eastern Europe SUV Market Estimates and Forecasts, By Type (2020-2032) (USD Billion)
11.3.1.11.3 Rest of Eastern Europe SUV Market Estimates and Forecasts, By Fuel Type (2020-2032) (USD Billion)
11.3.1.11.4 Rest of Eastern Europe SUV Market Estimates and Forecasts, by Propulsion (2020-2032) (USD Billion)
11.3.2 Western Europe
11.3.2.1 Trends Analysis
11.3.2.2 Western Europe SUV Market Estimates and Forecasts, by Country (2020-2032) (USD Billion)
11.3.2.3 Western Europe SUV Market Estimates and Forecasts, by Seating Capacity (2020-2032) (USD Billion)
11.3.2.4 Western Europe SUV Market Estimates and Forecasts, By Type (2020-2032) (USD Billion)
11.3.2.5 Western Europe SUV Market Estimates and Forecasts, By Fuel Type (2020-2032) (USD Billion)
11.3.2.6 Western Europe SUV Market Estimates and Forecasts, by Propulsion (2020-2032) (USD Billion)
11.3.2.7 Germany
11.3.2.7.1 Germany SUV Market Estimates and Forecasts, by Seating Capacity (2020-2032) (USD Billion)
11.3.2.7.2 Germany SUV Market Estimates and Forecasts, By Type (2020-2032) (USD Billion)
11.3.2.7.3 Germany SUV Market Estimates and Forecasts, By Fuel Type (2020-2032) (USD Billion)
11.3.2.7.4 Germany SUV Market Estimates and Forecasts, by Propulsion (2020-2032) (USD Billion)
11.3.2.8 France
11.3.2.8.1 France SUV Market Estimates and Forecasts, by Seating Capacity (2020-2032) (USD Billion)
11.3.2.8.2 France SUV Market Estimates and Forecasts, By Type (2020-2032) (USD Billion)
11.3.2.8.3 France SUV Market Estimates and Forecasts, By Fuel Type (2020-2032) (USD Billion)
11.3.2.8.4 France SUV Market Estimates and Forecasts, by Propulsion (2020-2032) (USD Billion)
11.3.2.9 UK
11.3.2.9.1 UK SUV Market Estimates and Forecasts, by Seating Capacity (2020-2032) (USD Billion)
11.3.2.9.2 UK SUV Market Estimates and Forecasts, By Type (2020-2032) (USD Billion)
11.3.2.9.3 UK SUV Market Estimates and Forecasts, By Fuel Type (2020-2032) (USD Billion)
11.3.2.9.4 UK SUV Market Estimates and Forecasts, by Propulsion (2020-2032) (USD Billion)
11.3.2.10 Italy
11.3.2.10.1 Italy SUV Market Estimates and Forecasts, by Seating Capacity (2020-2032) (USD Billion)
11.3.2.10.2 Italy SUV Market Estimates and Forecasts, By Type (2020-2032) (USD Billion)
11.3.2.10.3 Italy SUV Market Estimates and Forecasts, By Fuel Type (2020-2032) (USD Billion)
11.3.2.10.4 Italy SUV Market Estimates and Forecasts, by Propulsion (2020-2032) (USD Billion)
11.3.2.11 Spain
11.3.2.11.1 Spain SUV Market Estimates and Forecasts, by Seating Capacity (2020-2032) (USD Billion)
11.3.2.11.2 Spain SUV Market Estimates and Forecasts, By Type (2020-2032) (USD Billion)
11.3.2.11.3 Spain SUV Market Estimates and Forecasts, By Fuel Type (2020-2032) (USD Billion)
11.3.2.11.4 Spain SUV Market Estimates and Forecasts, by Propulsion (2020-2032) (USD Billion)
11.3.2.12 Netherlands
11.3.2.12.1 Netherlands SUV Market Estimates and Forecasts, by Seating Capacity (2020-2032) (USD Billion)
11.3.2.12.2 Netherlands SUV Market Estimates and Forecasts, By Type (2020-2032) (USD Billion)
11.3.2.12.3 Netherlands SUV Market Estimates and Forecasts, By Fuel Type (2020-2032) (USD Billion)
11.3.2.12.4 Netherlands SUV Market Estimates and Forecasts, by Propulsion (2020-2032) (USD Billion)
11.3.2.13 Switzerland
11.3.2.13.1 Switzerland SUV Market Estimates and Forecasts, by Seating Capacity (2020-2032) (USD Billion)
11.3.2.13.2 Switzerland SUV Market Estimates and Forecasts, By Type (2020-2032) (USD Billion)
11.3.2.13.3 Switzerland SUV Market Estimates and Forecasts, By Fuel Type (2020-2032) (USD Billion)
11.3.2.13.4 Switzerland SUV Market Estimates and Forecasts, by Propulsion (2020-2032) (USD Billion)
11.3.2.14 Austria
11.3.2.14.1 Austria SUV Market Estimates and Forecasts, by Seating Capacity (2020-2032) (USD Billion)
11.3.2.14.2 Austria SUV Market Estimates and Forecasts, By Type (2020-2032) (USD Billion)
11.3.2.14.3 Austria SUV Market Estimates and Forecasts, By Fuel Type (2020-2032) (USD Billion)
11.3.2.14.4 Austria SUV Market Estimates and Forecasts, by Propulsion (2020-2032) (USD Billion)
11.3.2.15 Rest of Western Europe
11.3.2.15.1 Rest of Western Europe SUV Market Estimates and Forecasts, by Seating Capacity (2020-2032) (USD Billion)
11.3.2.15.2 Rest of Western Europe SUV Market Estimates and Forecasts, By Type (2020-2032) (USD Billion)
11.3.2.15.3 Rest of Western Europe SUV Market Estimates and Forecasts, By Fuel Type (2020-2032) (USD Billion)
11.3.2.15.4 Rest of Western Europe SUV Market Estimates and Forecasts, by Propulsion (2020-2032) (USD Billion)
11.4 Asia Pacific
11.4.1 Trends Analysis
11.4.2 Asia Pacific SUV Market Estimates and Forecasts, by Country (2020-2032) (USD Billion)
11.4.3 Asia Pacific SUV Market Estimates and Forecasts, by Seating Capacity (2020-2032) (USD Billion)
11.4.4 Asia Pacific SUV Market Estimates and Forecasts, By Type (2020-2032) (USD Billion)
11.4.5 Asia Pacific SUV Market Estimates and Forecasts, By Fuel Type (2020-2032) (USD Billion)
11.4.6 Asia Pacific SUV Market Estimates and Forecasts, by Propulsion (2020-2032) (USD Billion)
11.4.7 China
11.4.7.1 China SUV Market Estimates and Forecasts, by Seating Capacity (2020-2032) (USD Billion)
11.4.7.2 China SUV Market Estimates and Forecasts, By Type (2020-2032) (USD Billion)
11.4.7.3 China SUV Market Estimates and Forecasts, By Fuel Type (2020-2032) (USD Billion)
11.4.7.4 China SUV Market Estimates and Forecasts, by Propulsion (2020-2032) (USD Billion)
11.4.8 India
11.4.8.1 India SUV Market Estimates and Forecasts, by Seating Capacity (2020-2032) (USD Billion)
11.4.8.2 India SUV Market Estimates and Forecasts, By Type (2020-2032) (USD Billion)
11.4.8.3 India SUV Market Estimates and Forecasts, By Fuel Type (2020-2032) (USD Billion)
11.4.8.4 India SUV Market Estimates and Forecasts, by Propulsion (2020-2032) (USD Billion)
11.4.9 Japan
11.4.9.1 Japan SUV Market Estimates and Forecasts, by Seating Capacity (2020-2032) (USD Billion)
11.4.9.2 Japan SUV Market Estimates and Forecasts, By Type (2020-2032) (USD Billion)
11.4.9.3 Japan SUV Market Estimates and Forecasts, By Fuel Type (2020-2032) (USD Billion)
11.4.9.4 Japan SUV Market Estimates and Forecasts, by Propulsion (2020-2032) (USD Billion)
11.4.10 South Korea
11.4.10.1 South Korea SUV Market Estimates and Forecasts, by Seating Capacity (2020-2032) (USD Billion)
11.4.10.2 South Korea SUV Market Estimates and Forecasts, By Type (2020-2032) (USD Billion)
11.4.10.3 South Korea SUV Market Estimates and Forecasts, By Fuel Type (2020-2032) (USD Billion)
11.4.10.4 South Korea SUV Market Estimates and Forecasts, by Propulsion (2020-2032) (USD Billion)
11.4.11 Vietnam
11.4.11.1 Vietnam SUV Market Estimates and Forecasts, by Seating Capacity (2020-2032) (USD Billion)
11.4.11.2 Vietnam SUV Market Estimates and Forecasts, By Type (2020-2032) (USD Billion)
11.4.11.3 Vietnam SUV Market Estimates and Forecasts, By Fuel Type (2020-2032) (USD Billion)
11.4.11.4 Vietnam SUV Market Estimates and Forecasts, by Propulsion (2020-2032) (USD Billion)
11.4.12 Singapore
11.4.12.1 Singapore SUV Market Estimates and Forecasts, by Seating Capacity (2020-2032) (USD Billion)
11.4.12.2 Singapore SUV Market Estimates and Forecasts, By Type (2020-2032) (USD Billion)
11.4.12.3 Singapore SUV Market Estimates and Forecasts, By Fuel Type (2020-2032) (USD Billion)
11.4.12.4 Singapore SUV Market Estimates and Forecasts, by Propulsion (2020-2032) (USD Billion)
11.4.13 Australia
11.4.13.1 Australia SUV Market Estimates and Forecasts, by Seating Capacity (2020-2032) (USD Billion)
11.4.13.2 Australia SUV Market Estimates and Forecasts, By Type (2020-2032) (USD Billion)
11.4.13.3 Australia SUV Market Estimates and Forecasts, By Fuel Type (2020-2032) (USD Billion)
11.4.13.4 Australia SUV Market Estimates and Forecasts, by Propulsion (2020-2032) (USD Billion)
11.4.14 Rest of Asia Pacific
11.4.14.1 Rest of Asia Pacific SUV Market Estimates and Forecasts, by Seating Capacity (2020-2032) (USD Billion)
11.4.14.2 Rest of Asia Pacific SUV Market Estimates and Forecasts, By Type (2020-2032) (USD Billion)
11.4.14.3 Rest of Asia Pacific SUV Market Estimates and Forecasts, By Fuel Type (2020-2032) (USD Billion)
11.4.14.4 Rest of Asia Pacific SUV Market Estimates and Forecasts, by Propulsion (2020-2032) (USD Billion)
11.5 Middle East and Africa
11.5.1 Middle East
11.5.1.1 Trends Analysis
11.5.1.2 Middle East SUV Market Estimates and Forecasts, by Country (2020-2032) (USD Billion)
11.5.1.3 Middle East SUV Market Estimates and Forecasts, by Seating Capacity (2020-2032) (USD Billion)
11.5.1.4 Middle East SUV Market Estimates and Forecasts, By Type (2020-2032) (USD Billion)
11.5.1.5 Middle East SUV Market Estimates and Forecasts, By Fuel Type (2020-2032) (USD Billion)
11.5.1.6 Middle East SUV Market Estimates and Forecasts, by Propulsion (2020-2032) (USD Billion)
11.5.1.7 UAE
11.5.1.7.1 UAE SUV Market Estimates and Forecasts, by Seating Capacity (2020-2032) (USD Billion)
11.5.1.7.2 UAE SUV Market Estimates and Forecasts, By Type (2020-2032) (USD Billion)
11.5.1.7.3 UAE SUV Market Estimates and Forecasts, By Fuel Type (2020-2032) (USD Billion)
11.5.1.7.4 UAE SUV Market Estimates and Forecasts, by Propulsion (2020-2032) (USD Billion)
11.5.1.8 Egypt
11.5.1.8.1 Egypt SUV Market Estimates and Forecasts, by Seating Capacity (2020-2032) (USD Billion)
11.5.1.8.2 Egypt SUV Market Estimates and Forecasts, By Type (2020-2032) (USD Billion)
11.5.1.8.3 Egypt SUV Market Estimates and Forecasts, By Fuel Type (2020-2032) (USD Billion)
11.5.1.8.4 Egypt SUV Market Estimates and Forecasts, by Propulsion (2020-2032) (USD Billion)
11.5.1.9 Saudi Arabia
11.5.1.9.1 Saudi Arabia SUV Market Estimates and Forecasts, by Seating Capacity (2020-2032) (USD Billion)
11.5.1.9.2 Saudi Arabia SUV Market Estimates and Forecasts, By Type (2020-2032) (USD Billion)
11.5.1.9.3 Saudi Arabia SUV Market Estimates and Forecasts, By Fuel Type (2020-2032) (USD Billion)
11.5.1.9.4 Saudi Arabia SUV Market Estimates and Forecasts, by Propulsion (2020-2032) (USD Billion)
11.5.1.10 Qatar
11.5.1.10.1 Qatar SUV Market Estimates and Forecasts, by Seating Capacity (2020-2032) (USD Billion)
11.5.1.10.2 Qatar SUV Market Estimates and Forecasts, By Type (2020-2032) (USD Billion)
11.5.1.10.3 Qatar SUV Market Estimates and Forecasts, By Fuel Type (2020-2032) (USD Billion)
11.5.1.10.4 Qatar SUV Market Estimates and Forecasts, by Propulsion (2020-2032) (USD Billion)
11.5.1.11 Rest of Middle East
11.5.1.11.1 Rest of Middle East SUV Market Estimates and Forecasts, by Seating Capacity (2020-2032) (USD Billion)
11.5.1.11.2 Rest of Middle East SUV Market Estimates and Forecasts, By Type (2020-2032) (USD Billion)
11.5.1.11.3 Rest of Middle East SUV Market Estimates and Forecasts, By Fuel Type (2020-2032) (USD Billion)
11.5.1.11.4 Rest of Middle East SUV Market Estimates and Forecasts, by Propulsion (2020-2032) (USD Billion)
11.5.2 Africa
11.5.2.1 Trends Analysis
11.5.2.2 Africa SUV Market Estimates and Forecasts, by Country (2020-2032) (USD Billion)
11.5.2.3 Africa SUV Market Estimates and Forecasts, by Seating Capacity (2020-2032) (USD Billion)
11.5.2.4 Africa SUV Market Estimates and Forecasts, By Type (2020-2032) (USD Billion)
11.5.2.5 Africa SUV Market Estimates and Forecasts, By Fuel Type (2020-2032) (USD Billion)
11.5.2.6 Africa SUV Market Estimates and Forecasts, by Propulsion (2020-2032) (USD Billion)
11.5.2.7 South Africa
11.5.2.7.1 South Africa SUV Market Estimates and Forecasts, by Seating Capacity (2020-2032) (USD Billion)
11.5.2.7.2 South Africa SUV Market Estimates and Forecasts, By Type (2020-2032) (USD Billion)
11.5.2.7.3 South Africa SUV Market Estimates and Forecasts, By Fuel Type (2020-2032) (USD Billion)
11.5.2.7.4 South Africa SUV Market Estimates and Forecasts, by Propulsion (2020-2032) (USD Billion)
11.5.2.8 Nigeria
11.5.2.8.1 Nigeria SUV Market Estimates and Forecasts, by Seating Capacity (2020-2032) (USD Billion)
11.5.2.8.2 Nigeria SUV Market Estimates and Forecasts, By Type (2020-2032) (USD Billion)
11.5.2.8.3 Nigeria SUV Market Estimates and Forecasts, By Fuel Type (2020-2032) (USD Billion)
11.5.2.8.4 Nigeria SUV Market Estimates and Forecasts, by Propulsion (2020-2032) (USD Billion)
11.5.2.9 Rest of Africa
11.5.2.9.1 Rest of Africa SUV Market Estimates and Forecasts, by Seating Capacity (2020-2032) (USD Billion)
11.5.2.9.2 Rest of Africa SUV Market Estimates and Forecasts, By Type (2020-2032) (USD Billion)
11.5.2.9.3 Rest of Africa SUV Market Estimates and Forecasts, By Fuel Type (2020-2032) (USD Billion)
11.5.2.9.4 Rest of Africa SUV Market Estimates and Forecasts, by Propulsion (2020-2032) (USD Billion)
11.6 Latin America
11.6.1 Trends Analysis
11.6.2 Latin America SUV Market Estimates and Forecasts, by Country (2020-2032) (USD Billion)
11.6.3 Latin America SUV Market Estimates and Forecasts, by Seating Capacity (2020-2032) (USD Billion)
11.6.4 Latin America SUV Market Estimates and Forecasts, By Type (2020-2032) (USD Billion)
11.6.5 Latin America SUV Market Estimates and Forecasts, By Fuel Type (2020-2032) (USD Billion)
11.6.6 Latin America SUV Market Estimates and Forecasts, by Propulsion (2020-2032) (USD Billion)
11.6.7 Brazil
11.6.7.1 Brazil SUV Market Estimates and Forecasts, by Seating Capacity (2020-2032) (USD Billion)
11.6.7.2 Brazil SUV Market Estimates and Forecasts, By Type (2020-2032) (USD Billion)
11.6.7.3 Brazil SUV Market Estimates and Forecasts, By Fuel Type (2020-2032) (USD Billion)
11.6.7.4 Brazil SUV Market Estimates and Forecasts, by Propulsion (2020-2032) (USD Billion)
11.6.8 Argentina
11.6.8.1 Argentina SUV Market Estimates and Forecasts, by Seating Capacity (2020-2032) (USD Billion)
11.6.8.2 Argentina SUV Market Estimates and Forecasts, By Type (2020-2032) (USD Billion)
11.6.8.3 Argentina SUV Market Estimates and Forecasts, By Fuel Type (2020-2032) (USD Billion)
11.6.8.4 Argentina SUV Market Estimates and Forecasts, by Propulsion (2020-2032) (USD Billion)
11.6.9 Colombia
11.6.9.1 Colombia SUV Market Estimates and Forecasts, by Seating Capacity (2020-2032) (USD Billion)
11.6.9.2 Colombia SUV Market Estimates and Forecasts, By Type (2020-2032) (USD Billion)
11.6.9.3 Colombia SUV Market Estimates and Forecasts, By Fuel Type (2020-2032) (USD Billion)
11.6.9.4 Colombia SUV Market Estimates and Forecasts, by Propulsion (2020-2032) (USD Billion)
11.6.10 Rest of Latin America
11.6.10.1 Rest of Latin America SUV Market Estimates and Forecasts, by Seating Capacity (2020-2032) (USD Billion)
11.6.10.2 Rest of Latin America SUV Market Estimates and Forecasts, By Type (2020-2032) (USD Billion)
11.6.10.3 Rest of Latin America SUV Market Estimates and Forecasts, By Fuel Type (2020-2032) (USD Billion)
11.6.10.4 Rest of Latin America SUV Market Estimates and Forecasts, by Propulsion (2020-2032) (USD Billion)
12. Company Profiles
12.1 Toyota
12.1.1 Company Overview
12.1.2 Financial
12.1.3 Products/ Services Offered
12.1.4 SWOT Analysis
12.2 Honda
12.2.1 Company Overview
12.2.2 Financial
12.2.3 Products/ Services Offered
12.2.4 SWOT Analysis
12.3 Ford
12.3.1 Company Overview
12.3.2 Financial
12.3.3 Products/ Services Offered
12.3.4 SWOT Analysis
12.4 Chevrolet
12.4.1 Company Overview
12.4.2 Financial
12.4.3 Products/ Services Offered
12.4.4 SWOT Analysis
12.5 Hyundai
12.5.1 Company Overview
12.5.2 Financial
12.5.3 Products/ Services Offered
12.5.4 SWOT Analysis
12.6 Nissan
12.6.1 Company Overview
12.6.2 Financial
12.6.3 Products/ Services Offered
12.6.4 SWOT Analysis
12.7 BMW
12.7.1 Company Overview
12.7.2 Financial
12.7.3 Products/ Services Offered
12.7.4 SWOT Analysis
12.8 Mercedes-Benz
12.8.1 Company Overview
12.8.2 Financial
12.8.3 Products/ Services Offered
12.8.4 SWOT Analysis
12.9 Jeep
12.9.1 Company Overview
12.9.2 Financial
12.9.3 Products/ Services Offered
12.9.4 SWOT Analysis
12.10 Kia
12.10.1 Company Overview
12.10.2 Financial
12.10.3 Products/ Services Offered
12.10.4 SWOT Analysis
13. Use Cases and Best Practices
14. Conclusion
An accurate research report requires proper strategizing as well as implementation. There are multiple factors involved in the completion of good and accurate research report and selecting the best methodology to compete the research is the toughest part. Since the research reports we provide play a crucial role in any company’s decision-making process, therefore we at SNS Insider always believe that we should choose the best method which gives us results closer to reality. This allows us to reach at a stage wherein we can provide our clients best and accurate investment to output ratio.
Each report that we prepare takes a timeframe of 350-400 business hours for production. Starting from the selection of titles through a couple of in-depth brain storming session to the final QC process before uploading our titles on our website we dedicate around 350 working hours. The titles are selected based on their current market cap and the foreseen CAGR and growth.
The 5 steps process:
Step 1: Secondary Research:
Secondary Research or Desk Research is as the name suggests is a research process wherein, we collect data through the readily available information. In this process we use various paid and unpaid databases which our team has access to and gather data through the same. This includes examining of listed companies’ annual reports, Journals, SEC filling etc. Apart from this our team has access to various associations across the globe across different industries. Lastly, we have exchange relationships with various university as well as individual libraries.
Step 2: Primary Research
When we talk about primary research, it is a type of study in which the researchers collect relevant data samples directly, rather than relying on previously collected data. This type of research is focused on gaining content specific facts that can be sued to solve specific problems. Since the collected data is fresh and first hand therefore it makes the study more accurate and genuine.
We at SNS Insider have divided Primary Research into 2 parts.
Part 1 wherein we interview the KOLs of major players as well as the upcoming ones across various geographic regions. This allows us to have their view over the market scenario and acts as an important tool to come closer to the accurate market numbers. As many as 45 paid and unpaid primary interviews are taken from both the demand and supply side of the industry to make sure we land at an accurate judgement and analysis of the market.
This step involves the triangulation of data wherein our team analyses the interview transcripts, online survey responses and observation of on filed participants. The below mentioned chart should give a better understanding of the part 1 of the primary interview.
Part 2: In this part of primary research the data collected via secondary research and the part 1 of the primary research is validated with the interviews from individual consultants and subject matter experts.
Consultants are those set of people who have at least 12 years of experience and expertise within the industry whereas Subject Matter Experts are those with at least 15 years of experience behind their back within the same space. The data with the help of two main processes i.e., FGDs (Focused Group Discussions) and IDs (Individual Discussions). This gives us a 3rd party nonbiased primary view of the market scenario making it a more dependable one while collation of the data pointers.
Step 3: Data Bank Validation
Once all the information is collected via primary and secondary sources, we run that information for data validation. At our intelligence centre our research heads track a lot of information related to the market which includes the quarterly reports, the daily stock prices, and other relevant information. Our data bank server gets updated every fortnight and that is how the information which we collected using our primary and secondary information is revalidated in real time.
Step 4: QA/QC Process
After all the data collection and validation our team does a final level of quality check and quality assurance to get rid of any unwanted or undesired mistakes. This might include but not limited to getting rid of the any typos, duplication of numbers or missing of any important information. The people involved in this process include technical content writers, research heads and graphics people. Once this process is completed the title gets uploader on our platform for our clients to read it.
Step 5: Final QC/QA Process:
This is the last process and comes when the client has ordered the study. In this process a final QA/QC is done before the study is emailed to the client. Since we believe in giving our clients a good experience of our research studies, therefore, to make sure that we do not lack at our end in any way humanly possible we do a final round of quality check and then dispatch the study to the client.
Key Segmentation
By Seating Capacity
5-Seater
>5-Seater
By Type
Compact
Full-Size
Mid-Size
MPV
Sub-Compact
By Fuel Type
Gasoline
Diesel
Electric SUV
By Propulsion
Electric Vehicles
Hybrid (HEV, PHEV)
Internal Combustion Engine
Request for Segment Customization as per your Business Requirement: Segment Customization Request
REGIONAL COVERAGE:
North America
US
Canada
Mexico
Europe
Eastern Europe
Poland
Romania
Hungary
Turkey
Rest of Eastern Europe
Western Europe
Germany
France
UK
Italy
Spain
Netherlands
Switzerland
Austria
Rest of Western Europe
Asia Pacific
China
India
Japan
South Korea
Vietnam
Singapore
Australia
Rest of Asia Pacific
Middle East & Africa
Middle East
UAE
Egypt
Saudi Arabia
Qatar
Rest of the Middle East
Africa
Nigeria
South Africa
Rest of Africa
Latin America
Brazil
Argentina
Colombia
Rest of Latin America
Request for Country Level Research Report: Country Level Customization Request
Available Customization
With the given market data, SNS Insider offers customization as per the company’s specific needs. The following customization options are available for the report:
Product Analysis
Criss-Cross segment analysis (e.g. Product X Application)
Product Matrix which gives a detailed comparison of the product portfolio of each company
Geographic Analysis
Additional countries in any of the regions
Company Information
Detailed analysis and profiling of additional market players (Up to five)
The Automatic High Beam Control Market Size was valued at USD 10.68 billion in 2023 and is expected to reach USD 18.82 billion by 2032 and grow at a CAGR of 6.5% over the forecast period 2024-2032.
The Automotive Exhaust Emission Control Device Market Size was USD 44.1 Bn in 2023 & will reach USD 64.1 Bn by 2031 & grow at a CAGR of 4.8 % by 2024-2031.
The Off-Road Motorcycle Market Size was valued at USD 15.7 billion in 2023 and is expected to reach USD 28.14 billion by 2032, growing at a CAGR of 6.7% over the forecast period 2024-2032
The Light Commercial Vehicles Market size was valued at USD 528 billion in 2023, will reach USD 847.61 billion by 2032 & grow at a CAGR of 5.4% by 2024-2032
The Skid Loaders Market size was valued at USD 10.03 billion in 2023 and is expected to reach USD 14.6 Billion by 2032, growing at a CAGR of 4.25% over the forecast period of 2024-2032.
The Automotive Virtual Exterior Mirror Market Size was $228.46 Million in 2023 & will reach to $929.64 Mn by 2032 & grow at a CAGR of 16.92% by 2024-2032.
Hi! Click one of our member below to chat on Phone