Get More Information on Surgical Imaging Market - Request Sample Report
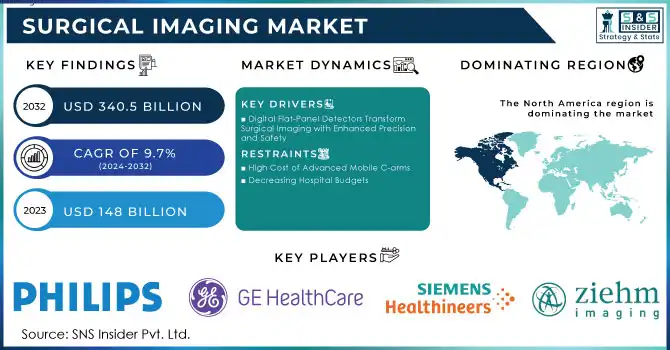
The Surgical Imaging Market was valued at USD 148 billion in 2023 and is expected to reach USD 340.5 billion by 2032 and grow at a CAGR of 9.7% over the forecast period 2024-2032.
Several key growth factors support the constantly developing global surgical imaging market. The increasing prevalence of chronic diseases, including cardiovascular conditions, cancer, orthopedic disorders, and neurological ailments, as well as a growing population of elderly patients, are among the major contributors to increased demand for advanced surgical imaging technologies. The demand is rising day-to-day as age-related conditions are usually tackled by surgery, and improvement in imaging solutions will make such surgeries more accurate. According to the WHO, a substantial 80% of the aged population will be residing in low- and middle-income economies by 2050, thus heavily increasing the requirement for medical procedures and advanced imaging.
Progress in technologies in the area is further propelling the market. Innovations in actual-time imaging, 3D visualization, and image-guided surgery improve the results of surgeries for better navigation, enhanced visualization, and more informed decision-making by surgeons. Of interest, this June, GE Healthcare's OEC 3D Imaging System made further strides in portable CBCT imaging that has continued accuracy in spine surgeries and its use in a broader anatomical range. Growing demand for surgical imaging systems in the general trend toward MIS offers benefits from fewer complications to shorter recovery periods. For instance, Joseph Spine Institute launched the MaxView 4K Video Imaging Platform in July 2023, which will improve visualization in MIS procedures and further enhance efficiency and clinical outcomes.
Advances in healthcare expenditure, particularly from developed economies, combined with increased healthcare infrastructure in developed and emerging economies, have encouraged the adoption of such advanced technologies. In addition to this, the market for surgical imaging is driven continuously by innovation and finds a constantly increasing number of acquisition deals, as companies look to make their offerings more complete and answer the ever-evolving needs of health professionals. For example, the acquisition of NXC Imaging by Canon Medical Systems in July 2022 reflects the dynamism of the industry and the emphasis on technological advancements. Surgeons are increasingly demanding minimum invasive procedures with advanced high-quality solutions, and all this can only mean one thing - constant growth in the surgical imaging market over the next decade.
Table 1: Parent Markets Related to the Surgical Imaging Market
| Parent Market | Description |
|---|---|
| Medical Imaging Market | Encompasses technologies for capturing images of the human body for clinical purposes. |
| Surgical Equipment Market | Includes all tools and devices used during surgical procedures, including imaging systems. |
| Healthcare IT Solutions Market | Focuses on software and IT solutions that support healthcare delivery and management, including imaging data management. |
| Radiology Services Market | Involves services related to diagnostic imaging, such as X-rays, MRIs, and CT scans. |
| Endoscopy Devices Market | Covers imaging devices specifically designed for minimally invasive procedures and diagnostics. |
Table 2: Trends and Innovations in the Surgical Imaging Market
| Trend/Innovation | Description |
|---|---|
| Miniaturization of Imaging Devices | Development of smaller, portable imaging devices for use in various surgical settings. |
| Integration of Imaging with Surgical Systems | Seamless integration of imaging modalities with surgical instruments and tools for enhanced visualization. |
| Enhanced Imaging Quality | Advancements in imaging technology led to higher resolution and faster image acquisition. |
| Regulatory Changes | New regulations and standards impacting the approval and use of surgical imaging devices. |
| Focus on Patient Safety | Innovations aimed at reducing radiation exposure and improving patient outcomes in surgical imaging. |
Drivers
Digital Flat-Panel Detectors Transform Surgical Imaging with Enhanced Precision and Safety
The shift from the conventional image intensifiers used in X-ray from film-based principles to digital flat-panel detectors promotes progressive surgical imaging. FPDs, therefore, are the driving force of market growth: much more advantageous than image intensifiers, with a flat design and lower radiation dose, thus better safe for patients. Furthermore, as opposed to gradually being degraded with usage over time in traditional image intensifiers, FPDs allow for high-quality digital images even after years of usage. They also offer a wider and far more dynamic range of imaging, without field of vision loss associated with intensifiers during higher magnifications.
FPD C-arms also offer a larger bore that provides more room for physicians to operate comfortably and easily maneuver instruments. They reduce distortion of the generated image and increase sensitivity, thereby enhancing patient coverage, which enhances efficiency in surgery. These features of FPDs make them maintain image quality while reducing radiation exposure. It has made them preferred tools in hospitals, which increased adoption to foster growth in the surgical imaging market. In addition, as more and more companies begin to offer FPD C-arms, these systems become less expensive, thus making them even more available for quick assimilation into healthcare facilities.
Restraints
High Cost of Advanced Mobile C-arms
Decreasing Hospital Budgets
By Modality
The C-arm surgical imaging segment held a market share of 42.5% in 2023. Mobile fluoroscopy units become an essential part of the surgical procedure, enabling surgeons to have real-time imaging, which helps enhance the visualization and patient outcome through proper guidance. The popularity of minimal interventions and advancing technologies such as flat-panel detectors and 3D imaging capabilities have helped to make C-arm systems widely popular across specialties, including orthopedics, cardiology, and trauma surgery. Portable compact C-arm development increases its accessibility in ambulatory surgical centers and smaller settings for health care. For instance, In February 2024, Royal Philips launched the Zenition 90 Motorized mobile C-arm system for image-guided therapy at the European Congress of Radiology's annual meeting, empowering surgeons to deliver superior care to a larger patient base.
Conversely, X-ray will gain the highest compound annual growth rate in the forecast period. Portable digital X-ray machines now come with high-level features, that enable technologists to rapidly obtain high-quality images. Such systems use cassettes or phosphor plates instead of film; these also afford more scope for the enhancement of image quality at an offsite workstation linked with the portable unit. Portable X-ray machines also offer results within less than 20 minutes that can be watched in real-time and thus facilitate both procedures as much as diagnostic processes.
By Application
The market was captured at 25.7% by the orthopedic and trauma segment in 2023. Orthopedic imaging technologies like X-rays, CT scans, and MRIs are essential for the diagnosis of fractures, joint injuries, and degenerative conditions, therefore allowing for accurate treatment planning and monitoring. According to the American Association for the Surgery of Trauma, injuries in the United States account for more than 150,000 deaths and nearly 3 million nonfatal injuries each year. The global industry for trauma causes more than 5 million deaths annually with hundreds of thousands more injured persons.
Key players in the market are seen to be highly investing in new product development to continue market penetration. For example, in January 2024, Orthofix Medical Inc. announced a collaboration agreement with MRI Guidance to introduce Orthofix's BoneMRI image software into the U.S. Already, this software has assisted in the completion of eight cases in conjunction with 7D's FLASH Navigation System, which uses visible light to quickly produce 3D surgical guidance images. Its camera-based technology and machine-vision algorithms make it only and uniquely faster and more efficient for spinal surgeries.
However, the cardiovascular surgeries segment is expected to achieve the highest CAGR across the forecast period. The rising incidence of cardiovascular conditions, such as cardiac arrest, and the increasing number of cardiovascular surgeries are expected to be fueling this trend. According to the American Heart Association, 23.6 million people are expected to die of cardiovascular disease in the next 10 years. This increased cardiovascular surgery is going to create a demand for surgical imaging equipment such as CT scanners, ultrasound devices, and C-arms.
By End-use
Hospitals were the largest contributor in terms of revenues, with a 39.2% share in 2023, primarily due to the incidence and prevalence of patients who suffered from ischemic and hemorrhagic stroke, brain aneurysms, traumatic brain injuries, arteriovenous malformations, cataracts, and cancer. These figures are likely to continue driving the growth of this segment. Of course, one of the most common attacks on the brain is a stroke. According to an estimate by the World Stroke Organization, one in four people who are 25 years or older would face the reality of the event at some point in their life. 13.7 million will experience their first-ever stroke each year, and the deaths that accrue from this are at 5.5 million. And this death toll is envisioned to rise without intervention to 6.7 million annually.
The growing hospital admission rates contribute positively toward the increasing surge for surgical imaging solutions. Increasing patient numbers along with new advanced technologies that are introduced into the market cause the increase in demand for hospital-based treatments. On the other hand, the ambulatory surgical centers segment is expected to achieve the highest CAGR over the projected period. This growth is based on advancements in portable and cost-effective imaging technologies, which are expanding the availability of imaging services in ASCs, particularly with an increasing number of minimally invasive surgeries being performed in these facilities. Going forward, this trend should continue to sustain the growth of the segment.
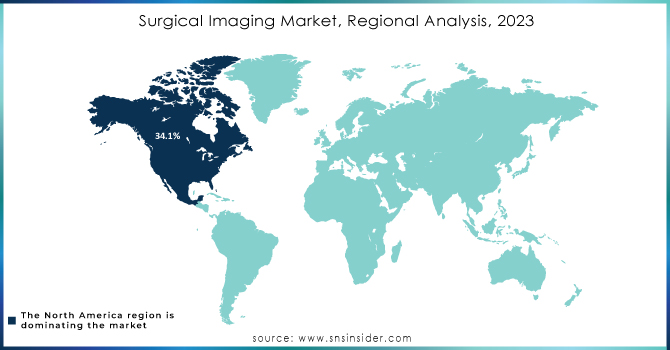
The North American surgical imaging market dominated with a global revenue share of 34.1% in 2023. High penetration of leading-edge surgical imaging technologies in primary care, easy access, and high healthcare expenditure widely propitiated by some positive reimbursement policies are the reasons behind this region's leadership. The incidence rates for chronic diseases, such as breast cancer, cardiovascular conditions, and neurological conditions, have led to increased demands for imaging analysis throughout the region. North America will also be dominating the market, with continuous technological advancements as well as rising chronic diseases following the forecast period. The U.S. is a big part of this market, as the trend indicated here ups the installations of ultrasound machines, which is gaining traction from huge deals such as that signed by GE Healthcare with St. Luke's University Health Network.
Europe also has good growth in the surgical imaging market through public as well as private investments in R&D. This increased demand for healthcare equipment, particularly due to chronic and pain-related conditions, has led to the growth of this market within the region. Growth for the market is seen in the UK, France, and Germany, mainly through factors such as healthcare reforms, government initiatives, and a good presence of SMEs in medical device manufacturing.
The region of Asia Pacific is expected to grow the fastest during the forecast period, led by the rapidly growing population and increased R&D activity in the region. Notable improvements in the demand for both traditional and advanced medical devices have been seen in countries like Japan, China, and India, where positive regulatory climates, government programs, and growth in local manufacturing capabilities are contributing factors.
Need Any Customization Research On Surgical Imaging Market - Inquiry Now
Koninklijke Philips N.V. (Azurion)
GE Healthcare (LOGIQ Series)
Siemens Healthcare GmbH (ARTIS Series)
Ziehm Imaging GmbH (Ziehm Vision)
Shimadzu Corporation (Mobius Series)
Hologic Corporation (GYN surgical imaging products)
FUJIFILM Holdings America Corporation (Fujifilm's FDR D-EVO II)
CANON MEDICAL SYSTEMS CORPORATION (Aplio Series, Vantage Series)
SAMSUNG HEALTHCARE (UGEO PT60A)
Medtronic Plc (StealthStation Surgical Navigation System)
Shenzhen Mindray Bio-Medical Electronics Co., Ltd. (DC-70 Ultrasound System, M7 and M9 Portable Ultrasound Systems), and others.
In January 2024, Probo Medical, an imaging services provider backed by private equity in Tampa, Florida, is rapidly expanding its operations through acquisitions. The company has recently reached an agreement to acquire Alpha Source Group, thereby enhancing its diagnostic imaging solutions platform.
In March 2024, SyntheticMR's new imaging solution, SyMRI 3D, received FDA clearance for clinical use in the U.S. This marks a significant advancement in quantitative MRI technology, delivering exceptional resolution and accuracy for brain imaging.
In April 2023, a medical technology company based in Seattle developed a groundbreaking surgical imaging device, which has become the first light-assisted navigation tool for spine surgery to receive FDA clearance.
| Report Attributes | Details |
|---|---|
| Market Size in 2023 | USD 148 Billion |
| Market Size by 2032 | USD 340.5 billion |
| CAGR | CAGR of 9.7% From 2024 to 2032 |
| Base Year | 2023 |
| Forecast Period | 2024-2032 |
| Historical Data | 2020-2022 |
| Report Scope & Coverage | Market Size, Segments Analysis, Competitive Landscape, Regional Analysis, DROC & SWOT Analysis, Forecast Outlook |
| Key Segments | • By Modality (C-arms, Computed Tomography, X-ray, Ultrasound) • By Application (Neurosurgeries, Cardiovascular Surgeries, Orthopedic and Trauma, Gynecological Surgeries, Thoracic Surgeries, Urological Surgeries, Others) • By End-use (Hospitals, Specialty Clinics, Ambulatory Surgical Centers, Others) |
| Regional Analysis/Coverage | North America (US, Canada, Mexico), Europe (Eastern Europe [Poland, Romania, Hungary, Turkey, Rest of Eastern Europe] Western Europe] Germany, France, UK, Italy, Spain, Netherlands, Switzerland, Austria, Rest of Western Europe]), Asia Pacific (China, India, Japan, South Korea, Vietnam, Singapore, Australia, Rest of Asia Pacific), Middle East & Africa (Middle East [UAE, Egypt, Saudi Arabia, Qatar, Rest of Middle East], Africa [Nigeria, South Africa, Rest of Africa], Latin America (Brazil, Argentina, Colombia, Rest of Latin America) |
| Company Profiles | Koninklijke Philips N.V., GE Healthcare, Siemens Healthcare GmbH, Ziehm Imaging GmbH, Shimadzu Corporation, Hologic Corporation, FUJIFILM Holdings America Corporation, CANON MEDICAL SYSTEMS CORPORATION, SAMSUNG HEALTHCARE, Medtronic Plc, Shenzhen Mindray Bio-Medical Electronics Co., Ltd. and others. |
| Key Drivers | • Digital Flat-Panel Detectors Transform Surgical Imaging with Enhanced Precision and Safety |
| Restraints | •High Cost of Advanced Mobile C-arms •Decreasing Hospital Budgets |
The estimated compound annual growth rate is 9.7% during the forecast period for the Surgical Imaging market.
The projected market value of the Surgical Imaging market is estimated at USD 148 billion in 2023 and is expected to reach USD 340.5 billion by 2032.
The digital flat-panel detectors transform surgical imaging with enhanced precision and safety.
The high cost of advanced mobile C-arms is one of the restraints on the Surgical Imaging market growth.
North America is the dominant region with a 34.1% share in the Surgical Imaging market.
Table of Contents
1. Introduction
1.1 Market Definition
1.2 Scope (Inclusion and Exclusions)
1.3 Research Assumptions
2. Executive Summary
2.1 Market Overview
2.2 Regional Synopsis
2.3 Competitive Summary
3. Research Methodology
3.1 Top-Down Approach
3.2 Bottom-up Approach
3.3. Data Validation
3.4 Primary Interviews
4. Market Dynamics Impact Analysis
4.1 Market Driving Factors Analysis
4.1.1 Drivers
4.1.2 Restraints
4.1.3 Opportunities
4.1.4 Challenges
4.2 PESTLE Analysis
4.3 Porter’s Five Forces Model
5. Statistical Insights and Trends Reporting
5.1 Incidence and Prevalence (2023)
5.2 Prescription Trends, (2023), by Region
5.3 Device Volume, by Region (2020-2032)
5.4 Imaging Scan Volume
5.5 Healthcare Spending, by Region, (Government, Commercial, Private, Out-of-Pocket), 2023
6. Competitive Landscape
6.1 List of Major Companies, By Region
6.2 Market Share Analysis, By Region
6.3 Product Benchmarking
6.3.1 Product specifications and features
6.3.2 Pricing
6.4 Strategic Initiatives
6.4.1 Marketing and promotional activities
6.4.2 Distribution and Supply Chain Strategies
6.4.3 Expansion plans and new Product launches
6.4.4 Strategic partnerships and collaborations
6.5 Technological Advancements
6.6 Market Positioning and Branding
7. Surgical Imaging Market Segmentation, by Modality
7.1 Chapter Overview
7.2 C-arms
7.2.1 C-arms Market Trends Analysis (2020-2032)
7.2.2 C-arms Market Size Estimates and Forecasts to 2032 (USD Billion)
7.3 Computed Tomography
7.3.1 Computed Tomography Market Trends Analysis (2020-2032)
7.3.2 Computed Tomography Market Size Estimates and Forecasts to 2032 (USD Billion)
7.4 X-ray
7.4.1 X-ray Market Trends Analysis (2020-2032)
7.4.2 X-ray Market Size Estimates and Forecasts to 2032 (USD Billion)
7.5 Ultrasound
7.5.1 Ultrasound Market Trends Analysis (2020-2032)
7.5.2 Ultrasound Market Size Estimates and Forecasts to 2032 (USD Billion)
8. Surgical Imaging Market Segmentation, by Application
8.1 Chapter Overview
8.2 Neurosurgeries
8.2.1 Neurosurgeries Market Trends Analysis (2020-2032)
8.2.2 Neurosurgeries Market Size Estimates and Forecasts to 2032 (USD Million)
8.3 Cardiovascular Surgeries
8.3.1 Cardiovascular Surgeries Market Trends Analysis (2020-2032)
8.3.2 Cardiovascular Surgeries Market Size Estimates and Forecasts to 2032 (USD Million)
8.4 Orthopedic and Trauma
8.4.1 Orthopedic and Trauma Market Trends Analysis (2020-2032)
8.4.2 Orthopedic and Trauma Market Size Estimates and Forecasts to 2032 (USD Million)
8.5 Gynecological Surgeries
8.5.1 Gynecological Surgeries Market Trends Analysis (2020-2032)
8.5.2 Gynecological Surgeries Market Size Estimates and Forecasts to 2032 (USD Million)
8.6 Thoracic Surgeries
8.6.1 Thoracic Surgeries Market Trends Analysis (2020-2032)
8.6.2 Thoracic Surgeries Market Size Estimates and Forecasts to 2032 (USD Million)
8.7 Urological Surgeries
8.7.1 Urological Surgeries Market Trends Analysis (2020-2032)
8.7.2 Urological Surgeries Market Size Estimates and Forecasts to 2032 (USD Million)
8.8 Others
8.8.1 Others Market Trends Analysis (2020-2032)
8.8.2 Others Market Size Estimates and Forecasts to 2032 (USD Million)
9. Surgical Imaging Market Segmentation, by End-use
9.1 Chapter Overview
9.2 Hospitals
9.2.1 Hospitals Market Trends Analysis (2020-2032)
9.2.2 Hospitals Market Size Estimates and Forecasts to 2032 (USD Million)
9.3 Specialty Clinics
9.3.1 Specialty Clinics Market Trends Analysis (2020-2032)
9.3.2 Specialty Clinics Market Size Estimates and Forecasts to 2032 (USD Million)
9.4 Ambulatory Surgical Centers
9.4.1 Ambulatory Surgical Centers Market Trends Analysis (2020-2032)
9.4.2 Ambulatory Surgical Centers Market Size Estimates and Forecasts to 2032 (USD Million)
9.5 Others
9.5.1 Others Market Trends Analysis (2020-2032)
9.5.2 Others Market Size Estimates and Forecasts to 2032 (USD Million)
10. Regional Analysis
10.1 Chapter Overview
10.2 North America
10.2.1 Trends Analysis
10.2.2 North America Surgical Imaging Market Estimates and Forecasts, by Country (2020-2032) (USD Million)
10.2.3 North America Surgical Imaging Market Estimates and Forecasts, by Modality (2020-2032) (USD Million)
10.2.4 North America Surgical Imaging Market Estimates and Forecasts, by Application (2020-2032) (USD Million)
10.2.5 North America Surgical Imaging Market Estimates and Forecasts, by End-use (2020-2032) (USD Million)
10.2.6 USA
10.2.6.1 USA Surgical Imaging Market Estimates and Forecasts, by Modality (2020-2032) (USD Million)
10.2.6.2 USA Surgical Imaging Market Estimates and Forecasts, by Application (2020-2032) (USD Million)
10.2.6.3 USA Surgical Imaging Market Estimates and Forecasts, by End-use (2020-2032) (USD Million)
10.2.7 Canada
10.2.7.1 Canada Surgical Imaging Market Estimates and Forecasts, by Modality (2020-2032) (USD Million)
10.2.7.2 Canada Surgical Imaging Market Estimates and Forecasts, by Application (2020-2032) (USD Million)
10.2.7.3 Canada Surgical Imaging Market Estimates and Forecasts, by End-use (2020-2032) (USD Million)
10.2.8 Mexico
10.2.8.1 Mexico Surgical Imaging Market Estimates and Forecasts, by Modality (2020-2032) (USD Million)
10.2.8.2 Mexico Surgical Imaging Market Estimates and Forecasts, by Application (2020-2032) (USD Million)
10.2.8.3 Mexico Surgical Imaging Market Estimates and Forecasts, by End-use (2020-2032) (USD Million)
10.3 Europe
10.3.1 Eastern Europe
10.3.1.1 Trends Analysis
10.3.1.2 Eastern Europe Surgical Imaging Market Estimates and Forecasts, by Country (2020-2032) (USD Million)
10.3.1.3 Eastern Europe Surgical Imaging Market Estimates and Forecasts, by Modality (2020-2032) (USD Million)
10.3.1.4 Eastern Europe Surgical Imaging Market Estimates and Forecasts, by Application (2020-2032) (USD Million)
10.3.1.5 Eastern Europe Surgical Imaging Market Estimates and Forecasts, by End-use (2020-2032) (USD Million)
10.3.1.6 Poland
10.3.1.6.1 Poland Surgical Imaging Market Estimates and Forecasts, by Modality (2020-2032) (USD Million)
10.3.1.6.2 Poland Surgical Imaging Market Estimates and Forecasts, by Application (2020-2032) (USD Million)
10.3.1.6.3 Poland Surgical Imaging Market Estimates and Forecasts, by End-use (2020-2032) (USD Million)
10.3.1.7 Romania
10.3.1.7.1 Romania Surgical Imaging Market Estimates and Forecasts, by Modality (2020-2032) (USD Million)
10.3.1.7.2 Romania Surgical Imaging Market Estimates and Forecasts, by Application (2020-2032) (USD Million)
10.3.1.7.3 Romania Surgical Imaging Market Estimates and Forecasts, by End-use (2020-2032) (USD Million)
10.3.1.8 Hungary
10.3.1.8.1 Hungary Surgical Imaging Market Estimates and Forecasts, by Modality (2020-2032) (USD Million)
10.3.1.8.2 Hungary Surgical Imaging Market Estimates and Forecasts, by Application (2020-2032) (USD Million)
10.3.1.8.3 Hungary Surgical Imaging Market Estimates and Forecasts, by End-use (2020-2032) (USD Million)
10.3.1.9 turkey
10.3.1.9.1 Turkey Surgical Imaging Market Estimates and Forecasts, by Modality (2020-2032) (USD Million)
10.3.1.9.2 Turkey Surgical Imaging Market Estimates and Forecasts, by Application (2020-2032) (USD Million)
10.3.1.9.3 Turkey Surgical Imaging Market Estimates and Forecasts, by End-use (2020-2032) (USD Million)
10.3.1.10 Rest of Eastern Europe
10.3.1.10.1 Rest of Eastern Europe Surgical Imaging Market Estimates and Forecasts, by Modality (2020-2032) (USD Million)
10.3.1.10.2 Rest of Eastern Europe Surgical Imaging Market Estimates and Forecasts, by Application (2020-2032) (USD Million)
10.3.1.10.3 Rest of Eastern Europe Surgical Imaging Market Estimates and Forecasts, by End-use (2020-2032) (USD Million)
10.3.2 Western Europe
10.3.2.1 Trends Analysis
10.3.2.2 Western Europe Surgical Imaging Market Estimates and Forecasts, by Country (2020-2032) (USD Million)
10.3.2.3 Western Europe Surgical Imaging Market Estimates and Forecasts, by Modality (2020-2032) (USD Million)
10.3.2.4 Western Europe Surgical Imaging Market Estimates and Forecasts, by Application (2020-2032) (USD Million)
10.3.2.5 Western Europe Surgical Imaging Market Estimates and Forecasts, by End-use (2020-2032) (USD Million)
10.3.2.6 Germany
10.3.2.6.1 Germany Surgical Imaging Market Estimates and Forecasts, by Modality (2020-2032) (USD Million)
10.3.2.6.2 Germany Surgical Imaging Market Estimates and Forecasts, by Application (2020-2032) (USD Million)
10.3.2.6.3 Germany Surgical Imaging Market Estimates and Forecasts, by End-use (2020-2032) (USD Million)
10.3.2.7 France
10.3.2.7.1 France Surgical Imaging Market Estimates and Forecasts, by Modality (2020-2032) (USD Million)
10.3.2.7.2 France Surgical Imaging Market Estimates and Forecasts, by Application (2020-2032) (USD Million)
10.3.2.7.3 France Surgical Imaging Market Estimates and Forecasts, by End-use (2020-2032) (USD Million)
10.3.2.8 UK
10.3.2.8.1 UK Surgical Imaging Market Estimates and Forecasts, by Modality (2020-2032) (USD Million)
10.3.2.8.2 UK Surgical Imaging Market Estimates and Forecasts, by Application (2020-2032) (USD Million)
10.3.2.8.3 UK Surgical Imaging Market Estimates and Forecasts, by End-use (2020-2032) (USD Million)
10.3.2.9 Italy
10.3.2.9.1 Italy Surgical Imaging Market Estimates and Forecasts, by Modality (2020-2032) (USD Million)
10.3.2.9.2 Italy Surgical Imaging Market Estimates and Forecasts, by Application (2020-2032) (USD Million)
10.3.2.9.3 Italy Surgical Imaging Market Estimates and Forecasts, by End-use (2020-2032) (USD Million)
10.3.2.10 Spain
10.3.2.10.1 Spain Surgical Imaging Market Estimates and Forecasts, by Modality (2020-2032) (USD Million)
10.3.2.10.2 Spain Surgical Imaging Market Estimates and Forecasts, by Application (2020-2032) (USD Million)
10.3.2.10.3 Spain Surgical Imaging Market Estimates and Forecasts, by End-use (2020-2032) (USD Million)
10.3.2.11 Netherlands
10.3.2.11.1 Netherlands Surgical Imaging Market Estimates and Forecasts, by Modality (2020-2032) (USD Million)
10.3.2.11.2 Netherlands Surgical Imaging Market Estimates and Forecasts, by Application (2020-2032) (USD Million)
10.3.2.11.3 Netherlands Surgical Imaging Market Estimates and Forecasts, by End-use (2020-2032) (USD Million)
10.3.2.12 Switzerland
10.3.2.12.1 Switzerland Surgical Imaging Market Estimates and Forecasts, by Modality (2020-2032) (USD Million)
10.3.2.12.2 Switzerland Surgical Imaging Market Estimates and Forecasts, by Application (2020-2032) (USD Million)
10.3.2.12.3 Switzerland Surgical Imaging Market Estimates and Forecasts, by End-use (2020-2032) (USD Million)
10.3.2.13 Austria
10.3.2.13.1 Austria Surgical Imaging Market Estimates and Forecasts, by Modality (2020-2032) (USD Million)
10.3.2.13.2 Austria Surgical Imaging Market Estimates and Forecasts, by Application (2020-2032) (USD Million)
10.3.2.13.3 Austria Surgical Imaging Market Estimates and Forecasts, by End-use (2020-2032) (USD Million)
10.3.2.14 Rest of Western Europe
10.3.2.14.1 Rest of Western Europe Surgical Imaging Market Estimates and Forecasts, by Modality (2020-2032) (USD Million)
10.3.2.14.2 Rest of Western Europe Surgical Imaging Market Estimates and Forecasts, by Application (2020-2032) (USD Million)
10.3.2.14.3 Rest of Western Europe Surgical Imaging Market Estimates and Forecasts, by End-use (2020-2032) (USD Million)
10.4 Asia Pacific
10.4.1 Trends Analysis
10.4.2 Asia Pacific Surgical Imaging Market Estimates and Forecasts, by Country (2020-2032) (USD Million)
10.4.3 Asia Pacific Surgical Imaging Market Estimates and Forecasts, by Modality (2020-2032) (USD Million)
10.4.4 Asia Pacific Surgical Imaging Market Estimates and Forecasts, by Application (2020-2032) (USD Million)
10.4.5 Asia Pacific Surgical Imaging Market Estimates and Forecasts, by End-use (2020-2032) (USD Million)
10.4.6 China
10.4.6.1 China Surgical Imaging Market Estimates and Forecasts, by Modality (2020-2032) (USD Million)
10.4.6.2 China Surgical Imaging Market Estimates and Forecasts, by Application (2020-2032) (USD Million)
10.4.6.3 China Surgical Imaging Market Estimates and Forecasts, by End-use (2020-2032) (USD Million)
10.4.7 India
10.4.7.1 India Surgical Imaging Market Estimates and Forecasts, by Modality (2020-2032) (USD Million)
10.4.7.2 India Surgical Imaging Market Estimates and Forecasts, by Application (2020-2032) (USD Million)
10.4.7.3 India Surgical Imaging Market Estimates and Forecasts, by End-use (2020-2032) (USD Million)
10.4.8 Japan
10.4.8.1 Japan Surgical Imaging Market Estimates and Forecasts, by Modality (2020-2032) (USD Million)
10.4.8.2 Japan Surgical Imaging Market Estimates and Forecasts, by Application (2020-2032) (USD Million)
10.4.8.3 Japan Surgical Imaging Market Estimates and Forecasts, by End-use (2020-2032) (USD Million)
10.4.9 South Korea
10.4.9.1 South Korea Surgical Imaging Market Estimates and Forecasts, by Modality (2020-2032) (USD Million)
10.4.9.2 South Korea Surgical Imaging Market Estimates and Forecasts, by Application (2020-2032) (USD Million)
10.4.9.3 South Korea Surgical Imaging Market Estimates and Forecasts, by End-use (2020-2032) (USD Million)
10.4.10 Vietnam
10.4.10.1 Vietnam Surgical Imaging Market Estimates and Forecasts, by Modality (2020-2032) (USD Million)
10.4.10.2 Vietnam Surgical Imaging Market Estimates and Forecasts, by Application (2020-2032) (USD Million)
10.4.10.3 Vietnam Surgical Imaging Market Estimates and Forecasts, by End-use (2020-2032) (USD Million)
10.4.11 Singapore
10.4.11.1 Singapore Surgical Imaging Market Estimates and Forecasts, by Modality (2020-2032) (USD Million)
10.4.11.2 Singapore Surgical Imaging Market Estimates and Forecasts, by Application (2020-2032) (USD Million)
10.4.11.3 Singapore Surgical Imaging Market Estimates and Forecasts, by End-use (2020-2032) (USD Million)
10.4.12 Australia
10.4.12.1 Australia Surgical Imaging Market Estimates and Forecasts, by Modality (2020-2032) (USD Million)
10.4.12.2 Australia Surgical Imaging Market Estimates and Forecasts, by Application (2020-2032) (USD Million)
10.4.12.3 Australia Surgical Imaging Market Estimates and Forecasts, by End-use (2020-2032) (USD Million)
10.4.13 Rest of Asia Pacific
10.4.13.1 Rest of Asia Pacific Surgical Imaging Market Estimates and Forecasts, by Modality (2020-2032) (USD Million)
10.4.13.2 Rest of Asia Pacific Surgical Imaging Market Estimates and Forecasts, by Application (2020-2032) (USD Million)
10.4.13.3 Rest of Asia Pacific Surgical Imaging Market Estimates and Forecasts, by End-use (2020-2032) (USD Million)
10.5 Middle East and Africa
10.5.1 Middle East
10.5.1.1 Trends Analysis
10.5.1.2 Middle East Surgical Imaging Market Estimates and Forecasts, by Country (2020-2032) (USD Million)
10.5.1.3 Middle East Surgical Imaging Market Estimates and Forecasts, by Modality (2020-2032) (USD Million)
10.5.1.4 Middle East Surgical Imaging Market Estimates and Forecasts, by Application (2020-2032) (USD Million)
10.5.1.5 Middle East Surgical Imaging Market Estimates and Forecasts, by End-use (2020-2032) (USD Million)
10.5.1.6 UAE
10.5.1.6.1 UAE Surgical Imaging Market Estimates and Forecasts, by Modality (2020-2032) (USD Million)
10.5.1.6.2 UAE Surgical Imaging Market Estimates and Forecasts, by Application (2020-2032) (USD Million)
10.5.1.6.3 UAE Surgical Imaging Market Estimates and Forecasts, by End-use (2020-2032) (USD Million)
10.5.1.7 Egypt
10.5.1.7.1 Egypt Surgical Imaging Market Estimates and Forecasts, by Modality (2020-2032) (USD Million)
10.5.1.7.2 Egypt Surgical Imaging Market Estimates and Forecasts, by Application (2020-2032) (USD Million)
10.5.1.7.3 Egypt Surgical Imaging Market Estimates and Forecasts, by End-use (2020-2032) (USD Million)
10.5.1.8 Saudi Arabia
10.5.1.8.1 Saudi Arabia Surgical Imaging Market Estimates and Forecasts, by Modality (2020-2032) (USD Million)
10.5.1.8.2 Saudi Arabia Surgical Imaging Market Estimates and Forecasts, by Application (2020-2032) (USD Million)
10.5.1.8.3 Saudi Arabia Surgical Imaging Market Estimates and Forecasts, by End-use (2020-2032) (USD Million)
10.5.1.9 Qatar
10.5.1.9.1 Qatar Surgical Imaging Market Estimates and Forecasts, by Modality (2020-2032) (USD Million)
10.5.1.9.2 Qatar Surgical Imaging Market Estimates and Forecasts, by Application (2020-2032) (USD Million)
10.5.1.9.3 Qatar Surgical Imaging Market Estimates and Forecasts, by End-use (2020-2032) (USD Million)
10.5.1.10 Rest of Middle East
10.5.1.10.1 Rest of Middle East Surgical Imaging Market Estimates and Forecasts, by Modality (2020-2032) (USD Million)
10.5.1.10.2 Rest of Middle East Surgical Imaging Market Estimates and Forecasts, by Application (2020-2032) (USD Million)
10.5.1.10.3 Rest of Middle East Surgical Imaging Market Estimates and Forecasts, by End-use (2020-2032) (USD Million)
10.5.2 Africa
10.5.2.1 Trends Analysis
10.5.2.2 Africa Surgical Imaging Market Estimates and Forecasts, by Country (2020-2032) (USD Million)
10.5.2.3 Africa Surgical Imaging Market Estimates and Forecasts, by Modality (2020-2032) (USD Million)
10.5.2.4 Africa Surgical Imaging Market Estimates and Forecasts, by Application (2020-2032) (USD Million)
10.5.2.5 Africa Surgical Imaging Market Estimates and Forecasts, by End-use (2020-2032) (USD Million)
10.5.2.6 South Africa
10.5.2.6.1 South Africa Surgical Imaging Market Estimates and Forecasts, by Modality (2020-2032) (USD Million)
10.5.2.6.2 South Africa Surgical Imaging Market Estimates and Forecasts, by Application (2020-2032) (USD Million)
10.5.2.6.3 South Africa Surgical Imaging Market Estimates and Forecasts, by End-use (2020-2032) (USD Million)
10.5.2.7 Nigeria
10.5.2.7.1 Nigeria Surgical Imaging Market Estimates and Forecasts, by Modality (2020-2032) (USD Million)
10.5.2.7.2 Nigeria Surgical Imaging Market Estimates and Forecasts, by Application (2020-2032) (USD Million)
10.5.2.7.3 Nigeria Surgical Imaging Market Estimates and Forecasts, by End-use (2020-2032) (USD Million)
10.5.2.8 Rest of Africa
10.5.2.8.1 Rest of Africa Surgical Imaging Market Estimates and Forecasts, by Modality (2020-2032) (USD Million)
10.5.2.8.2 Rest of Africa Surgical Imaging Market Estimates and Forecasts, by Application (2020-2032) (USD Million)
10.5.2.8.3 Rest of Africa Surgical Imaging Market Estimates and Forecasts, by End-use (2020-2032) (USD Million)
10.6 Latin America
10.6.1 Trends Analysis
10.6.2 Latin America Surgical Imaging Market Estimates and Forecasts, by Country (2020-2032) (USD Million)
10.6.3 Latin America Surgical Imaging Market Estimates and Forecasts, by Modality (2020-2032) (USD Million)
10.6.4 Latin America Surgical Imaging Market Estimates and Forecasts, by Application (2020-2032) (USD Million)
10.6.5 Latin America Surgical Imaging Market Estimates and Forecasts, by End-use (2020-2032) (USD Million)
10.6.6 Brazil
10.6.6.1 Brazil Surgical Imaging Market Estimates and Forecasts, by Modality (2020-2032) (USD Million)
10.6.6.2 Brazil Surgical Imaging Market Estimates and Forecasts, by Application (2020-2032) (USD Million)
10.6.6.3 Brazil Surgical Imaging Market Estimates and Forecasts, by End-use (2020-2032) (USD Million)
10.6.7 Argentina
10.6.7.1 Argentina Surgical Imaging Market Estimates and Forecasts, by Modality (2020-2032) (USD Million)
10.6.7.2 Argentina Surgical Imaging Market Estimates and Forecasts, by Application (2020-2032) (USD Million)
10.6.7.3 Argentina Surgical Imaging Market Estimates and Forecasts, by End-use (2020-2032) (USD Million)
10.6.8 Colombia
10.6.8.1 Colombia Surgical Imaging Market Estimates and Forecasts, by Modality (2020-2032) (USD Million)
10.6.8.2 Colombia Surgical Imaging Market Estimates and Forecasts, by Application (2020-2032) (USD Million)
10.6.8.3 Colombia Surgical Imaging Market Estimates and Forecasts, by End-use (2020-2032) (USD Million)
10.6.9 Rest of Latin America
10.6.9.1 Rest of Latin America Surgical Imaging Market Estimates and Forecasts, by Modality (2020-2032) (USD Million)
10.6.9.2 Rest of Latin America Surgical Imaging Market Estimates and Forecasts, by Application (2020-2032) (USD Million)
10.6.9.3 Rest of Latin America Surgical Imaging Market Estimates and Forecasts, by End-use (2020-2032) (USD Million)
11. Company Profiles
11.1 Koninklijke Philips N.V.
11.1.1 Company Overview
11.1.2 Financial
11.1.3 Products/ Services Offered
11.1.4 SWOT Analysis
11.2 GE Healthcare
11.2.1 Company Overview
11.2.2 Financial
11.2.3 Products/ Services Offered
11.2.4 SWOT Analysis
11.3 Siemens Healthcare GmbH
11.3.1 Company Overview
11.3.2 Financial
11.3.3 Products/ Services Offered
11.3.4 SWOT Analysis
11.4 Ziehm Imaging GmbH
11.4.1 Company Overview
11.4.2 Financial
11.4.3 Products/ Services Offered
11.4.4 SWOT Analysis
11.5 Shimadzu Corporation
11.5.1 Company Overview
11.5.2 Financial
11.5.3 Products/ Services Offered
11.5.4 SWOT Analysis
11.6 Hologic Corporation
11.6.1 Company Overview
11.6.2 Financial
11.6.3 Products/ Services Offered
11.6.4 SWOT Analysis
11.7 FUJIFILM Holdings America Corporation
11.7.1 Company Overview
11.7.2 Financial
11.7.3 Products/ Services Offered
11.7.4 SWOT Analysis
11.8 CANON MEDICAL SYSTEMS CORPORATION
11.8.1 Company Overview
11.8.2 Financial
11.8.3 Products/ Services Offered
11.8.4 SWOT Analysis
11.9 SAMSUNG HEALTHCARE
11.9.1 Company Overview
11.9.2 Financial
11.9.3 Products/ Services Offered
11.9.4 SWOT Analysis
11.10 Medtronic Plc
11.10.1 Company Overview
11.10.2 Financial
11.10.3 Products/ Services Offered
11.10.4 SWOT Analysis
12. Use Cases and Best Practices
13. Conclusion
An accurate research report requires proper strategizing as well as implementation. There are multiple factors involved in the completion of good and accurate research report and selecting the best methodology to compete the research is the toughest part. Since the research reports we provide play a crucial role in any company’s decision-making process, therefore we at SNS Insider always believe that we should choose the best method which gives us results closer to reality. This allows us to reach at a stage wherein we can provide our clients best and accurate investment to output ratio.
Each report that we prepare takes a timeframe of 350-400 business hours for production. Starting from the selection of titles through a couple of in-depth brain storming session to the final QC process before uploading our titles on our website we dedicate around 350 working hours. The titles are selected based on their current market cap and the foreseen CAGR and growth.
The 5 steps process:
Step 1: Secondary Research:
Secondary Research or Desk Research is as the name suggests is a research process wherein, we collect data through the readily available information. In this process we use various paid and unpaid databases which our team has access to and gather data through the same. This includes examining of listed companies’ annual reports, Journals, SEC filling etc. Apart from this our team has access to various associations across the globe across different industries. Lastly, we have exchange relationships with various university as well as individual libraries.

Step 2: Primary Research
When we talk about primary research, it is a type of study in which the researchers collect relevant data samples directly, rather than relying on previously collected data. This type of research is focused on gaining content specific facts that can be sued to solve specific problems. Since the collected data is fresh and first hand therefore it makes the study more accurate and genuine.
We at SNS Insider have divided Primary Research into 2 parts.
Part 1 wherein we interview the KOLs of major players as well as the upcoming ones across various geographic regions. This allows us to have their view over the market scenario and acts as an important tool to come closer to the accurate market numbers. As many as 45 paid and unpaid primary interviews are taken from both the demand and supply side of the industry to make sure we land at an accurate judgement and analysis of the market.
This step involves the triangulation of data wherein our team analyses the interview transcripts, online survey responses and observation of on filed participants. The below mentioned chart should give a better understanding of the part 1 of the primary interview.

Part 2: In this part of primary research the data collected via secondary research and the part 1 of the primary research is validated with the interviews from individual consultants and subject matter experts.
Consultants are those set of people who have at least 12 years of experience and expertise within the industry whereas Subject Matter Experts are those with at least 15 years of experience behind their back within the same space. The data with the help of two main processes i.e., FGDs (Focused Group Discussions) and IDs (Individual Discussions). This gives us a 3rd party nonbiased primary view of the market scenario making it a more dependable one while collation of the data pointers.
Step 3: Data Bank Validation
Once all the information is collected via primary and secondary sources, we run that information for data validation. At our intelligence centre our research heads track a lot of information related to the market which includes the quarterly reports, the daily stock prices, and other relevant information. Our data bank server gets updated every fortnight and that is how the information which we collected using our primary and secondary information is revalidated in real time.

Step 4: QA/QC Process
After all the data collection and validation our team does a final level of quality check and quality assurance to get rid of any unwanted or undesired mistakes. This might include but not limited to getting rid of the any typos, duplication of numbers or missing of any important information. The people involved in this process include technical content writers, research heads and graphics people. Once this process is completed the title gets uploader on our platform for our clients to read it.
Step 5: Final QC/QA Process:
This is the last process and comes when the client has ordered the study. In this process a final QA/QC is done before the study is emailed to the client. Since we believe in giving our clients a good experience of our research studies, therefore, to make sure that we do not lack at our end in any way humanly possible we do a final round of quality check and then dispatch the study to the client.
Key Segmentation
By Modality
C-arms
Computed Tomography
X-ray
Ultrasound
By Application
Neurosurgeries
Cardiovascular Surgeries
Orthopedic and Trauma
Gynecological Surgeries
Thoracic Surgeries
Urological Surgeries
Others
By End-use
Hospitals
Specialty Clinics
Ambulatory Surgical Centers
Others
Request for Segment Customization as per your Business Requirement: Segment Customization Request
Regional Coverage:
North America
US
Canada
Mexico
Europe
Eastern Europe
Poland
Romania
Hungary
Turkey
Rest of Eastern Europe
Western Europe
Germany
France
UK
Italy
Spain
Netherlands
Switzerland
Austria
Rest of Western Europe
Asia Pacific
China
India
Japan
South Korea
Vietnam
Singapore
Australia
Rest of Asia Pacific
Middle East & Africa
Middle East
UAE
Egypt
Saudi Arabia
Qatar
Rest of the Middle East
Africa
Nigeria
South Africa
Rest of Africa
Latin America
Brazil
Argentina
Colombia
Rest of Latin America
Request for Country Level Research Report: Country Level Customization Request
Available Customization
With the given market data, SNS Insider offers customization as per the company’s specific needs. The following customization options are available for the report:
Product Analysis
Criss-Cross segment analysis (e.g. Product X Application)
Product Matrix which gives a detailed comparison of the product portfolio of each company
Geographic Analysis
Additional countries in any of the regions
Company Information
Detailed analysis and profiling of additional market players (Up to five)
Medical Waste Containers Market Size was valued at USD 2.0 Billion in 2023 and is expected to reach USD 3.91 Billion by 2032, growing at a CAGR of 7.7% over the forecast period 2024-2032.
The Subcutaneous Drug Delivery Devices Market was worth USD 30.92 billion in 2023 and is predicted to be worth USD 56.95 billion by 2032, growing at a CAGR of 7.07% between 2024 and 2032.
Pet Grooming Services Market Size was valued at USD 6.33 Billion in 2023 and is expected to reach USD 12.05 Billion by 2032, growing at a CAGR of 7.42% over the forecast period 2024-2032.
The Diet Pills Market size is expected to reach USD 3.77 Bn by 2032 and was valued at USD 1.61 Bn in 2023, the CAGR is expected to be 9.9% over the forecast period of 2024-2032.
The Dyspnea Treatment Market Size was valued at USD 6.16 Billion in 2023 and is expected to reach USD 11.01 Billion by 2032 and grow at a CAGR of 6.95% over the forecast period 2024-2032.
The Cone Beam Computer Tomography (CBCT) Market Size was valued at USD 541.93 million in 2023, and is expected to reach USD 1342.77 million by 2031, and grow at a CAGR of 12.01% over the forecast period 2024-2031.

Hi! Click one of our member below to chat on Phone
© 2025 All Rights Reserved by SNS Insider Pvt Ltd


