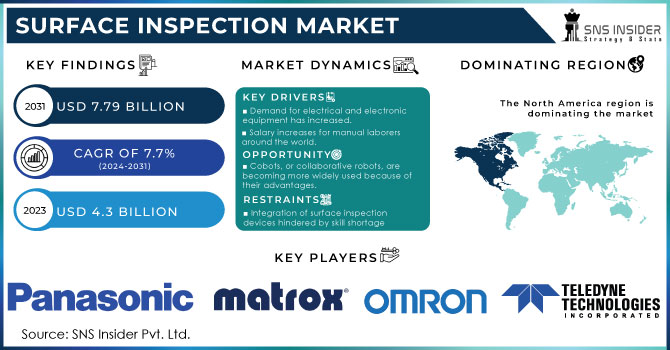
The Surface Inspection Market Size was valued at USD 3.98 Billion in 2023 and is expected to reach USD 8.03 Billion by 2032 and grow at a CAGR of 8.14% over the forecast period 2024-2032.
Technologies have evolved in recent times with greater demand for the automation of quality control in several industries. It is worth mentioning that during 2023 and 2024, the industries covered include automotive, electronics, aerospace, and packaging, with much higher uptake on surface inspection systems to maintain accuracy, enhance the quality of product, and follow strict standards at the regulatory end. Governments around the globe have adopted high-quality control rules, which in developed regions, including North America and Europe, are necessary in terms of complying with standards in safety and reliability. This is, in fact the reason that fastens the uptake of more complex inspection technologies.
Get more information on Surface Inspection Market - Request Sample Report
The most recent technological changes played a critical role in revolutionizing the Surface Inspection Market. The new innovations of AI-driven inspection systems, machine learning algorithms, high-resolution imaging, and edge computing have enabled manufacturers to detect and rectify defects with unparalleled accuracy. For instance, in 2023, Basler and MVTec have partnered with Siemens to integrate machine vision into factory automation, enhancing surface inspection and improving product quality control. Their collaboration streamlines the integration of visual inspection within Siemens' automation technology, addressing labour shortages and enabling end-to-end anomaly detection. Cloud-based solutions launched in 2024 also facilitated remote monitoring and data analysis, thus improving operational efficiency.
Governments and the industrial sector have also been investing in initiatives that foster research and development in the area. For instance, the EU Horizon Europe initiative and India's "Make in India" campaign encourage companies to design cost-effective and scalable inspection systems. Such policies are expected to make industries competitive globally while ensuring high standards of production.
The future of the Surface Inspection Market is full of opportunities because industries are embracing IoT-enabled surface inspection systems. These systems can predict maintenance and monitor quality in real time, which minimizes downtime and optimizes resource utilization. Another promising development is the integration of augmented reality (AR) and virtual reality (VR) for defect visualization. Moreover, as sustainability becomes a core focus, surface inspection technologies are being leveraged to minimize waste and meet environmental goals.
The Surface Inspection Market is slated for transformative growth, with persistent innovation and facilitating government policies ushering in vast adoption. Continued convergence of advanced technologies and regulatory compliance will further build the market strength across diverse industrial applications worldwide.
KEY DRIVERS:
Increase in the demand for automatic quality control solutions.
The need for automation in manufacturing has driven the growth of surface inspection systems. As labour costs continue to increase around the world and attention is drawn to minimizing human error, industries are looking towards automated quality control systems. The International Federation of Robotics, in a 2023 report, said that most of the world's manufacturers would be implementing automation by 2024.
Automated surface inspection systems provide speed and precision like no other system, thus guaranteeing quality products. For industries such as electronics and automotive, where minor defects can cause major losses, these systems are highly beneficial. The integration of machine vision and AI technologies has enhanced their capabilities and made them irreplaceable for modern manufacturing processes.
Increasing focus on sustainability and waste reduction.
Governments and industries have started to prioritize sustainability, and waste reduction has become a very important aspect in the optimization of resources. The surface inspection system is used in identifying defects during the early production cycle, reducing material wastage to a considerable extent. A 2023 European Commission report set out a 30% waste reduction goal by 2030, spurring manufacturers to invest in the latest inspection technologies.
These systems detect imperfections in real time, thus limiting rework and optimizing resource usage. The packaging industry has especially seen a strong interest in surface inspection systems because companies are pushing to meet challenging sustainability targets while making their products more attractive to consumers.
RESTRAIN:
High initial costs and inadequate financial support hinder SMEs from adopting surface inspection systems
According to a 2023 report by the U.S. Department of Commerce, about one third of SMEs pointed to cost as the major impediment to the adoption of advanced manufacturing technologies. Further escalating costs are incurred by customizing inspection systems according to specific industrial requirements, and this becomes very difficult for the smaller manufacturers to compete with larger counterparts.
Furthermore, the financial burden increases from maintenance and upgrading of software that discourages their adoption. The government incentives and subsidies that help to mitigate some of these costs are usually inadequate for the mass implementation among SMEs. This affordability gap should be filled through cost-effective solutions and financial support programs in order to tap into the market's full potential.
BY SYSTEM
The Computer-Based System segment held the largest market share in 2023, at 51%, due to its advanced processing capabilities and flexibility in complex manufacturing environments. Such systems are very efficient when handling large data and give insights in real-time. Hence, such industries as automotive and electronics benefit the most. With integration of AI and machine learning, such defect detection and prediction can become much more accurate.
On the other hand, the Camera-Based System segment is expected to rise with the highest CAGR of 8.94% during the forecast period between 2024 and 2032. This system is growing due to the fact that they are cost-effective and easier to install. Camera-based systems use advanced imaging technologies of high resolution, hence they ensure very accurate defect detection and measurement. Industries like packaging and textiles opt for these systems due to the capability to manage high-speed production lines. The growth of camera-based systems reflects the increased demand for low-cost and scalable inspection solutions.
BY SURFACE TYPE
In 2023, the 3D segment led the market, accounting for 52% of the market share. This is attributed to its better capabilities in detecting complex surface defects and measuring surface topology. In industries like aerospace, automotive, and electronics, the high-precision 3D inspection system with intricate geometries has been extensively relied upon. Such systems make manufacturers achieve higher tolerance, hence reliability in products.
The 3D segment is projected to grow at the fastest rate of 8.52% from 2024 to 2032 as a result of improvements in technologies for 3D imaging, as well as growing adoption rates in emerging markets. Governments and industry players have been investing into R&D towards making the systems more performance-sensitive and affordable to the industries involved. This indicates a move to more complex solutions in inspection products that meet developing quality standards of the respective industry.
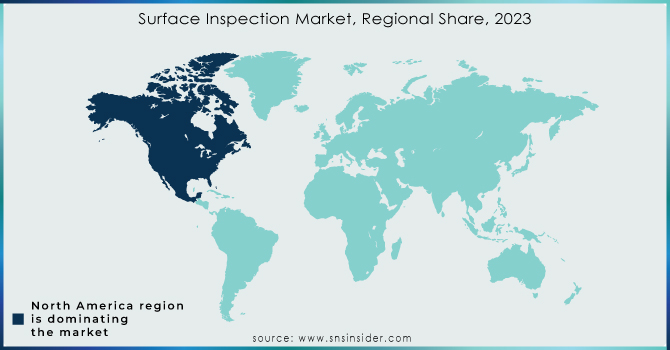
The surface inspection market is characterized by strong regional dynamics, with North America being the leader in 2023, accounting for 43% of the market share. This is due to the high adoption of advanced manufacturing technologies and the stringent quality control regulations in the region. Automotive, aerospace, and electronics are some of the key industries that are driving demand for surface inspection systems. Initiatives by the U.S. government to strengthen domestic manufacturing have also further accelerated the growth of the market in the region.
Asia Pacific region is likely to grow at the fastest pace during the forecast period from 2024 to 2032 at a CAGR of 8.81%. In this region, rapid industrialization and a surge in interest for automation are seen in countries like China, India, and South Korea. Various government initiatives such as "Made in China 2025" and "Digital India" promote innovation and implementation of newer technologies. The region's strong manufacturing base along with cost advantages makes it a critical growth driver for the Surface Inspection Market.
Need any customization research on Gaming Hardware Market - Inquiry Now
Some of the major players in the Surface Inspection Market are
Cognex Corporation (Machine Vision Systems, Barcode Readers)
Keyence Corporation (Machine Vision Systems, Optical Sensors)
Omron Corporation (Industrial Automation, Machine Vision Systems)
Basler AG (Industrial Cameras, Vision Software)
Teledyne Technologies (Cameras, Image Sensors)
ISRA VISION AG (Surface Inspection Systems, 3D Machine Vision Systems)
AMETEK Surface Vision (Inspection Systems, Process Monitoring Solutions)
National Instruments (Data Acquisition Systems, Machine Vision Software)
Baumer Group (Cameras, Image Processing Solutions)
Datalogic S.p.A (Barcode Readers, Machine Vision Systems)
Panasonic Corporation (Industrial Cameras, Inspection Systems)
Sick AG (Optical Sensors, Machine Vision Systems)
Hitachi Ltd. (Inspection Systems, Measurement Instruments)
Bosch Rexroth AG (Automation Solutions, Inspection Technologies)
Microscan Systems (Barcode Readers, Vision Inspection Systems)
Allied Vision Technologies (Industrial Cameras, Embedded Vision Systems)
Jenoptik AG (Optical Metrology, Vision Systems)
Surface Inspection Ltd. (Inspection Systems, Process Control Solutions)
3D Systems Inc. (3D Imaging, Inspection Software)
Ametek Land (Thermal Imaging Cameras, Process Monitoring Systems)
MAJOR SUPPLIERS (Components, Technologies)
Sony Semiconductor Solutions (Image Sensors, Processors)
ON Semiconductor (CMOS Sensors, Processors)
Intel Corporation (Processors, Embedded Systems)
Nikon Corporation (Optics, Lenses)
Edmund Optics (Optics, Optical Components)
Hamamatsu Photonics (Image Sensors, Optoelectronics)
Schott AG (Glass Components, Optics)
Zeiss Group (Optics, Lenses)
Analog Devices (Signal Processing Solutions, Controllers)
Coherent Inc. (Laser Systems, Optical Components)
April 2024: Basler has introduced a new model to its ace 2 camera line, the ace 2 X UV. Featuring a Sony IMX487 global shutter, this new UV spectrum monochrome area scan camera offers 8.1 MPixel resolution at 2840 x 2840 with a 2.74 μm pixel size and reaches 14 fps frame rate. What this camera is supposed to do is capture images of invisible light coming from the wavelengths of 200 – 400 µm.
September 2024: OMRON Automation has proven itself as the leading player in Surface Mount Technology (SMT) and Through-hole Inspection solutions. At Productronica India 2024, it demonstrated these competencies with its AXI Automated X-ray Inspection, AOI Automated Optical Inspection, SPI Solder Paste Inspection solutions.
Report Attributes | Details |
---|---|
Market Size in 2023 | USD 3.98 Billion |
Market Size by 2032 | USD 8.03 Billion |
CAGR | CAGR of 8.14% From 2024 to 2032 |
Base Year | 2023 |
Forecast Period | 2024-2032 |
Historical Data | 2020-2022 |
Report Scope & Coverage | Market Size, Segments Analysis, Competitive Landscape, Regional Analysis, DROC & SWOT Analysis, Forecast Outlook |
Key Segments | • By Component (Frame Grabbers, Lighting Equipment, Software, Cameras, Optics, Processors, Other) • By System (Camera-Based System, Computer-Based System) • By Surface Type (2D, 3D) • By Vertical (Semiconductor, Electrical & Electronics, Food & Packaging, Plastic & Rubber, Automotive, Glass & Metal, Healthcare, Printing) |
Regional Analysis/Coverage | North America (US, Canada, Mexico), Europe (Eastern Europe [Poland, Romania, Hungary, Turkey, Rest of Eastern Europe] Western Europe] Germany, France, UK, Italy, Spain, Netherlands, Switzerland, Austria, Rest of Western Europe]), Asia Pacific (China, India, Japan, South Korea, Vietnam, Singapore, Australia, Rest of Asia Pacific), Middle East & Africa (Middle East [UAE, Egypt, Saudi Arabia, Qatar, Rest of Middle East], Africa [Nigeria, South Africa, Rest of Africa], Latin America (Brazil, Argentina, Colombia, Rest of Latin America) |
Company Profiles | Cognex Corporation, Keyence Corporation, Omron Corporation, Basler AG, Teledyne Technologies, ISRA VISION AG, AMETEK Surface Vision, National Instruments, Baumer Group, Datalogic S.p.A, Panasonic Corporation, Sick AG, Hitachi Ltd., Bosch Rexroth AG, Microscan Systems, Allied Vision Technologies, Jenoptik AG, Surface Inspection Ltd., 3D Systems Inc., Ametek Land. |
Key Drivers | • Increase in the demand for automatic quality control solutions. • Increasing focus on sustainability and waste reduction. |
Restraints | • High initial costs and inadequate financial support hinder SMEs from adopting surface inspection systems |
Ans: North America dominated the Surface Inspection Market in 2023.
Ans: The Computer-Based System segment dominated the Surface Inspection Market.
Ans: The major growth factors of the Surface Inspection Market are increase in the demand for automatic quality control solutions and increasing focus on sustainability and waste reduction.
Ans: Surface Inspection Market size was USD 3.98 Billion in 2023 and is expected to Reach USD 8.03 Billion by 2032.
Ans: The Surface Inspection Market is expected to grow at a CAGR of 8.14% during 2024-2032.
1. Introduction
1.1 Market Definition
1.2 Scope (Inclusion and Exclusions)
1.3 Research Assumptions
2. Executive Summary
2.1 Market Overview
2.2 Regional Synopsis
2.3 Competitive Summary
3. Research Methodology
3.1 Top-Down Approach
3.2 Bottom-up Approach
3.3. Data Validation
3.4 Primary Interviews
4. Market Dynamics Impact Analysis
4.1 Market Driving Factors Analysis
4.1.1 Drivers
4.1.2 Restraints
4.2 PESTLE Analysis
4.3 Porter’s Five Forces Model
5. Statistical Insights and Trends Reporting
5.1 Key Vendors and Feature Analysis, 2023
5.2 Performance Benchmarks, 2023
5.3 Integration Capabilities
5.4 Usage Statistics, 2023
6. Competitive Landscape
6.1 List of Major Companies, By Region
6.2 Market Share Analysis, By Region
6.3 Product Benchmarking
6.3.1 Product specifications and features
6.3.2 Pricing
6.4 Strategic Initiatives
6.4.1 Marketing and promotional activities
6.4.2 Distribution and supply chain strategies
6.4.3 Expansion plans and new product launches
6.4.4 Strategic partnerships and collaborations
6.5 Technological Advancements
6.6 Market Positioning and Branding
7. Surface Inspection Market Segmentation, By Component
7.1 Chapter Overview
7.2 Frame Grabbers
7.2.1 Frame Grabbers Market Trends Analysis (2020-2032)
7.2.2 Frame Grabbers Market Size Estimates and Forecasts to 2032 (USD Billion)
7.3 Lighting Equipment
7.3.1 Lighting Equipment Market Trends Analysis (2020-2032)
7.3.2 Lighting Equipment Market Size Estimates and Forecasts to 2032 (USD Billion)
7.4 Software
7.4.1 Software Market Trends Analysis (2020-2032)
7.4.2 Software Market Size Estimates and Forecasts to 2032 (USD Billion)
7.5 Cameras
7.5.1 Cameras Market Trends Analysis (2020-2032)
7.5.2 Cameras Market Size Estimates and Forecasts to 2032 (USD Billion)
7.6 Optics
7.6.1 Optics Market Trends Analysis (2020-2032)
7.6.2 Optics Market Size Estimates and Forecasts to 2032 (USD Billion)
7.7 Processors
7.7.1 Processors Market Trends Analysis (2020-2032)
7.7.2 Processors Market Size Estimates and Forecasts to 2032 (USD Billion)
7.8 Other
7.8.1 Other Market Trends Analysis (2020-2032)
7.8.2 Other Market Size Estimates and Forecasts to 2032 (USD Billion)
8. Surface Inspection Market Segmentation, By System
8.1 Chapter Overview
8.2 Camera-Based System
8.2.1 Camera-Based System Market Trends Analysis (2020-2032)
8.2.2 Camera-Based System Market Size Estimates and Forecasts to 2032 (USD Billion)
8.3 Computer-Based System
8.3.1 Computer-Based System Market Trends Analysis (2020-2032)
8.3.2 Computer-Based System Market Size Estimates and Forecasts to 2032 (USD Billion)
9. Surface Inspection Market Segmentation, By Surface Type
9.1 Chapter Overview
9.2 2D
9.2.1 2D Market Trends Analysis (2020-2032)
9.2.2 2D Market Size Estimates and Forecasts to 2032 (USD Billion)
9.3 3D
9.3.1 3D Market Trends Analysis (2020-2032)
9.3.2 3D Market Size Estimates and Forecasts to 2032 (USD Billion)
10. Surface Inspection Market Segmentation, By Vertical
10.1 Chapter Overview
10.2 Semiconductor
10.2.1 Semiconductor Market Trends Analysis (2020-2032)
10.2.2 Semiconductor Market Size Estimates and Forecasts to 2032 (USD Billion)
10.3 Electrical & Electronics
10.3.1 Electrical & Electronics Market Trends Analysis (2020-2032)
10.3.2 Electrical & Electronics Market Size Estimates and Forecasts to 2032 (USD Billion)
10.4 Food & Packaging
10.4.1 Food & Packaging Market Trends Analysis (2020-2032)
10.4.2 Food & Packaging Market Size Estimates And Forecasts To 2032 (USD Billion)
10.5 Plastic & Rubber
10.5.1 Plastic & Rubber Market Trends Analysis (2020-2032)
10.5.2 Plastic & Rubber Market Size Estimates And Forecasts To 2032 (USD Billion)
10.6 Automotive
10.6.1 Automotive Market Trends Analysis (2020-2032)
10.6.2 Automotive Market Size Estimates And Forecasts To 2032 (USD Billion)
10.7 Glass & Metal
10.7.1 Glass & Metal Market Trends Analysis (2020-2032)
10.7.2 Glass & Metal Market Size Estimates And Forecasts To 2032 (USD Billion)
10.8 Healthcare
10.8.1 Healthcare Market Trends Analysis (2020-2032)
10.8.2 Healthcare Market Size Estimates And Forecasts To 2032 (USD Billion)
10.9 Printing
10.9.1 Printing Market Trends Analysis (2020-2032)
10.9.2 Printing Market Size Estimates And Forecasts To 2032 (USD Billion)
11. Regional Analysis
11.1 Chapter Overview
11.2 North America
11.2.1 Trends Analysis
11.2.2 North America Surface Inspection Market Estimates and Forecasts, by Country (2020-2032) (USD Billion)
11.2.3 North America Surface Inspection Market Estimates and Forecasts, By Component (2020-2032) (USD Billion)
11.2.4 North America Surface Inspection Market Estimates and Forecasts, By System (2020-2032) (USD Billion)
11.2.5 North America Surface Inspection Market Estimates and Forecasts, By Surface Type (2020-2032) (USD Billion)
11.2.6 North America Surface Inspection Market Estimates and Forecasts, By Vertical (2020-2032) (USD Billion)
11.2.7 USA
11.2.7.1 USA Surface Inspection Market Estimates and Forecasts, By Component (2020-2032) (USD Billion)
11.2.7.2 USA Surface Inspection Market Estimates and Forecasts, By System (2020-2032) (USD Billion)
11.2.7.3 USA Surface Inspection Market Estimates and Forecasts, By Surface Type (2020-2032) (USD Billion)
11.2.7.4 USA Surface Inspection Market Estimates and Forecasts, By Vertical (2020-2032) (USD Billion)
11.2.8 Canada
11.2.8.1 Canada Surface Inspection Market Estimates and Forecasts, By Component (2020-2032) (USD Billion)
11.2.8.2 Canada Surface Inspection Market Estimates and Forecasts, By System (2020-2032) (USD Billion)
11.2.8.3 Canada Surface Inspection Market Estimates and Forecasts, By Surface Type (2020-2032) (USD Billion)
11.2.8.4 Canada Surface Inspection Market Estimates and Forecasts, By Vertical (2020-2032) (USD Billion)
11.2.9 Mexico
11.2.9.1 Mexico Surface Inspection Market Estimates and Forecasts, By Component (2020-2032) (USD Billion)
11.2.9.2 Mexico Surface Inspection Market Estimates and Forecasts, By System (2020-2032) (USD Billion)
11.2.9.3 Mexico Surface Inspection Market Estimates and Forecasts, By Surface Type (2020-2032) (USD Billion)
11.2.9.4 Mexico Surface Inspection Market Estimates and Forecasts, By Vertical (2020-2032) (USD Billion)
11.3 Europe
11.3.1 Eastern Europe
11.3.1.1 Trends Analysis
11.3.1.2 Eastern Europe Surface Inspection Market Estimates and Forecasts, by Country (2020-2032) (USD Billion)
11.3.1.3 Eastern Europe Surface Inspection Market Estimates and Forecasts, By Component (2020-2032) (USD Billion)
11.3.1.4 Eastern Europe Surface Inspection Market Estimates and Forecasts, By System (2020-2032) (USD Billion)
11.3.1.5 Eastern Europe Surface Inspection Market Estimates and Forecasts, By Surface Type (2020-2032) (USD Billion)
11.3.1.6 Eastern Europe Surface Inspection Market Estimates and Forecasts, By Vertical (2020-2032) (USD Billion)
11.3.1.7 Poland
11.3.1.7.1 Poland Surface Inspection Market Estimates and Forecasts, By Component (2020-2032) (USD Billion)
11.3.1.7.2 Poland Surface Inspection Market Estimates and Forecasts, By System (2020-2032) (USD Billion)
11.3.1.7.3 Poland Surface Inspection Market Estimates and Forecasts, By Surface Type (2020-2032) (USD Billion)
11.3.1.7.4 Poland Surface Inspection Market Estimates and Forecasts, By Vertical (2020-2032) (USD Billion)
11.3.1.8 Romania
11.3.1.8.1 Romania Surface Inspection Market Estimates and Forecasts, By Component (2020-2032) (USD Billion)
11.3.1.8.2 Romania Surface Inspection Market Estimates and Forecasts, By System (2020-2032) (USD Billion)
11.3.1.8.3 Romania Surface Inspection Market Estimates and Forecasts, By Surface Type (2020-2032) (USD Billion)
11.3.1.8.4 Romania Surface Inspection Market Estimates and Forecasts, By Vertical (2020-2032) (USD Billion)
11.3.1.9 Hungary
11.3.1.9.1 Hungary Surface Inspection Market Estimates and Forecasts, By Component (2020-2032) (USD Billion)
11.3.1.9.2 Hungary Surface Inspection Market Estimates and Forecasts, By System (2020-2032) (USD Billion)
11.3.1.9.3 Hungary Surface Inspection Market Estimates and Forecasts, By Surface Type (2020-2032) (USD Billion)
11.3.1.9.4 Hungary Surface Inspection Market Estimates and Forecasts, By Vertical (2020-2032) (USD Billion)
11.3.1.10 Turkey
11.3.1.10.1 Turkey Surface Inspection Market Estimates and Forecasts, By Component (2020-2032) (USD Billion)
11.3.1.10.2 Turkey Surface Inspection Market Estimates and Forecasts, By System (2020-2032) (USD Billion)
11.3.1.10.3 Turkey Surface Inspection Market Estimates and Forecasts, By Surface Type (2020-2032) (USD Billion)
11.3.1.10.4 Turkey Surface Inspection Market Estimates and Forecasts, By Vertical (2020-2032) (USD Billion)
11.3.1.11 Rest of Eastern Europe
11.3.1.11.1 Rest of Eastern Europe Surface Inspection Market Estimates and Forecasts, By Component (2020-2032) (USD Billion)
11.3.1.11.2 Rest of Eastern Europe Surface Inspection Market Estimates and Forecasts, By System (2020-2032) (USD Billion)
11.3.1.11.3 Rest of Eastern Europe Surface Inspection Market Estimates and Forecasts, By Surface Type (2020-2032) (USD Billion)
11.3.1.11.4 Rest of Eastern Europe Surface Inspection Market Estimates and Forecasts, By Vertical (2020-2032) (USD Billion)
11.3.2 Western Europe
11.3.2.1 Trends Analysis
11.3.2.2 Western Europe Surface Inspection Market Estimates and Forecasts, by Country (2020-2032) (USD Billion)
11.3.2.3 Western Europe Surface Inspection Market Estimates and Forecasts, By Component (2020-2032) (USD Billion)
11.3.2.4 Western Europe Surface Inspection Market Estimates and Forecasts, By System (2020-2032) (USD Billion)
11.3.2.5 Western Europe Surface Inspection Market Estimates and Forecasts, By Surface Type (2020-2032) (USD Billion)
11.3.2.6 Western Europe Surface Inspection Market Estimates and Forecasts, By Vertical (2020-2032) (USD Billion)
11.3.2.7 Germany
11.3.2.7.1 Germany Surface Inspection Market Estimates and Forecasts, By Component (2020-2032) (USD Billion)
11.3.2.7.2 Germany Surface Inspection Market Estimates and Forecasts, By System (2020-2032) (USD Billion)
11.3.2.7.3 Germany Surface Inspection Market Estimates and Forecasts, By Surface Type (2020-2032) (USD Billion)
11.3.2.7.4 Germany Surface Inspection Market Estimates and Forecasts, By Vertical (2020-2032) (USD Billion)
11.3.2.8 France
11.3.2.8.1 France Surface Inspection Market Estimates and Forecasts, By Component (2020-2032) (USD Billion)
11.3.2.8.2 France Surface Inspection Market Estimates and Forecasts, By System (2020-2032) (USD Billion)
11.3.2.8.3 France Surface Inspection Market Estimates and Forecasts, By Surface Type (2020-2032) (USD Billion)
11.3.2.8.4 France Surface Inspection Market Estimates and Forecasts, By Vertical (2020-2032) (USD Billion)
11.3.2.9 UK
11.3.2.9.1 UK Surface Inspection Market Estimates and Forecasts, By Component (2020-2032) (USD Billion)
11.3.2.9.2 UK Surface Inspection Market Estimates and Forecasts, By System (2020-2032) (USD Billion)
11.3.2.9.3 UK Surface Inspection Market Estimates and Forecasts, By Surface Type (2020-2032) (USD Billion)
11.3.2.9.4 UK Surface Inspection Market Estimates and Forecasts, By Vertical (2020-2032) (USD Billion)
11.3.2.10 Italy
11.3.2.10.1 Italy Surface Inspection Market Estimates and Forecasts, By Component (2020-2032) (USD Billion)
11.3.2.10.2 Italy Surface Inspection Market Estimates and Forecasts, By System (2020-2032) (USD Billion)
11.3.2.10.3 Italy Surface Inspection Market Estimates and Forecasts, By Surface Type (2020-2032) (USD Billion)
11.3.2.10.4 Italy Surface Inspection Market Estimates and Forecasts, By Vertical (2020-2032) (USD Billion)
11.3.2.11 Spain
11.3.2.11.1 Spain Surface Inspection Market Estimates and Forecasts, By Component (2020-2032) (USD Billion)
11.3.2.11.2 Spain Surface Inspection Market Estimates and Forecasts, By System (2020-2032) (USD Billion)
11.3.2.11.3 Spain Surface Inspection Market Estimates and Forecasts, By Surface Type (2020-2032) (USD Billion)
11.3.2.11.4 Spain Surface Inspection Market Estimates and Forecasts, By Vertical (2020-2032) (USD Billion)
11.3.2.12 Netherlands
11.3.2.12.1 Netherlands Surface Inspection Market Estimates and Forecasts, By Component (2020-2032) (USD Billion)
11.3.2.12.2 Netherlands Surface Inspection Market Estimates and Forecasts, By System (2020-2032) (USD Billion)
11.3.2.12.3 Netherlands Surface Inspection Market Estimates and Forecasts, By Surface Type (2020-2032) (USD Billion)
11.3.2.12.4 Netherlands Surface Inspection Market Estimates and Forecasts, By Vertical (2020-2032) (USD Billion)
11.3.2.13 Switzerland
11.3.2.13.1 Switzerland Surface Inspection Market Estimates and Forecasts, By Component (2020-2032) (USD Billion)
11.3.2.13.2 Switzerland Surface Inspection Market Estimates and Forecasts, By System (2020-2032) (USD Billion)
11.3.2.13.3 Switzerland Surface Inspection Market Estimates and Forecasts, By Surface Type (2020-2032) (USD Billion)
11.3.2.13.4 Switzerland Surface Inspection Market Estimates and Forecasts, By Vertical (2020-2032) (USD Billion)
11.3.2.14 Austria
11.3.2.14.1 Austria Surface Inspection Market Estimates and Forecasts, By Component (2020-2032) (USD Billion)
11.3.2.14.2 Austria Surface Inspection Market Estimates and Forecasts, By System (2020-2032) (USD Billion)
11.3.2.14.3 Austria Surface Inspection Market Estimates and Forecasts, By Surface Type (2020-2032) (USD Billion)
11.3.2.14.4 Austria Surface Inspection Market Estimates and Forecasts, By Vertical (2020-2032) (USD Billion)
11.3.2.15 Rest of Western Europe
11.3.2.15.1 Rest of Western Europe Surface Inspection Market Estimates and Forecasts, By Component (2020-2032) (USD Billion)
11.3.2.15.2 Rest of Western Europe Surface Inspection Market Estimates and Forecasts, By System (2020-2032) (USD Billion)
11.3.2.15.3 Rest of Western Europe Surface Inspection Market Estimates and Forecasts, By Surface Type (2020-2032) (USD Billion)
11.3.2.15.4 Rest of Western Europe Surface Inspection Market Estimates and Forecasts, By Vertical (2020-2032) (USD Billion)
11.4 Asia Pacific
11.4.1 Trends Analysis
11.4.2 Asia Pacific Surface Inspection Market Estimates and Forecasts, by Country (2020-2032) (USD Billion)
11.4.3 Asia Pacific Surface Inspection Market Estimates and Forecasts, By Component (2020-2032) (USD Billion)
11.4.4 Asia Pacific Surface Inspection Market Estimates and Forecasts, By System (2020-2032) (USD Billion)
11.4.5 Asia Pacific Surface Inspection Market Estimates and Forecasts, By Surface Type (2020-2032) (USD Billion)
11.4.6 Asia Pacific Surface Inspection Market Estimates and Forecasts, By Vertical (2020-2032) (USD Billion)
11.4.7 China
11.4.7.1 China Surface Inspection Market Estimates and Forecasts, By Component (2020-2032) (USD Billion)
11.4.7.2 China Surface Inspection Market Estimates and Forecasts, By System (2020-2032) (USD Billion)
11.4.7.3 China Surface Inspection Market Estimates and Forecasts, By Surface Type (2020-2032) (USD Billion)
11.4.7.4 China Surface Inspection Market Estimates and Forecasts, By Vertical (2020-2032) (USD Billion)
11.4.8 India
11.4.8.1 India Surface Inspection Market Estimates and Forecasts, By Component (2020-2032) (USD Billion)
11.4.8.2 India Surface Inspection Market Estimates and Forecasts, By System (2020-2032) (USD Billion)
11.4.8.3 India Surface Inspection Market Estimates and Forecasts, By Surface Type (2020-2032) (USD Billion)
11.4.8.4 India Surface Inspection Market Estimates and Forecasts, By Vertical (2020-2032) (USD Billion)
11.4.9 Japan
11.4.9.1 Japan Surface Inspection Market Estimates and Forecasts, By Component (2020-2032) (USD Billion)
11.4.9.2 Japan Surface Inspection Market Estimates and Forecasts, By System (2020-2032) (USD Billion)
11.4.9.3 Japan Surface Inspection Market Estimates and Forecasts, By Surface Type (2020-2032) (USD Billion)
11.4.9.4 Japan Surface Inspection Market Estimates and Forecasts, By Vertical (2020-2032) (USD Billion)
11.4.10 South Korea
11.4.10.1 South Korea Surface Inspection Market Estimates and Forecasts, By Component (2020-2032) (USD Billion)
11.4.10.2 South Korea Surface Inspection Market Estimates and Forecasts, By System (2020-2032) (USD Billion)
11.4.10.3 South Korea Surface Inspection Market Estimates and Forecasts, By Surface Type (2020-2032) (USD Billion)
11.4.10.4 South Korea Surface Inspection Market Estimates and Forecasts, By Vertical (2020-2032) (USD Billion)
11.4.11 Vietnam
11.4.11.1 Vietnam Surface Inspection Market Estimates and Forecasts, By Component (2020-2032) (USD Billion)
11.4.11.2 Vietnam Surface Inspection Market Estimates and Forecasts, By System (2020-2032) (USD Billion)
11.4.11.3 Vietnam Surface Inspection Market Estimates and Forecasts, By Surface Type (2020-2032) (USD Billion)
11.4.11.4 Vietnam Surface Inspection Market Estimates and Forecasts, By Vertical (2020-2032) (USD Billion)
11.4.12 Singapore
11.4.12.1 Singapore Surface Inspection Market Estimates and Forecasts, By Component (2020-2032) (USD Billion)
11.4.12.2 Singapore Surface Inspection Market Estimates and Forecasts, By System (2020-2032) (USD Billion)
11.4.12.3 Singapore Surface Inspection Market Estimates and Forecasts, By Surface Type (2020-2032) (USD Billion)
11.4.12.4 Singapore Surface Inspection Market Estimates and Forecasts, By Vertical (2020-2032) (USD Billion)
11.4.13 Australia
11.4.13.1 Australia Surface Inspection Market Estimates and Forecasts, By Component (2020-2032) (USD Billion)
11.4.13.2 Australia Surface Inspection Market Estimates and Forecasts, By System (2020-2032) (USD Billion)
11.4.13.3 Australia Surface Inspection Market Estimates and Forecasts, By Surface Type (2020-2032) (USD Billion)
11.4.13.4 Australia Surface Inspection Market Estimates and Forecasts, By Vertical (2020-2032) (USD Billion)
11.4.14 Rest of Asia Pacific
11.4.14.1 Rest of Asia Pacific Surface Inspection Market Estimates and Forecasts, By Component (2020-2032) (USD Billion)
11.4.14.2 Rest of Asia Pacific Surface Inspection Market Estimates and Forecasts, By System (2020-2032) (USD Billion)
11.4.14.3 Rest of Asia Pacific Surface Inspection Market Estimates and Forecasts, By Surface Type (2020-2032) (USD Billion)
11.4.14.4 Rest of Asia Pacific Surface Inspection Market Estimates and Forecasts, By Vertical (2020-2032) (USD Billion)
11.5 Middle East and Africa
11.5.1 Middle East
11.5.1.1 Trends Analysis
11.5.1.2 Middle East Surface Inspection Market Estimates and Forecasts, by Country (2020-2032) (USD Billion)
11.5.1.3 Middle East Surface Inspection Market Estimates and Forecasts, By Component (2020-2032) (USD Billion)
11.5.1.4 Middle East Surface Inspection Market Estimates and Forecasts, By System (2020-2032) (USD Billion)
11.5.1.5 Middle East Surface Inspection Market Estimates and Forecasts, By Surface Type (2020-2032) (USD Billion)
11.5.1.6 Middle East Surface Inspection Market Estimates and Forecasts, By Vertical (2020-2032) (USD Billion)
11.5.1.7 UAE
11.5.1.7.1 UAE Surface Inspection Market Estimates and Forecasts, By Component (2020-2032) (USD Billion)
11.5.1.7.2 UAE Surface Inspection Market Estimates and Forecasts, By System (2020-2032) (USD Billion)
11.5.1.7.3 UAE Surface Inspection Market Estimates and Forecasts, By Surface Type (2020-2032) (USD Billion)
11.5.1.7.4 UAE Surface Inspection Market Estimates and Forecasts, By Vertical (2020-2032) (USD Billion)
11.5.1.8 Egypt
11.5.1.8.1 Egypt Surface Inspection Market Estimates and Forecasts, By Component (2020-2032) (USD Billion)
11.5.1.8.2 Egypt Surface Inspection Market Estimates and Forecasts, By System (2020-2032) (USD Billion)
11.5.1.8.3 Egypt Surface Inspection Market Estimates and Forecasts, By Surface Type (2020-2032) (USD Billion)
11.5.1.8.4 Egypt Surface Inspection Market Estimates and Forecasts, By Vertical (2020-2032) (USD Billion)
11.5.1.9 Saudi Arabia
11.5.1.9.1 Saudi Arabia Surface Inspection Market Estimates and Forecasts, By Component (2020-2032) (USD Billion)
11.5.1.9.2 Saudi Arabia Surface Inspection Market Estimates and Forecasts, By System (2020-2032) (USD Billion)
11.5.1.9.3 Saudi Arabia Surface Inspection Market Estimates and Forecasts, By Surface Type (2020-2032) (USD Billion)
11.5.1.9.4 Saudi Arabia Surface Inspection Market Estimates and Forecasts, By Vertical (2020-2032) (USD Billion)
11.5.1.10 Qatar
11.5.1.10.1 Qatar Surface Inspection Market Estimates and Forecasts, By Component (2020-2032) (USD Billion)
11.5.1.10.2 Qatar Surface Inspection Market Estimates and Forecasts, By System (2020-2032) (USD Billion)
11.5.1.10.3 Qatar Surface Inspection Market Estimates and Forecasts, By Surface Type (2020-2032) (USD Billion)
11.5.1.10.4 Qatar Surface Inspection Market Estimates and Forecasts, By Vertical (2020-2032) (USD Billion)
11.5.1.11 Rest of Middle East
11.5.1.11.1 Rest of Middle East Surface Inspection Market Estimates and Forecasts, By Component (2020-2032) (USD Billion)
11.5.1.11.2 Rest of Middle East Surface Inspection Market Estimates and Forecasts, By System (2020-2032) (USD Billion)
11.5.1.11.3 Rest of Middle East Surface Inspection Market Estimates and Forecasts, By Surface Type (2020-2032) (USD Billion)
11.5.1.11.4 Rest of Middle East Surface Inspection Market Estimates and Forecasts, By Vertical (2020-2032) (USD Billion)
11.5.2 Africa
11.5.2.1 Trends Analysis
11.5.2.2 Africa Surface Inspection Market Estimates and Forecasts, by Country (2020-2032) (USD Billion)
11.5.2.3 Africa Surface Inspection Market Estimates and Forecasts, By Component (2020-2032) (USD Billion)
11.5.2.4 Africa Surface Inspection Market Estimates and Forecasts, By System (2020-2032) (USD Billion)
11.5.2.5 Africa Surface Inspection Market Estimates and Forecasts, By Surface Type (2020-2032) (USD Billion)
11.5.2.6 Africa Surface Inspection Market Estimates and Forecasts, By Vertical (2020-2032) (USD Billion)
11.5.2.7 South Africa
11.5.2.7.1 South Africa Surface Inspection Market Estimates and Forecasts, By Component (2020-2032) (USD Billion)
11.5.2.7.2 South Africa Surface Inspection Market Estimates and Forecasts, By System (2020-2032) (USD Billion)
11.5.2.7.3 South Africa Surface Inspection Market Estimates and Forecasts, By Surface Type (2020-2032) (USD Billion)
11.5.2.7.4 South Africa Surface Inspection Market Estimates and Forecasts, By Vertical (2020-2032) (USD Billion)
11.5.2.8 Nigeria
11.5.2.8.1 Nigeria Surface Inspection Market Estimates and Forecasts, By Component (2020-2032) (USD Billion)
11.5.2.8.2 Nigeria Surface Inspection Market Estimates and Forecasts, By System (2020-2032) (USD Billion)
11.5.2.8.3 Nigeria Surface Inspection Market Estimates and Forecasts, By Surface Type (2020-2032) (USD Billion)
11.5.2.8.4 Nigeria Surface Inspection Market Estimates and Forecasts, By Vertical (2020-2032) (USD Billion)
11.5.2.9 Rest of Africa
11.5.2.9.1 Rest of Africa Surface Inspection Market Estimates and Forecasts, By Component (2020-2032) (USD Billion)
11.5.2.9.2 Rest of Africa Surface Inspection Market Estimates and Forecasts, By System (2020-2032) (USD Billion)
11.5.2.9.3 Rest of Africa Surface Inspection Market Estimates and Forecasts, By Surface Type (2020-2032) (USD Billion)
11.5.2.9.4 Rest of Africa Surface Inspection Market Estimates and Forecasts, By Vertical (2020-2032) (USD Billion)
11.6 Latin America
11.6.1 Trends Analysis
11.6.2 Latin America Surface Inspection Market Estimates and Forecasts, by Country (2020-2032) (USD Billion)
11.6.3 Latin America Surface Inspection Market Estimates and Forecasts, By Component (2020-2032) (USD Billion)
11.6.4 Latin America Surface Inspection Market Estimates and Forecasts, By System (2020-2032) (USD Billion)
11.6.5 Latin America Surface Inspection Market Estimates and Forecasts, By Surface Type (2020-2032) (USD Billion)
11.6.6 Latin America Surface Inspection Market Estimates and Forecasts, By Vertical (2020-2032) (USD Billion)
11.6.7 Brazil
11.6.7.1 Brazil Surface Inspection Market Estimates and Forecasts, By Component (2020-2032) (USD Billion)
11.6.7.2 Brazil Surface Inspection Market Estimates and Forecasts, By System (2020-2032) (USD Billion)
11.6.7.3 Brazil Surface Inspection Market Estimates and Forecasts, By Surface Type (2020-2032) (USD Billion)
11.6.7.4 Brazil Surface Inspection Market Estimates and Forecasts, By Vertical (2020-2032) (USD Billion)
11.6.8 Argentina
11.6.8.1 Argentina Surface Inspection Market Estimates and Forecasts, By Component (2020-2032) (USD Billion)
11.6.8.2 Argentina Surface Inspection Market Estimates and Forecasts, By System (2020-2032) (USD Billion)
11.6.8.3 Argentina Surface Inspection Market Estimates and Forecasts, By Surface Type (2020-2032) (USD Billion)
11.6.8.4 Argentina Surface Inspection Market Estimates and Forecasts, By Vertical (2020-2032) (USD Billion)
11.6.9 Colombia
11.6.9.1 Colombia Surface Inspection Market Estimates and Forecasts, By Component (2020-2032) (USD Billion)
11.6.9.2 Colombia Surface Inspection Market Estimates and Forecasts, By System (2020-2032) (USD Billion)
11.6.9.3 Colombia Surface Inspection Market Estimates and Forecasts, By Surface Type (2020-2032) (USD Billion)
11.6.9.4 Colombia Surface Inspection Market Estimates and Forecasts, By Vertical (2020-2032) (USD Billion)
11.6.10 Rest of Latin America
11.6.10.1 Rest of Latin America Surface Inspection Market Estimates and Forecasts, By Component (2020-2032) (USD Billion)
11.6.10.2 Rest of Latin America Surface Inspection Market Estimates and Forecasts, By System (2020-2032) (USD Billion)
11.6.10.3 Rest of Latin America Surface Inspection Market Estimates and Forecasts, By Surface Type (2020-2032) (USD Billion)
11.6.10.4 Rest of Latin America Surface Inspection Market Estimates and Forecasts, By Vertical (2020-2032) (USD Billion)
12. Company Profiles
12.1 Cognex Corporation
12.1.1 Company Overview
12.1.2 Financial
12.1.3 Products/ Services Offered
12.1.4 SWOT Analysis
12.2 Keyence Corporation
12.2.1 Company Overview
12.2.2 Financial
12.2.3 Products/ Services Offered
12.2.4 SWOT Analysis
12.3 Omron Corporation
12.3.1 Company Overview
12.3.2 Financial
12.3.3 Products/ Services Offered
12.3.4 SWOT Analysis
12.4 Basler AG
12.4.1 Company Overview
12.4.2 Financial
12.4.3 Products/ Services Offered
12.4.4 SWOT Analysis
12.5 Teledyne Technologies
12.5.1 Company Overview
12.5.2 Financial
12.5.3 Products/ Services Offered
12.5.4 SWOT Analysis
12.6 ISRA VISION AG
12.6.1 Company Overview
12.6.2 Financial
12.6.3 Products/ Services Offered
12.6.4 SWOT Analysis
12.7 AMETEK Surface Vision
12.7.1 Company Overview
12.7.2 Financial
12.7.3 Products/ Services Offered
12.7.4 SWOT Analysis
12.8 National Instruments
12.8.1 Company Overview
12.8.2 Financial
12.8.3 Products/ Services Offered
12.8.4 SWOT Analysis
12.9 Baumer Group
12.9.1 Company Overview
12.9.2 Financial
12.9.3 Products/ Services Offered
12.9.4 SWOT Analysis
12.10 Datalogic S.p.A
12.10.1 Company Overview
12.10.2 Financial
12.10.3 Products/ Services Offered
12.10.4 SWOT Analysis
13. Use Cases and Best Practices
14. Conclusion
An accurate research report requires proper strategizing as well as implementation. There are multiple factors involved in the completion of good and accurate research report and selecting the best methodology to compete the research is the toughest part. Since the research reports we provide play a crucial role in any company’s decision-making process, therefore we at SNS Insider always believe that we should choose the best method which gives us results closer to reality. This allows us to reach at a stage wherein we can provide our clients best and accurate investment to output ratio.
Each report that we prepare takes a timeframe of 350-400 business hours for production. Starting from the selection of titles through a couple of in-depth brain storming session to the final QC process before uploading our titles on our website we dedicate around 350 working hours. The titles are selected based on their current market cap and the foreseen CAGR and growth.
The 5 steps process:
Step 1: Secondary Research:
Secondary Research or Desk Research is as the name suggests is a research process wherein, we collect data through the readily available information. In this process we use various paid and unpaid databases which our team has access to and gather data through the same. This includes examining of listed companies’ annual reports, Journals, SEC filling etc. Apart from this our team has access to various associations across the globe across different industries. Lastly, we have exchange relationships with various university as well as individual libraries.
Step 2: Primary Research
When we talk about primary research, it is a type of study in which the researchers collect relevant data samples directly, rather than relying on previously collected data. This type of research is focused on gaining content specific facts that can be sued to solve specific problems. Since the collected data is fresh and first hand therefore it makes the study more accurate and genuine.
We at SNS Insider have divided Primary Research into 2 parts.
Part 1 wherein we interview the KOLs of major players as well as the upcoming ones across various geographic regions. This allows us to have their view over the market scenario and acts as an important tool to come closer to the accurate market numbers. As many as 45 paid and unpaid primary interviews are taken from both the demand and supply side of the industry to make sure we land at an accurate judgement and analysis of the market.
This step involves the triangulation of data wherein our team analyses the interview transcripts, online survey responses and observation of on filed participants. The below mentioned chart should give a better understanding of the part 1 of the primary interview.
Part 2: In this part of primary research the data collected via secondary research and the part 1 of the primary research is validated with the interviews from individual consultants and subject matter experts.
Consultants are those set of people who have at least 12 years of experience and expertise within the industry whereas Subject Matter Experts are those with at least 15 years of experience behind their back within the same space. The data with the help of two main processes i.e., FGDs (Focused Group Discussions) and IDs (Individual Discussions). This gives us a 3rd party nonbiased primary view of the market scenario making it a more dependable one while collation of the data pointers.
Step 3: Data Bank Validation
Once all the information is collected via primary and secondary sources, we run that information for data validation. At our intelligence centre our research heads track a lot of information related to the market which includes the quarterly reports, the daily stock prices, and other relevant information. Our data bank server gets updated every fortnight and that is how the information which we collected using our primary and secondary information is revalidated in real time.
Step 4: QA/QC Process
After all the data collection and validation our team does a final level of quality check and quality assurance to get rid of any unwanted or undesired mistakes. This might include but not limited to getting rid of the any typos, duplication of numbers or missing of any important information. The people involved in this process include technical content writers, research heads and graphics people. Once this process is completed the title gets uploader on our platform for our clients to read it.
Step 5: Final QC/QA Process:
This is the last process and comes when the client has ordered the study. In this process a final QA/QC is done before the study is emailed to the client. Since we believe in giving our clients a good experience of our research studies, therefore, to make sure that we do not lack at our end in any way humanly possible we do a final round of quality check and then dispatch the study to the client.
BY COMPONENT
Frame Grabbers
Lighting Equipment
Software
Cameras
Optics
Processors
Other
BY SYSTEM
Camera-Based System
Computer-Based System
BY SURFACE TYPE
2D
3D
BY VERTICAL
Semiconductor
Electrical & Electronics
Food & Packaging
Plastic & Rubber
Automotive
Glass & Metal
Healthcare
Printing
Request for Segment Customization as per your Business Requirement: Segment Customization Request
REGIONAL COVERAGE:
North America
US
Canada
Mexico
Europe
Eastern Europe
Poland
Romania
Hungary
Turkey
Rest of Eastern Europe
Western Europe
Germany
France
UK
Italy
Spain
Netherlands
Switzerland
Austria
Rest of Western Europe
Asia Pacific
China
India
Japan
South Korea
Vietnam
Singapore
Australia
Rest of Asia Pacific
Middle East & Africa
Middle East
UAE
Egypt
Saudi Arabia
Qatar
Rest of the Middle East
Africa
Nigeria
South Africa
Rest of Africa
Latin America
Brazil
Argentina
Colombia
Rest of Latin America
Request for Country Level Research Report: Country Level Customization Request
Available Customization
With the given market data, SNS Insider offers customization as per the company’s specific needs. The following customization options are available for the report:
Product Analysis
Criss-Cross segment analysis (e.g. Product X Application)
Product Matrix which gives a detailed comparison of product portfolio of each company
Geographic Analysis
Additional countries in any of the regions
Company Information
Detailed analysis and profiling of additional market players (Up to five)
The Industrial Thermopile Sensors Market was valued at USD 1.38 Billion in 2023 and is projected to reach USD 2.43 Billion by 2032, growing at a CAGR of 6.5% during 2024-2032.
LAN Cable Market Size was valued at USD 14.08 Billion in 2023 and is expected to reach USD 44.41 Billion by 2032 and grow at a CAGR of 13.63% over the forecast period 2024-2032.
The Semiconductor Chip Market size was valued at USD 640.3 billion in 2023 and is expected to grow to USD 1219 billion by 2031 and grow at a CAGR of 8.38% over the forecast period of 2024-2031.
The Vacuum Sensor Market Size was valued at USD 626.24 million in 2023 and is estimated to reach USD 1084.7 million by 2032 and grow at a CAGR of 6.30% over the forecast period 2024-2032.
The Inspection Camera System Market size was valued at USD 351.98 Million in 2023 and is expected to reach USD 933.51 Million by 2032 and grow at a CAGR of 11.47% over the forecast period 2024-2032.
The Industrial PC Market Size was USD 5.5 Billion in 2023 and is expected to reach USD 9.4 Billion by 2032 and grow at a CAGR of 5.9% by 2024-2032.
Hi! Click one of our member below to chat on Phone