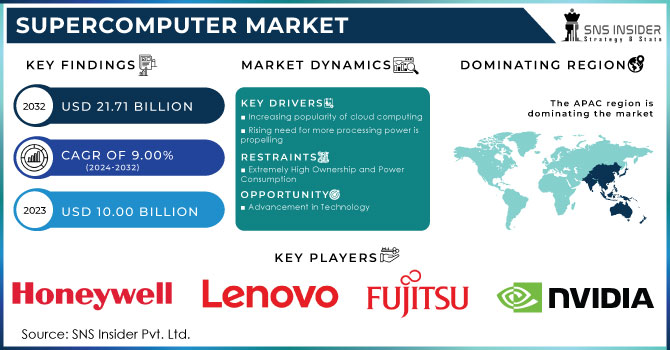
The Supercomputer Market size was valued at USD 9.96 billion in 2023 and is expected to grow to USD 24.40 billion by 2032 and grow at a CAGR of 10.84% over the forecast period of 2024-2032. Key factors influencing this growth include the increasing installed base of supercomputers across industries and research centers, as well as advancements in AI and machine learning applications. Energy consumption and efficiency are critical metrics, as supercomputers continue to become more power-efficient while maintaining high performance. Reliability is also key, with some work on improving operational uptime and failure rates of supercomputing systems. In addition to that, a lot of money is flowing into supercomputing for AI/ML applications, contributing to the growth of this market as well as its technology.
Get More Information on Supercomputer Market - Request Sample Report
Drivers:
Revolutionizing Supercomputing with Cloud and Parallel Computing
The supercomputing landscape is undergoing a major shift, driven by cloud technology that is transforming traditional infrastructure. Modern supercomputer architectures now rely on parallel computing, allowing multiple tasks to be processed simultaneously The rise of cloud-based supercomputing solutions This trend in supercomputing, allowing a wider range of organizations access to high-powered computing equipment through platform-as-a-services models. Research institutions, for their part, own the majority of the world’s most powerful supercomputers, with more than 50% of the top supercomputers owned by research based organizations as of 2023 further emphasizing this broader accessibility. Fugaku, the world's fastest computer, which has 7.6 million cores and a peak speed of 442,010 TFlops/s, is driving innovation in aerodynamics and multi-scale simulations and structural validation, greatly accelerating R&D.
Restraints:
Supercomputer integration with existing IT systems can be complex due to compatibility issues, specialized requirements, and the need for expert management.
The integration of Supercomputers within existing IT infrastructures is characterized by strong technical difficulties. However, they usually come with compatibility issues when trying to connect advanced supercomputing systems with legacy systems, which in most cases need special adapters or software updates. In addition to this, supercomputers have their own requirements such as high-performance storage systems, special networking protocols, and dedicated cooling systems and so on, which makes the integration even more difficult. This complexity is further compounded by the challenge of a skilled workforce to deploy and maintain these systems. Insufficient in-house skills can lead to operational inefficiencies and prolonged downtime. Moreover, retrofitting existing systems to work with these hyperactive scale machines can be time-consuming and expensive.
Opportunities:
Sustainability and specialization in supercomputing are driving energy-efficient designs, green computing, and tailored applications for research, AI, and quantum computing.
Supercomputing is increasingly following the path of sustainability, with pretty much all manufacturers putting significant emphasis on green computing and energy-efficient designs. And companies are investing in novel cooling technologies and power management methods to strike a balance between performance and sustainability. And there's HPE's USD 100 million-dollar Cambridge-1 supercomputer investment from 2023 at the high end of the field, liquid-cooled to bring high-performance computing into greener, power-controlled territory. There’s also a trend toward specialization, particularly in scientific research, climate modeling and nuclear research. As Abu Dhabi prepares to bring its first quantum supercomputer to life, the next generation of supercomputing technology is determined by the impact of quantum computing and the availability of specialized software for AI and big data.
Challenges:
Energy consumption in supercomputing is a rising concern due to the high electricity demands of these systems, raising sustainability and cost challenges.
Supercomputers require huge amounts of electricity to do complicated calculations, which incurs significant energy costs. Because these systems are designed for extremely high performance workloads, their energy and electricity demands are generally much higher than traditional computing infrastructures. Such increased energy use poses a sustainability challenge, given that data centers are growing around the world. Hence, manufacturers are emphasizing on energy-efficient designs, such as improved power management and cooling technologies, to mitigate environmental impact. supercomputing systems need both power and sustainability solutions, meaning striking a balance between performance and energy remains a compliance challenge if users want their systems to remain viable long-term.
By Type
The Tightly connected cluster computer segment led the supercomputer market with the largest revenue share of approximately 48% in 2023. This segment's dominance is driven by its ability to efficiently manage parallel processing tasks across multiple interconnected nodes, offering high computational power and scalability for diverse applications. Due to combining various processors and computers, cluster computing allows for cost-effective scaling with significant flexibility and resource management. Its popularity is especially notable in sectors that demand high-performance computing for applications like simulations, scientific research, and AI modeling. Due to increasing adoption of these solutions among enterprises and research institutions, the tightly connected cluster computer segment will retain its leadership in the ecosystem.
The commodity segment is set to experience the fastest growth in the supercomputer market over the forecast period from 2024 to 2032. This growth is driven by the rising need for high-performance computing solutions that are cost-effective and capable of scaling. Commodity supercomputing systems use standard hardware components (e.g., processors and storage units), which lead to overall lower cost than that of specialized, custom-built supercomputers. These systems are flexible and efficient, as they are based on commodity parts, meaning that they can be considered a worthy alternative in a wider range of sectors, such as research establishments and small and medium businesses and cloud service providers. The commodity segment is expected to be an important driver of market growth in the future years, especially owing to its cost-effectiveness along with high-performance capabilities.
By Application
The scientific research segment held the largest revenue share, approximately 48%, in the supercomputer market in 2023. Due to the increasing dependence on supercomputers for complex simulations, data analysis, and modelling across many scientific disciplines. These breakthroughs have much to do with the capabilities of supercomputers, which are able to execute complex simulations at a level of detail beyond the capabilities of traditional computing systems — and that’s critical in fields such as climate science, physics, biology and materials science. The need for high-performance computing to tackle complex scientific problems will continue to fuel growth in this segment, which research institutions and universities are pioneering with cutting-edge supercomputing technology.
The Defense segment is poised to be the fastest-growing in the supercomputer market from 2024 to 2032. Demand for advanced supercomputing systems is being driven by the increasing complexity surrounding military operations, including cybersecurity, simulations and intelligence analysis. These high-performance systems make it possible to process large amounts of data in real-time for strategic planning, advanced radar systems and combat training simulations. And as defense agencies migrate toward technological innovation and data-driven decision-making, supercomputers are central to advancing national security in a number of fields, including but not limited to autonomous vehicles, missile defense, and predictive analytics.
By End Use
The commercial industries segment dominated the largest share of the supercomputer market, accounting for approximately 55% of the revenue in 2023. The adoption of supercomputing solutions for databased decisions, analytics, and complex simulations in industries like finance, healthcare, retail, and manufacturing is driving this dominance. In business, supercomputers are used to model and optimize manufacturing processes, simulate products for design improvements and better customer experiences, and to drive innovation. The surge in demand for AI-based solutions, big data analytics, and cloud computing on the back of changes in businesses and consumers, is pushing companies across these sectors to invest their capital in supercomputing resources to maintain a competitive edge and improve overall business efficiency supporting the growth of this segment.
The research institutions segment is expected to be the fastest-growing segment in the supercomputer market over the forecast period from 2024 to 2032. The growing need for high-performance computing (HPC) to enable cutting-edge research in areas such as genomics, climate modeling, physics, and material science continues to fuel this expansion. Supercomputers for that and to drive breakthroughs and innovation are being picked up by research institutions utilizing complex simulations, data analysis and machine learning. As the funding for scientific research going on is also increasing rapidly, the demand for more powerful computing resources has increased which in turn led the research institutions to prioritize investments in supercomputing infrastructure, which is expected to drive the growth of this segment in the coming years.
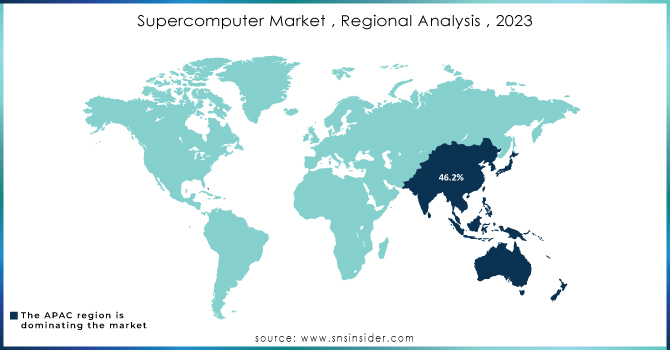
The Asia-Pacific region dominated the largest share of the supercomputer market, accounting for around 47% of the revenue in 2023. This dominance is primarily driven by investments in supercomputing infrastructure by the likes of China, Japan and South Korea governments and research institutes. China is continuing to dominate the world of supercomputing with a focus on AI, big data, and quantum computing, developing some of the world’s most powerful supercomputers. Japan and South Korea also play major roles, investing in AI, climate modeling, and industrial applications. The area's continued rise is powered by robust public sector backing, a growing pool of HPEC projects, and increasing demand from research entities and commercial industries.
The North American region is the fastest-growing in the supercomputer market over the forecast period 2024-2032. The expansion is mostly attributable to activity in the U.S., which hosts many research institutions, technology companies, and government agencies that emphasize progress in the area of supercomputing. High-performance computing (HPC), triggered by huge investments in AI, machine learning, and big data analytics, especially from NASA, the Department of Energy, and proprietary tech companies, is driving up demand. Canada's increasing role in AI research and its collaborations with international tech companies further drive growth in the area.
Need any customization research on Supercomputer Market - Enquiry Now
Some of the Major Key Players in Supercomputer Market along with their product:
Atos SE (France) – (HPC solutions, Cloud services, Big data analytics, Cybersecurity, IT services)
Cray (United States) – (Supercomputers, AI/ML solutions, Data analytics)
Dell Technologies (United States) – (Servers, Storage systems, Workstations, Laptops, Cloud solutions)
Fujitsu (Japan) – (Supercomputers, Servers, Storage solutions, Cloud computing, AI solutions)
Hewlett Packard Enterprise (HPE) (United States) – (Servers, Storage systems, Networking, Cloud solutions, AI-driven technology)
Honeywell International Inc. (United States) – (Quantum computing, Aerospace, Industrial automation)
International Business Machines (IBM) (United States) – (Mainframe computers, Watson AI, Cloud computing, Quantum computing)
Lenovo (China) – (Personal computers, Laptops, Servers, Workstations, Storage solutions, AI/ML solutions)
NEC Corporation (Japan) – (IT solutions, High-performance computing, Networking, Cybersecurity)
Nvidia Corporation (United States) – (GPUs, AI/ML solutions, Data center solutions, Autonomous vehicle tech)
Intel (United States) – (Processors, AI solutions, Data center solutions, Memory, FPGA)
D-Wave Systems (Canada) – (Quantum computing solutions, Quantum annealers)
SpaceX (United States) – (Reusable rockets, Satellite internet, Spacecraft)
CISCO (United States) – (Networking hardware, Software solutions, Cybersecurity)
Advanced Micro Devices (AMD) (United States) – (Processors, GPUs, Data center solutions)
List of Suppliers who provide raw material and component in Supercomputer Market
Intel (United States)
TSMC (Taiwan)
Samsung Electronics (South Korea)
Micron Technology (United States)
SK hynix (South Korea)
NVIDIA (United States)
Advanced Micro Devices (AMD) (United States)
Texas Instruments (United States)
Qualcomm (United States)
STMicroelectronics (Switzerland)
June 18, 2024 – Hewlett Packard Enterprise (HPE) and NVIDIA announced NVIDIA AI Computing by HPE, a co-developed AI solution portfolio aimed at accelerating the adoption of generative AI. The centerpiece, HPE Private Cloud AI, combines NVIDIA’s AI computing with HPE’s storage, compute, and GreenLake cloud to deliver an energy-efficient, scalable solution for enterprises.
January 15, 2025 – CoreWeave teams up with IBM to offer an AI supercomputer using the NVIDIA GB200 Grace Blackwell Superchip to train IBM's Granite models. Combining NVIDIA GB200 NVL72 systems with Quantum-2 InfiniBand networking and IBM Storage Scale System, the supercomputer is aimed to boost research and development of artificial intelligence.
February 12, 2025 – Fujitsu and Yokohama National University achieved the world’s first real-time prediction of tornadoes associated with typhoons using Fugaku supercomputer and the enhanced Cloud Resolving Storm Simulator (CReSS), reducing prediction time from 11 hours to 80 minutes. This breakthrough enables accurate, timely tornado predictions, significantly improving disaster preparedness.
| Report Attributes | Details |
|---|---|
| Market Size in 2023 | USD 9.66 Billion |
| Market Size by 2032 | USD 24.40 Billion |
| CAGR | CAGR of 10.84 % From 2024 to 2032 |
| Base Year | 2023 |
| Forecast Period | 2024-2032 |
| Historical Data | 2020-2022 |
| Report Scope & Coverage | Market Size, Segments Analysis, Competitive Landscape, Regional Analysis, DROC & SWOT Analysis, Forecast Outlook |
| Key Segments | • By Type (Vector Processing Machines, Tightly Connected Cluster Computer, Commodity Cluster) • By Application (Scientific Research, Weather Forecasting, Defence, Simulations, Others) • By End Use(Commercial Industries, Government Entities, Research Institutions) |
| Regional Analysis/Coverage | North America (US, Canada, Mexico), Europe (Eastern Europe [Poland, Romania, Hungary, Turkey, Rest of Eastern Europe] Western Europe] Germany, France, UK, Italy, Spain, Netherlands, Switzerland, Austria, Rest of Western Europe]), Asia Pacific (China, India, Japan, South Korea, Vietnam, Singapore, Australia, Rest of Asia Pacific), Middle East & Africa (Middle East [UAE, Egypt, Saudi Arabia, Qatar, Rest of Middle East], Africa [Nigeria, South Africa, Rest of Africa], Latin America (Brazil, Argentina, Colombia, Rest of Latin America) |
| Company Profiles | Atos SE (France), Cray (United States), Dell Technologies (United States), Fujitsu (Japan), Hewlett Packard Enterprise (HPE) (United States), Honeywell International Inc. (United States), International Business Machines (IBM) (United States), Lenovo (China), NEC Corporation (Japan), Nvidia Corporation (United States), Intel (United States), D-Wave Systems (Canada), SpaceX (United States), CISCO (United States), Advanced Micro Devices (AMD) (United States). |
Increasing popularity of cloud computing and Rising need for more processing power is propelling
Increasing need for high-performance computer systems in a variety of industries and Advancement in Technology.
Supercomputer Market size was valued at USD 12.91 billion in 2022
USD 12.99 billion is expected to grow by 2030.
Supercomputer Market is anticipated to expand by 0.09 % from 2023 to 2030.
Table of Content
1. Introduction
1.1 Market Definition
1.2 Scope (Inclusion and Exclusions)
1.3 Research Assumptions
2. Executive Summary
2.1 Market Overview
2.2 Regional Synopsis
2.3 Competitive Summary
3. Research Methodology
3.1 Top-Down Approach
3.2 Bottom-up Approach
3.3. Data Validation
3.4 Primary Interviews
4. Market Dynamics Impact Analysis
4.1 Market Driving Factors Analysis
4.1.1 Drivers
4.1.2 Restraints
4.1.3 Opportunities
4.1.4 Challenges
4.2 PESTLE Analysis
4.3 Porter’s Five Forces Model
5. Statistical Insights and Trends Reporting
5.1 Installed Base of Supercomputers
5.2 Energy Consumption
5.3 Supercomputing System Reliability
5.4 Expenditure on AI/ML-related Supercomputing
6. Competitive Landscape
6.1 List of Major Companies, By Region
6.2 Market Share Analysis, By Region
6.3 Product Benchmarking
6.3.1 Product specifications and features
6.3.2 Pricing
6.4 Strategic Initiatives
6.4.1 Marketing and promotional activities
6.4.2 Distribution and supply chain strategies
6.4.3 Expansion plans and new product launches
6.4.4 Strategic partnerships and collaborations
6.5 Technological Advancements
6.6 Market Positioning and Branding
7. Supercomputer Market Segmentation, by Type
7.1 Chapter Overview
7.2 Vector Processing Machines
7.2.1 Vector Processing Machines Market Trends Analysis (2020-2032)
7.2.2 Vector Processing Machines Market Size Estimates and Forecasts to 2032 (USD Billion)
7.3 Tightly Connected Cluster Computer
7.3.1 Tightly Connected Cluster Computer Market Trends Analysis (2020-2032)
7.3.2 Tightly Connected Cluster Computer Market Size Estimates and Forecasts to 2032 (USD Billion)
7.4 Commodity Cluster
7.4.1 Commodity Cluster Market Trends Analysis (2020-2032)
7.4.2 Commodity Cluster Market Size Estimates and Forecasts to 2032 (USD Billion)
8. Supercomputer Market Segmentation, by Application
8.1 Chapter Overview
8.2 Scientific Research
8.2.1 Scientific Research Market Trends Analysis (2020-2032)
8.2.2 Scientific Research Market Size Estimates and Forecasts to 2032 (USD Billion)
8.3 Weather Forecasting
8.3.1 Weather Forecasting Market Trends Analysis (2020-2032)
8.3.2 Weather Forecasting Market Size Estimates and Forecasts to 2032 (USD Billion)
8.4 Magnetic Guidance
8.4.1 Magnetic Guidance Market Trends Analysis (2020-2032)
8.4.2 Magnetic Guidance Market Size Estimates and Forecasts to 2032 (USD Billion)
8.5 Defence
8.5.1 Defence Market Trends Analysis (2020-2032)
8.5.2 Defence Market Size Estimates and Forecasts to 2032 (USD Billion)
8.6 Simulations
8.6.1 Simulations Market Trends Analysis (2020-2032)
8.6.2 Simulations Market Size Estimates and Forecasts to 2032 (USD Billion)
8.7 Others
8.7.1 Others Market Trends Analysis (2020-2032)
8.7.2 Others Market Size Estimates and Forecasts to 2032 (USD Billion)
9. Supercomputer Market Segmentation, by End Use
9.1 Chapter Overview
9.2 Commercial Industries
9.2.1 Commercial Industries Market Trends Analysis (2020-2032)
9.2.2 Commercial Industries Market Size Estimates and Forecasts to 2032 (USD Billion)
9.3 Government Entities
9.3.1 Government Entities Market Trends Analysis (2020-2032)
9.3.2 Government Entities Market Size Estimates and Forecasts to 2032 (USD Billion)
9.4 Research Institutions
9.4.1 Research Institutions Market Trends Analysis (2020-2032)
9.4.2 Research Institutions Market Size Estimates and Forecasts to 2032 (USD Billion)
10. Regional Analysis
10.1 Chapter Overview
10.2 North America
10.2.1 Trends Analysis
10.2.2 North America Supercomputer Market Estimates and Forecasts, by Country (2020-2032) (USD Billion)
10.2.3 North America Supercomputer Market Estimates and Forecasts, by Type (2020-2032) (USD Billion)
10.2.4 North America Supercomputer Market Estimates and Forecasts, by Application (2020-2032) (USD Billion)
10.2.5 North America Supercomputer Market Estimates and Forecasts, by End Use (2020-2032) (USD Billion)
10.2.6 USA
10.2.6.1 USA Supercomputer Market Estimates and Forecasts, by Type (2020-2032) (USD Billion)
10.2.6.2 USA Supercomputer Market Estimates and Forecasts, by Application (2020-2032) (USD Billion)
10.2.6.3 USA Supercomputer Market Estimates and Forecasts, by End Use (2020-2032) (USD Billion)
10.2.7 Canada
10.2.7.1 Canada Supercomputer Market Estimates and Forecasts, by Type (2020-2032) (USD Billion)
10.2.7.2 Canada Supercomputer Market Estimates and Forecasts, by Application (2020-2032) (USD Billion)
10.2.7.3 Canada Supercomputer Market Estimates and Forecasts, by End Use (2020-2032) (USD Billion)
10.2.8 Mexico
10.2.8.1 Mexico Supercomputer Market Estimates and Forecasts, by Type (2020-2032) (USD Billion)
10.2.8.2 Mexico Supercomputer Market Estimates and Forecasts, by Application (2020-2032) (USD Billion)
10.2.8.3 Mexico Supercomputer Market Estimates and Forecasts, by End Use (2020-2032) (USD Billion)
10.3 Europe
10.3.1 Eastern Europe
10.3.1.1 Trends Analysis
10.3.1.2 Eastern Europe Supercomputer Market Estimates and Forecasts, by Country (2020-2032) (USD Billion)
10.3.1.3 Eastern Europe Supercomputer Market Estimates and Forecasts, by Type (2020-2032) (USD Billion)
10.3.1.4 Eastern Europe Supercomputer Market Estimates and Forecasts, by Application (2020-2032) (USD Billion)
10.3.1.5 Eastern Europe Supercomputer Market Estimates and Forecasts, by End Use (2020-2032) (USD Billion)
10.3.1.6 Poland
10.3.1.6.1 Poland Supercomputer Market Estimates and Forecasts, by Type (2020-2032) (USD Billion)
10.3.1.6.2 Poland Supercomputer Market Estimates and Forecasts, by Application (2020-2032) (USD Billion)
10.3.1.6.3 Poland Supercomputer Market Estimates and Forecasts, by End Use (2020-2032) (USD Billion)
10.3.1.7 Romania
10.3.1.7.1 Romania Supercomputer Market Estimates and Forecasts, by Type (2020-2032) (USD Billion)
10.3.1.7.2 Romania Supercomputer Market Estimates and Forecasts, by Application (2020-2032) (USD Billion)
10.3.1.7.3 Romania Supercomputer Market Estimates and Forecasts, by End Use (2020-2032) (USD Billion)
10.3.1.8 Hungary
10.3.1.8.1 Hungary Supercomputer Market Estimates and Forecasts, by Type (2020-2032) (USD Billion)
10.3.1.8.2 Hungary Supercomputer Market Estimates and Forecasts, by Application (2020-2032) (USD Billion)
10.3.1.8.3 Hungary Supercomputer Market Estimates and Forecasts, by End Use (2020-2032) (USD Billion)
10.3.1.9 Turkey
10.3.1.9.1 Turkey Supercomputer Market Estimates and Forecasts, by Type (2020-2032) (USD Billion)
10.3.1.9.2 Turkey Supercomputer Market Estimates and Forecasts, by Application (2020-2032) (USD Billion)
10.3.1.9.3 Turkey Supercomputer Market Estimates and Forecasts, by End Use (2020-2032) (USD Billion)
10.3.1.10 Rest of Eastern Europe
10.3.1.10.1 Rest of Eastern Europe Supercomputer Market Estimates and Forecasts, by Type (2020-2032) (USD Billion)
10.3.1.10.2 Rest of Eastern Europe Supercomputer Market Estimates and Forecasts, by Application (2020-2032) (USD Billion)
10.3.1.10.3 Rest of Eastern Europe Supercomputer Market Estimates and Forecasts, by End Use (2020-2032) (USD Billion)
10.3.2 Western Europe
10.3.2.1 Trends Analysis
10.3.2.2 Western Europe Supercomputer Market Estimates and Forecasts, by Country (2020-2032) (USD Billion)
10.3.2.3 Western Europe Supercomputer Market Estimates and Forecasts, by Type (2020-2032) (USD Billion)
10.3.2.4 Western Europe Supercomputer Market Estimates and Forecasts, by Application (2020-2032) (USD Billion)
10.3.2.5 Western Europe Supercomputer Market Estimates and Forecasts, by End Use (2020-2032) (USD Billion)
10.3.2.6 Germany
10.3.2.6.1 Germany Supercomputer Market Estimates and Forecasts, by Type (2020-2032) (USD Billion)
10.3.2.6.2 Germany Supercomputer Market Estimates and Forecasts, by Application (2020-2032) (USD Billion)
10.3.2.6.3 Germany Supercomputer Market Estimates and Forecasts, by End Use (2020-2032) (USD Billion)
10.3.2.7 France
10.3.2.7.1 France Supercomputer Market Estimates and Forecasts, by Type (2020-2032) (USD Billion)
10.3.2.7.2 France Supercomputer Market Estimates and Forecasts, by Application (2020-2032) (USD Billion)
10.3.2.7.3 France Supercomputer Market Estimates and Forecasts, by End Use (2020-2032) (USD Billion)
10.3.2.8 UK
10.3.2.8.1 UK Supercomputer Market Estimates and Forecasts, by Type (2020-2032) (USD Billion)
10.3.2.8.2 UK Supercomputer Market Estimates and Forecasts, by Application (2020-2032) (USD Billion)
10.3.2.8.3 UK Supercomputer Market Estimates and Forecasts, by End Use (2020-2032) (USD Billion)
10.3.2.9 Italy
10.3.2.9.1 Italy Supercomputer Market Estimates and Forecasts, by Type (2020-2032) (USD Billion)
10.3.2.9.2 Italy Supercomputer Market Estimates and Forecasts, by Application (2020-2032) (USD Billion)
10.3.2.9.3 Italy Supercomputer Market Estimates and Forecasts, by End Use (2020-2032) (USD Billion)
10.3.2.10 Spain
10.3.2.10.1 Spain Supercomputer Market Estimates and Forecasts, by Type (2020-2032) (USD Billion)
10.3.2.10.2 Spain Supercomputer Market Estimates and Forecasts, by Application (2020-2032) (USD Billion)
10.3.2.10.3 Spain Supercomputer Market Estimates and Forecasts, by End Use (2020-2032) (USD Billion)
10.3.2.11 Netherlands
10.3.2.11.1 Netherlands Supercomputer Market Estimates and Forecasts, by Type (2020-2032) (USD Billion)
10.3.2.11.2 Netherlands Supercomputer Market Estimates and Forecasts, by Application (2020-2032) (USD Billion)
10.3.2.11.3 Netherlands Supercomputer Market Estimates and Forecasts, by End Use (2020-2032) (USD Billion)
10.3.2.12 Switzerland
10.3.2.12.1 Switzerland Supercomputer Market Estimates and Forecasts, by Type (2020-2032) (USD Billion)
10.3.2.12.2 Switzerland Supercomputer Market Estimates and Forecasts, by Application (2020-2032) (USD Billion)
10.3.2.12.3 Switzerland Supercomputer Market Estimates and Forecasts, by End Use (2020-2032) (USD Billion)
10.3.2.13 Austria
10.3.2.13.1 Austria Supercomputer Market Estimates and Forecasts, by Type (2020-2032) (USD Billion)
10.3.2.13.2 Austria Supercomputer Market Estimates and Forecasts, by Application (2020-2032) (USD Billion)
10.3.2.13.3 Austria Supercomputer Market Estimates and Forecasts, by End Use (2020-2032) (USD Billion)
10.3.2.14 Rest of Western Europe
10.3.2.14.1 Rest of Western Europe Supercomputer Market Estimates and Forecasts, by Type (2020-2032) (USD Billion)
10.3.2.14.2 Rest of Western Europe Supercomputer Market Estimates and Forecasts, by Application (2020-2032) (USD Billion)
10.3.2.14.3 Rest of Western Europe Supercomputer Market Estimates and Forecasts, by End Use (2020-2032) (USD Billion)
10.4 Asia Pacific
10.4.1 Trends Analysis
10.4.2 Asia Pacific Supercomputer Market Estimates and Forecasts, by Country (2020-2032) (USD Billion)
10.4.3 Asia Pacific Supercomputer Market Estimates and Forecasts, by Type (2020-2032) (USD Billion)
10.4.4 Asia Pacific Supercomputer Market Estimates and Forecasts, by Application (2020-2032) (USD Billion)
10.4.5 Asia Pacific Supercomputer Market Estimates and Forecasts, by End Use (2020-2032) (USD Billion)
10.4.6 China
10.4.6.1 China Supercomputer Market Estimates and Forecasts, by Type (2020-2032) (USD Billion)
10.4.6.2 China Supercomputer Market Estimates and Forecasts, by Application (2020-2032) (USD Billion)
10.4.6.3 China Supercomputer Market Estimates and Forecasts, by End Use (2020-2032) (USD Billion)
10.4.7 India
10.4.7.1 India Supercomputer Market Estimates and Forecasts, by Type (2020-2032) (USD Billion)
10.4.7.2 India Supercomputer Market Estimates and Forecasts, by Application (2020-2032) (USD Billion)
10.4.7.3 India Supercomputer Market Estimates and Forecasts, by End Use (2020-2032) (USD Billion)
10.4.8 Japan
10.4.8.1 Japan Supercomputer Market Estimates and Forecasts, by Type (2020-2032) (USD Billion)
10.4.8.2 Japan Supercomputer Market Estimates and Forecasts, by Application (2020-2032) (USD Billion)
10.4.8.3 Japan Supercomputer Market Estimates and Forecasts, by End Use (2020-2032) (USD Billion)
10.4.9 South Korea
10.4.9.1 South Korea Supercomputer Market Estimates and Forecasts, by Type (2020-2032) (USD Billion)
10.4.9.2 South Korea Supercomputer Market Estimates and Forecasts, by Application (2020-2032) (USD Billion)
10.4.9.3 South Korea Supercomputer Market Estimates and Forecasts, by End Use (2020-2032) (USD Billion)
10.4.10 Vietnam
10.4.10.1 Vietnam Supercomputer Market Estimates and Forecasts, by Type (2020-2032) (USD Billion)
10.4.10.2 Vietnam Supercomputer Market Estimates and Forecasts, by Application (2020-2032) (USD Billion)
10.4.10.3 Vietnam Supercomputer Market Estimates and Forecasts, by End Use (2020-2032) (USD Billion)
10.4.11 Singapore
10.4.11.1 Singapore Supercomputer Market Estimates and Forecasts, by Type (2020-2032) (USD Billion)
10.4.11.2 Singapore Supercomputer Market Estimates and Forecasts, by Application (2020-2032) (USD Billion)
10.4.11.3 Singapore Supercomputer Market Estimates and Forecasts, by End Use (2020-2032) (USD Billion)
10.4.12 Australia
10.4.12.1 Australia Supercomputer Market Estimates and Forecasts, by Type (2020-2032) (USD Billion)
10.4.12.2 Australia Supercomputer Market Estimates and Forecasts, by Application (2020-2032) (USD Billion)
10.4.12.3 Australia Supercomputer Market Estimates and Forecasts, by End Use (2020-2032) (USD Billion)
10.4.13 Rest of Asia Pacific
10.4.13.1 Rest of Asia Pacific Supercomputer Market Estimates and Forecasts, by Type (2020-2032) (USD Billion)
10.4.13.2 Rest of Asia Pacific Supercomputer Market Estimates and Forecasts, by Application (2020-2032) (USD Billion)
10.4.13.3 Rest of Asia Pacific Supercomputer Market Estimates and Forecasts, by End Use (2020-2032) (USD Billion)
10.5 Middle East and Africa
10.5.1 Middle East
10.5.1.1 Trends Analysis
10.5.1.2 Middle East Supercomputer Market Estimates and Forecasts, by Country (2020-2032) (USD Billion)
10.5.1.3 Middle East Supercomputer Market Estimates and Forecasts, by Type (2020-2032) (USD Billion)
10.5.1.4 Middle East Supercomputer Market Estimates and Forecasts, by Application (2020-2032) (USD Billion)
10.5.1.5 Middle East Supercomputer Market Estimates and Forecasts, by End Use (2020-2032) (USD Billion)
10.5.1.6 UAE
10.5.1.6.1 UAE Supercomputer Market Estimates and Forecasts, by Type (2020-2032) (USD Billion)
10.5.1.6.2 UAE Supercomputer Market Estimates and Forecasts, by Application (2020-2032) (USD Billion)
10.5.1.6.3 UAE Supercomputer Market Estimates and Forecasts, by End Use (2020-2032) (USD Billion)
10.5.1.7 Egypt
10.5.1.7.1 Egypt Supercomputer Market Estimates and Forecasts, by Type (2020-2032) (USD Billion)
10.5.1.7.2 Egypt Supercomputer Market Estimates and Forecasts, by Application (2020-2032) (USD Billion)
10.5.1.7.3 Egypt Supercomputer Market Estimates and Forecasts, by End Use (2020-2032) (USD Billion)
10.5.1.8 Saudi Arabia
10.5.1.8.1 Saudi Arabia Supercomputer Market Estimates and Forecasts, by Type (2020-2032) (USD Billion)
10.5.1.8.2 Saudi Arabia Supercomputer Market Estimates and Forecasts, by Application (2020-2032) (USD Billion)
10.5.1.8.3 Saudi Arabia Supercomputer Market Estimates and Forecasts, by End Use (2020-2032) (USD Billion)
10.5.1.9 Qatar
10.5.1.9.1 Qatar Supercomputer Market Estimates and Forecasts, by Type (2020-2032) (USD Billion)
10.5.1.9.2 Qatar Supercomputer Market Estimates and Forecasts, by Application (2020-2032) (USD Billion)
10.5.1.9.3 Qatar Supercomputer Market Estimates and Forecasts, by End Use (2020-2032) (USD Billion)
10.5.1.10 Rest of Middle East
10.5.1.10.1 Rest of Middle East Supercomputer Market Estimates and Forecasts, by Type (2020-2032) (USD Billion)
10.5.1.10.2 Rest of Middle East Supercomputer Market Estimates and Forecasts, by Application (2020-2032) (USD Billion)
10.5.1.10.3 Rest of Middle East Supercomputer Market Estimates and Forecasts, by End Use (2020-2032) (USD Billion)
10.5.2 Africa
10.5.2.1 Trends Analysis
10.5.2.2 Africa Supercomputer Market Estimates and Forecasts, by Country (2020-2032) (USD Billion)
10.5.2.3 Africa Supercomputer Market Estimates and Forecasts, by Type (2020-2032) (USD Billion)
10.5.2.4 Africa Supercomputer Market Estimates and Forecasts, by Application (2020-2032) (USD Billion)
10.5.2.5 Africa Supercomputer Market Estimates and Forecasts, by End Use (2020-2032) (USD Billion)
10.5.2.6 South Africa
10.5.2.6.1 South Africa Supercomputer Market Estimates and Forecasts, by Type (2020-2032) (USD Billion)
10.5.2.6.2 South Africa Supercomputer Market Estimates and Forecasts, by Application (2020-2032) (USD Billion)
10.5.2.6.3 South Africa Supercomputer Market Estimates and Forecasts, by End Use (2020-2032) (USD Billion)
10.5.2.7 Nigeria
10.5.2.7.1 Nigeria Supercomputer Market Estimates and Forecasts, by Type (2020-2032) (USD Billion)
10.5.2.7.2 Nigeria Supercomputer Market Estimates and Forecasts, by Application (2020-2032) (USD Billion)
10.5.2.7.3 Nigeria Supercomputer Market Estimates and Forecasts, by End Use (2020-2032) (USD Billion)
10.5.2.8 Rest of Africa
10.5.2.8.1 Rest of Africa Supercomputer Market Estimates and Forecasts, by Type (2020-2032) (USD Billion)
10.5.2.8.2 Rest of Africa Supercomputer Market Estimates and Forecasts, by Application (2020-2032) (USD Billion)
10.5.2.8.3 Rest of Africa Supercomputer Market Estimates and Forecasts, by End Use (2020-2032) (USD Billion)
10.6 Latin America
10.6.1 Trends Analysis
10.6.2 Latin America Supercomputer Market Estimates and Forecasts, by Country (2020-2032) (USD Billion)
10.6.3 Latin America Supercomputer Market Estimates and Forecasts, by Type (2020-2032) (USD Billion)
10.6.4 Latin America Supercomputer Market Estimates and Forecasts, by Application (2020-2032) (USD Billion)
10.6.5 Latin America Supercomputer Market Estimates and Forecasts, by End Use (2020-2032) (USD Billion)
10.6.6 Brazil
10.6.6.1 Brazil Supercomputer Market Estimates and Forecasts, by Type (2020-2032) (USD Billion)
10.6.6.2 Brazil Supercomputer Market Estimates and Forecasts, by Application (2020-2032) (USD Billion)
10.6.6.3 Brazil Supercomputer Market Estimates and Forecasts, by End Use (2020-2032) (USD Billion)
10.6.7 Argentina
10.6.7.1 Argentina Supercomputer Market Estimates and Forecasts, by Type (2020-2032) (USD Billion)
10.6.7.2 Argentina Supercomputer Market Estimates and Forecasts, by Application (2020-2032) (USD Billion)
10.6.7.3 Argentina Supercomputer Market Estimates and Forecasts, by End Use (2020-2032) (USD Billion)
10.6.8 Colombia
10.6.8.1 Colombia Supercomputer Market Estimates and Forecasts, by Type (2020-2032) (USD Billion)
10.6.8.2 Colombia Supercomputer Market Estimates and Forecasts, by Application (2020-2032) (USD Billion)
10.6.8.3 Colombia Supercomputer Market Estimates and Forecasts, by End Use (2020-2032) (USD Billion)
10.6.9 Rest of Latin America
10.6.9.1 Rest of Latin America Supercomputer Market Estimates and Forecasts, by Type (2020-2032) (USD Billion)
10.6.9.2 Rest of Latin America Supercomputer Market Estimates and Forecasts, by Application (2020-2032) (USD Billion)
10.6.9.3 Rest of Latin America Supercomputer Market Estimates and Forecasts, by End Use (2020-2032) (USD Billion)
11. Company Profiles
11.1 Atos SE
11.1.1 Company Overview
11.1.2 Financial
11.1.3 Products/ Services Offered
11.1.4 SWOT Analysis
11.2 Cray
11.2.1 Company Overview
11.2.2 Financial
11.2.3 Products/ Services Offered
11.2.4 SWOT Analysis
11.3 Dell Technologies
11.3.1 Company Overview
11.3.2 Financial
11.3.3 Products/ Services Offered
11.3.4 SWOT Analysis
11.4 Fujitsu
11.4.1 Company Overview
11.4.2 Financial
11.4.3 Products/ Services Offered
11.4.4 SWOT Analysis
11.5 Hewlett Packard Enterprise (HPE)
11.5.1 Company Overview
11.5.2 Financial
11.5.3 Products/ Services Offered
11.5.4 SWOT Analysis
11.6 Honeywell International Inc.
11.6.1 Company Overview
11.6.2 Financial
11.6.3 Products/ Services Offered
11.6.4 SWOT Analysis
11.7 International Business Machines (IBM)
11.7.1 Company Overview
11.7.2 Financial
11.7.3 Products/ Services Offered
11.7.4 SWOT Analysis
11.8 Lenovo
11.8.1 Company Overview
11.8.2 Financial
11.8.3 Products/ Services Offered
11.8.4 SWOT Analysis
11.9 NEC Corporation
11.9.1 Company Overview
11.9.2 Financial
11.9.3 Products/ Services Offered
11.9.4 SWOT Analysis
11.10 Nvidia Corporation
11.10.1 Company Overview
11.10.2 Financial
11.10.3 Products/ Services Offered
11.10.4 SWOT Analysis
12. Use Cases and Best Practices
13. Conclusion
An accurate research report requires proper strategizing as well as implementation. There are multiple factors involved in the completion of good and accurate research report and selecting the best methodology to compete the research is the toughest part. Since the research reports we provide play a crucial role in any company’s decision-making process, therefore we at SNS Insider always believe that we should choose the best method which gives us results closer to reality. This allows us to reach at a stage wherein we can provide our clients best and accurate investment to output ratio.
Each report that we prepare takes a timeframe of 350-400 business hours for production. Starting from the selection of titles through a couple of in-depth brain storming session to the final QC process before uploading our titles on our website we dedicate around 350 working hours. The titles are selected based on their current market cap and the foreseen CAGR and growth.
The 5 steps process:
Step 1: Secondary Research:
Secondary Research or Desk Research is as the name suggests is a research process wherein, we collect data through the readily available information. In this process we use various paid and unpaid databases which our team has access to and gather data through the same. This includes examining of listed companies’ annual reports, Journals, SEC filling etc. Apart from this our team has access to various associations across the globe across different industries. Lastly, we have exchange relationships with various university as well as individual libraries.

Step 2: Primary Research
When we talk about primary research, it is a type of study in which the researchers collect relevant data samples directly, rather than relying on previously collected data. This type of research is focused on gaining content specific facts that can be sued to solve specific problems. Since the collected data is fresh and first hand therefore it makes the study more accurate and genuine.
We at SNS Insider have divided Primary Research into 2 parts.
Part 1 wherein we interview the KOLs of major players as well as the upcoming ones across various geographic regions. This allows us to have their view over the market scenario and acts as an important tool to come closer to the accurate market numbers. As many as 45 paid and unpaid primary interviews are taken from both the demand and supply side of the industry to make sure we land at an accurate judgement and analysis of the market.
This step involves the triangulation of data wherein our team analyses the interview transcripts, online survey responses and observation of on filed participants. The below mentioned chart should give a better understanding of the part 1 of the primary interview.

Part 2: In this part of primary research the data collected via secondary research and the part 1 of the primary research is validated with the interviews from individual consultants and subject matter experts.
Consultants are those set of people who have at least 12 years of experience and expertise within the industry whereas Subject Matter Experts are those with at least 15 years of experience behind their back within the same space. The data with the help of two main processes i.e., FGDs (Focused Group Discussions) and IDs (Individual Discussions). This gives us a 3rd party nonbiased primary view of the market scenario making it a more dependable one while collation of the data pointers.
Step 3: Data Bank Validation
Once all the information is collected via primary and secondary sources, we run that information for data validation. At our intelligence centre our research heads track a lot of information related to the market which includes the quarterly reports, the daily stock prices, and other relevant information. Our data bank server gets updated every fortnight and that is how the information which we collected using our primary and secondary information is revalidated in real time.

Step 4: QA/QC Process
After all the data collection and validation our team does a final level of quality check and quality assurance to get rid of any unwanted or undesired mistakes. This might include but not limited to getting rid of the any typos, duplication of numbers or missing of any important information. The people involved in this process include technical content writers, research heads and graphics people. Once this process is completed the title gets uploader on our platform for our clients to read it.
Step 5: Final QC/QA Process:
This is the last process and comes when the client has ordered the study. In this process a final QA/QC is done before the study is emailed to the client. Since we believe in giving our clients a good experience of our research studies, therefore, to make sure that we do not lack at our end in any way humanly possible we do a final round of quality check and then dispatch the study to the client.
Key Segments:
By Type
Vector Processing Machines
Tightly Connected Cluster Computer
Commodity Cluster
By Application
Scientific Research
Weather Forecasting
Defence
Simulations
Others
By End Use
Commercial Industries
Government Entities
Research Institutions
Request for Segment Customization as per your Business Requirement: Segment Customization Request
Regional Coverage:
North America
US
Canada
Mexico
Europe
Eastern Europe
Poland
Romania
Hungary
Turkey
Rest of Eastern Europe
Western Europe
Germany
France
UK
Italy
Spain
Netherlands
Switzerland
Austria
Rest of Western Europe
Asia Pacific
China
India
Japan
South Korea
Vietnam
Singapore
Australia
Rest of Asia Pacific
Middle East & Africa
Middle East
UAE
Egypt
Saudi Arabia
Qatar
Rest of Middle East
Africa
Nigeria
South Africa
Rest of Africa
Latin America
Brazil
Argentina
Colombia
Rest of Latin America
Request for Country Level Research Report: Country Level Customization Request
Available Customization
With the given market data, SNS Insider offers customization as per the company’s specific needs. The following customization options are available for the report:
Detailed Volume Analysis
Criss-Cross segment analysis (e.g. Product X Application)
Competitive Product Benchmarking
Geographic Analysis
Additional countries in any of the regions
Customized Data Representation
Detailed analysis and profiling of additional market players
The Autonomous Last Mile Delivery Market size was valued at USD 1.10 Billion in 2023. It is estimated to reach USD 7.10 Billion by 2032, growing at a CAGR of 23.06% during 2024-2032.
The E-Compass Market Size was valued at USD 2.27 Billion in 2023 and is expected to grow at a CAGR of 11.93% to reach USD 6.26 Billion by 2032.
The Pet Wearable Market Size was valued at USD 3.27 billion in 2023 and is expected to grow at a CAGR of 14.77% to reach USD 11.25 billion by 2032.
The Mobile Augmented Reality Market was valued at USD 29.2 Billion in 2023 and is expected to reach USD 327.7 Billion by 2032, growing at a CAGR of 30.84%% from 2024-2032.
The Home Security Systems Market was valued at USD 54.9 billion in 2023 and is projected to reach USD 109.18 billion by 2032, growing at a CAGR of 7.94% from 2024 to 2032.
The Automatic Ticket Machine Market Size was valued at USD 13.19 Billion in 2023 and is expected to grow at 13.11% CAGR to reach USD 39.91 Billion by 2032.

Hi! Click one of our member below to chat on Phone
© 2025 All Rights Reserved by SNS Insider Pvt Ltd


