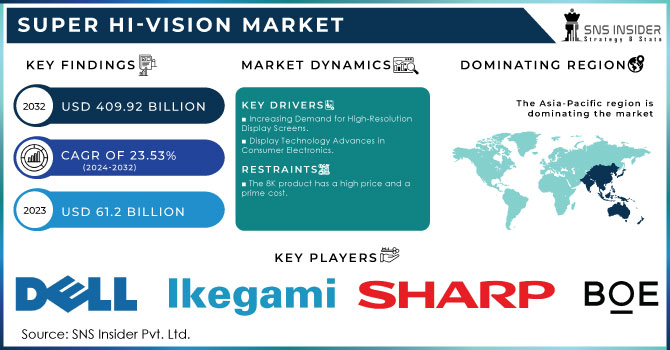
Super Hi-Vision Market was valued at USD 920 Million in 2023 and is expected to reach USD 4320 Million by 2032, growing at a CAGR of 18.89% from 2024-2032. This report includes Adoption Rate, Consumer Demand Trends, Investment & R&D Spending, Display Panel Production Capacity, and Regulatory & Standardization Data. The market is witnessing rapid expansion due to increasing adoption of 4K and 8K technologies across consumer and commercial applications. Rising demand for high-resolution content, advancements in display panels, and growing investments in R&D are accelerating growth. Additionally, regulatory bodies are establishing standards to streamline broadcasting and manufacturing, further shaping market evolution.
Get more information on Super Hi-Vision Market - Request Free Sample Report
Drivers
Rising Adoption of 8K Broadcasting, Streaming, and Immersive Media Experiences Driving Demand for High-Resolution Displays and Advanced Viewing Technologies.
The rapid adoption of 8K broadcasting and streaming services is revolutionizing the media sector due to growing consumer demand for higher visual clarity. Broadcasters and streaming services are committing to high-definition content creation, which gives users sharper and more detailed images. The gaming, sports, and entertainment sectors are also utilizing Super Hi-Vision technology to develop ultra-immersive environments and bring closer reality and interaction. The need for big-screen displays, sophisticated rendering technologies, and high-speed networks is increasing as consumers want seamless, high-fidelity experiences. As content ecosystems grow, the demand for innovative display solutions and high-bandwidth infrastructure will keep on speeding up, further solidifying the market's growth path.
Restraints
High Costs of 8K Displays, Cameras, and Broadcasting Equipment Slowing Adoption and Hindering Large-Scale Implementation Across Consumer and Professional Markets.
The widespread implementation of Super Hi-Vision technology faces significant challenges due to the high cost of 8K displays, cameras, and broadcasting infrastructure. Consumers and businesses hesitate to invest in premium 8K televisions, professional recording equipment, and advanced processing systems due to their steep pricing. Content producers and broadcasters are also reluctant to pay for the upgrade of production pipelines, thus making the large-scale production of 8K content less practical. Also, high-end applications that need high-resolution images, including gaming, healthcare, and digital marketing, are held back by the exorbitant costs of making the switch to 8K workflows. As long as affordability does not increase and economies of scale reduce prices, adoption will be sluggish, impacting overall market growth.
Opportunities
Rising Demand for Ultra-Realistic 8K Gaming, Virtual Reality, and Augmented Reality Experiences Accelerating Market Expansion
The video gaming world is moving fast, with 8K resolution testing the limits of visual realism and immersion. High-fidelity graphics, more detailed textures, and realistic rendering are being utilized by game makers to design more immersive experiences. Virtual reality and augmented reality solutions also enjoy Super Hi-Vision technology, offering clearer visuals and eliminating motion blur for uninterrupted interaction. With improved high-performance GPUs and next-generation gaming consoles as well as better display technologies, 8K-capable hardware and content will grow in demand. Cloud gaming, AI-optimized graphics upgrade, and metaverse use are the growing concerns, further establishing ultra-high-definition graphics as an indispensable driver of the future of gaming, and hence Super Hi-Vision technology stands as an absolute necessity.
Challenges
Massive Data Transfer Speeds and Storage Demands Creating Infrastructure Strain for 8K Content Adoption
Switching to 8K resolution calls for much more bandwidth and storage space, posing huge challenges to both consumers and content creators. Streaming of Super Hi-Vision content necessitates broadband internet connections and sophisticated compression algorithms to provide seamless playback without buffering. Furthermore, 8K video files are significantly larger in size than 4K ones, calling for enormous storage capacity and robust processing power for editing and dissemination. Existing cloud and on-site storage methods find it difficult to match the mounting loads of data, thereby placing added costs on the service providers. Without advances in network infrastructure, compression codes, and storage media that will manage ultra-high-resolution material, far-reaching utilization of Super Hi-Vision technology will continue to prove problematic.
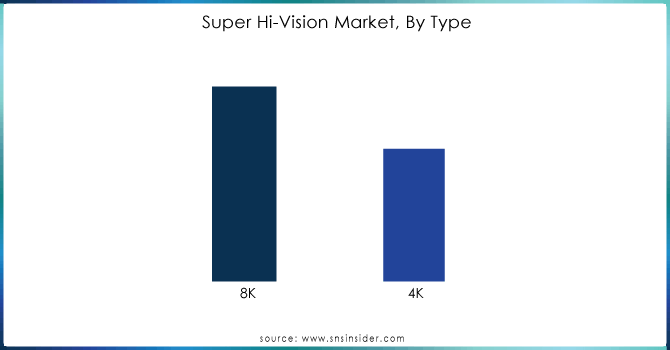
By Type
The 4K segment dominated the super hi-vision market with a 70% share of revenue in 2023, owing to its extensive adoption in televisions, gaming, streaming, and professional use. Low cost, high availability of content, and compatibility with legacy broadcasting and internet infrastructure helped its dominance. 4K resolution has been universally adopted by streaming platforms, gaming consoles, and digital signage and is now the industry norm. Also, reduced bandwidth and storage demands relative to 8K have fueled its uptake by consumers and businesses alike, cementing its leadership market share.
The 8K segment expected to experience the fastest growth at a 20.97% CAGR during 2024-2032, catalyzed by technology developments, rising investments in high-resolution content, and broadening applications across gaming, broadcasting, and medical imaging. As 8K TVs, cameras, and streaming services become cheaper, consumer demand is increasing. The gaming and virtual reality markets are also driving ultra-realistic video demand. Also, the adoption of 5G and fiber-optic high-speed networks will increase smooth 8K streaming, and hence it will be the most growing segment in the next few years.
By Applications
The consumer electronics segment dominated the super hi-vision market with a 62% revenue share in 2023 due to the common usage of 4K and 8K TVs, gaming consoles, and high-definition streaming devices. Growing demand from consumers for immersive entertainment content, along with the presence of affordable 4K TVs and advancing 8K technology, helped it be a market leader. Strong penetration of smart TVs, high-performance monitors, and next-generation gaming systems also added to this segment, making it the largest revenue-generating segment in the market.
The commercial electronics segment with the rapid growth at a 21.51% CAGR between 2024-2032, driven by the increasing use of 8K digital signage, high-resolution medical imaging, surveillance, and corporate display solutions. Companies are investing in huge-size 8K displays for advertising, exhibitions, and control rooms to increase visual interaction. Also, healthcare, education, and professional AV segments are adopting high-resolution displays for high-definition imaging and presentations. With increasing affordability, 8K technology demand from commercial use cases will push it to such high growth levels.
Get a Customized Report as per your Business Requirement - Request For Customized Report
By Technology
The led segment dominated the super hi-vision industry with a revenue share of 46% in 2023 on account of cost savings, excellent brightness, and extensive utilization across televisions, digital displays, and business displays. With LED technology benefiting from energy saving, longer operating time, and being affordable, it is widely chosen for the applications of 4K as well as 8K screens. Apart from this, innovation in Mini-LED and Micro-LED technology has improved picture quality, further consolidating its market leadership. The widespread availability of large-screen LED screens in a multitude of applications cemented its leadership.
The oled segment is expected to grow at the fastest CAGR of a 20.38% between 2024-2032, supported by better contrast, darker blacks, and greater color accuracy than LED. Rising use in high-end 8K TVs, gaming monitors, and professional displays is boosting demand. OLED's thinness and flexibility suit it perfectly for the curved and foldable screens, opening up new applications. Moreover, increasing investments in OLED production and the dwindling cost of production are making the technology more viable, and thus it is the fastest-growing segment in the industry.
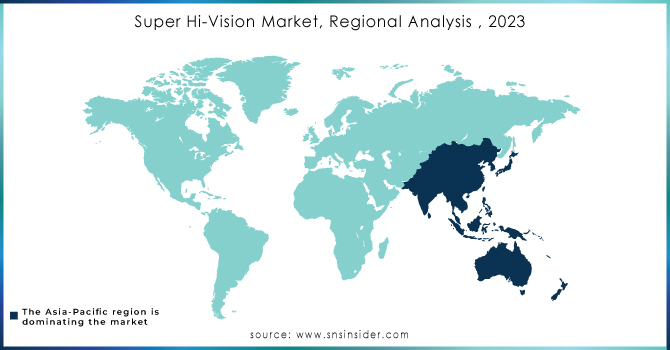
Regional Analysis
In 2023, Asia Pacific dominated the Super Hi-Vision Market with a 35% revenue share, driven by the region’s strong consumer electronics manufacturing base and rapid technological adoption. Countries like China, Japan, and South Korea are global leaders in 8K TV production, display technology, and semiconductor innovation, fueling widespread adoption. Additionally, high consumer demand for premium entertainment, government support for advanced broadcasting standards, and the presence of major industry players have solidified Asia Pacific’s leadership in the market.
North America is expected to grow at the fastest CAGR of 20.49% from 2024 to 2032, propelled by rising demand for high-resolution content, strong 5G infrastructure, and increasing investments in 8K gaming and streaming services. Leading technology companies and content creators are actively expanding 8K content production, while industries such as healthcare, advertising, and corporate AV solutions are rapidly adopting Super Hi-Vision displays. As consumer preferences shift towards ultra-high-definition experiences, North America’s market is set for accelerated expansion.
Samsung Group (QN900A Neo QLED 8K TV, Galaxy S21 Ultra 8K video recording)
LG Electronics Inc. (ZX Series 8K OLED TV, NanoCell 99 Series 8K TV)
Dell Inc. (UltraSharp UP3218K Monitor, UltraSharp UP2720Q 4K Monitor)
Red Digital Cinema Camera Company (RANGER 8K Camera, KOMODO 6K Camera)
Sharp Corporation(AQUOS 8K TV, 8M-B80AX1E 8K Monitor)
JVC (DLA-NX9 8K Projector, GY-HC500 4K Camcorder)
BOE Japan Co. Ltd. (8K UHD Display Panels, 4K UHD Display Panels)
Panasonic Corporation (HZ2000 4K OLED TV, Lumix S1H 6K video recording)
Canon Inc. (EOS R5 8K video recording, EOS C300 Mark III 4K video recording)
Ikegami Tsushinki (SHK-810 8K Camera, UHK-430 4K Camera)
Apple (Pro Display XDR 6K, iPhone 12 Pro 4K Dolby Vision HDR recording)
Sony Corporation (Z9J MASTER Series 8K TV, Alpha 1 8K video recording)
Haier Group Corporation (LE65Q6500U 4K TV, LE75U6600U 4K TV)
Netflix Inc. ("Our Planet" 4K streaming, "The Crown" 4K streaming)
Koninklijke Philips N.V. (65OLED984 4K TV, 558M1RY 4K Monitor)
Seiko Epson Corporation (EH-LS500B 4K Projector, EH-TW9400 4K Projector)
TCL Electronics Holdings Limited (8-Series 4K QLED TV, 6-Series 4K QLED TV)
Skyworth Group Co. Ltd. (Q91 8K TV, S81 Pro 4K OLED TV)
AU Optronics Corporation (8K UHD Display Panels, 4K UHD Display Panels)
Innolux Corporation (8K UHD Display Panels, 4K UHD Display Panels)
Hisense Group Co. Ltd. (U9E 8K TV, H9G 4K TV)
British Broadcasting Corporation (BBC) ("Blue Planet II" 4K broadcast, "Dynasties" 4K broadcast)
Nikon Corporation (Z9 8K video recording, Z6 II 4K video recording)
Konka Group Co. Ltd. (828 Series 8K TV, 668 Series 4K TV)
Japan Broadcasting Corporation (NHK) (8K Broadcasting Service, 4K Broadcasting Service)
2025 – At CES 2025, Samsung introduced Samsung Vision AI, bringing AI-powered personalization to its latest Neo QLED, OLED, and The Frame models. The innovation aims to enhance everyday experiences by integrating advanced AI capabilities into display technology.
2024 – LG introduced its 2025 QNED evo lineup, incorporating true wireless 4K 144Hz transmission, AI-enhanced picture and sound processing, and hyper-personalized experiences through webOS 25. The new lineup enhances display performance with wider color gamut technology and improved AI-driven user interactions.
| Report Attributes | Details |
| Market Size in 2023 | USD 920 Million |
| Market Size by 2032 | USD 4320 Million |
| CAGR | CAGR of 18.89% From 2024 to 2032 |
| Base Year | 2023 |
| Forecast Period | 2024-2032 |
| Historical Data | 2020-2022 |
| Report Scope & Coverage | Market Size, Segments Analysis, Competitive Landscape, Regional Analysis, DROC & SWOT Analysis, Forecast Outlook |
| Key Segments | • By Type (4K, 8K) • By Application (Consumer Electronics, Commercial Electronics, Medical Science, Others) • By Technology (LED, OLED, LCD) |
| Regional Analysis/Coverage | North America (US, Canada, Mexico), Europe (Eastern Europe [Poland, Romania, Hungary, Turkey, Rest of Eastern Europe] Western Europe] Germany, France, UK, Italy, Spain, Netherlands, Switzerland, Austria, Rest of Western Europe]), Asia Pacific (China, India, Japan, South Korea, Vietnam, Singapore, Australia, Rest of Asia Pacific), Middle East & Africa (Middle East [UAE, Egypt, Saudi Arabia, Qatar, Rest of Middle East], Africa [Nigeria, South Africa, Rest of Africa], Latin America (Brazil, Argentina, Colombia, Rest of Latin America) |
| Company Profiles | Samsung Group, LG Electronics Inc., Dell Inc., Red Digital Cinema Camera Company, Sharp Corporation, JVC, BOE Japan Co. Ltd., Panasonic Corporation, Canon Inc., Ikegami Tsushinki Co. Ltd., Apple, Sony Corporation, Haier Group Corporation, Netflix Inc., Koninklijke Philips N.V., Seiko Epson Corporation, TCL Electronics Holdings Limited, Skyworth Group Co. Ltd., AU Optronics Corporation, Innolux Corporation, Hisense Group Co. Ltd., British Broadcasting Corporation (BBC), Nikon Corporation, Konka Group Co. Ltd., Japan Broadcasting Corporation (NHK) |
ANS: Super Hi-Vision Market was valued at USD 920 Million in 2023 and is expected to reach USD 4320 Million by 2032, growing at a CAGR of 18.89% from 2024-2032.
ANS: The 4K segment due to its widespread adoption in televisions, gaming, and streaming.
ANS: Consumer electronics, driven by 4K and 8K TVs, gaming consoles, and high-resolution streaming.
ANS: LED due to its cost-effectiveness, high brightness, and energy efficiency.
ANS: North America, with a projected CAGR of 20.49% from 2024 to 2032.
TABLE OF CONTENTS
1. Introduction
1.1 Market Definition
1.2 Scope (Inclusion and Exclusions)
1.3 Research Assumptions
2. Executive Summary
2.1 Market Overview
2.2 Regional Synopsis
2.3 Competitive Summary
3. Research Methodology
3.1 Top-Down Approach
3.2 Bottom-up Approach
3.3. Data Validation
3.4 Primary Interviews
4. Market Dynamics Impact Analysis
4.1 Market Driving Factors Analysis
4.1.1 Drivers
4.1.2 Restraints
4.1.3 Opportunities
4.1.4 Challenges
4.2 PESTLE Analysis
4.3 Porter’s Five Forces Model
5. Statistical Insights and Trends Reporting
5.1 Adoption Rate
5.2 Consumer Demand Trends
5.3 Investment & R&D Spending
5.4 Display Panel Production Capacity
5.5 Regulatory & Standardization Data
6. Competitive Landscape
6.1 List of Major Companies, By Region
6.2 Market Share Analysis, By Region
6.3 Product Benchmarking
6.3.1 Product specifications and features
6.3.2 Pricing
6.4 Strategic Initiatives
6.4.1 Marketing and promotional activities
6.4.2 Distribution and supply chain strategies
6.4.3 Expansion plans and new product launches
6.4.4 Strategic partnerships and collaborations
6.5 Technological Advancements
6.6 Market Positioning and Branding
7. Super Hi-Vision Market Segmentation, By Type
7.1 Chapter Overview
7.2 4K
7.2.1 4K Market Trends Analysis (2020-2032)
7.2.2 4K Market Size Estimates and Forecasts to 2032 (USD Million)
7.3 8K
7.3.1 8K Market Trends Analysis (2020-2032)
7.3.2 8K Market Size Estimates and Forecasts to 2032 (USD Million)
8. Super Hi-Vision Market Segmentation, By Applications
8.1 Chapter Overview
8.2 Consumer Electronics
8.2.1 Consumer Electronics Market Trends Analysis (2020-2032)
8.2.2 Consumer Electronics Market Size Estimates and Forecasts to 2032 (USD Million)
8.3 Commercial Electronics
8.3.1 Commercial Electronics Market Trends Analysis (2020-2032)
8.3.2 Commercial Electronics Market Size Estimates and Forecasts to 2032 (USD Million)
8.4 Medical Science
8.4.1 Medical Science Market Trends Analysis (2020-2032)
8.4.2 Medical Science Market Size Estimates and Forecasts to 2032 (USD Million)
8.5 Others
8.5.1 Others Market Trends Analysis (2020-2032)
8.5.2 Others Market Size Estimates and Forecasts to 2032 (USD Million)
9. Super Hi-Vision Market Segmentation, By Technology
9.1 Chapter Overview
9.2 LED
9.2.1 LED Market Trends Analysis (2020-2032)
9.2.2 LED Market Size Estimates and Forecasts to 2032 (USD Million)
9.3 OLED
9.3.1 OLED Market Trends Analysis (2020-2032)
9.3.2 OLED Market Size Estimates and Forecasts to 2032 (USD Million)
9.4 LCD
9.4.1 LCD Market Trends Analysis (2020-2032)
9.4.2 LCD Market Size Estimates and Forecasts to 2032 (USD Million)
10. Regional Analysis
10.1 Chapter Overview
10.2 North America
10.2.1 Trends Analysis
10.2.2 North America Super Hi-Vision Market Estimates and Forecasts, by Country (2020-2032) (USD Million)
10.2.3 North America Super Hi-Vision Market Estimates and Forecasts, By Type (2020-2032) (USD Million)
10.2.4 North America Super Hi-Vision Market Estimates and Forecasts, By Applications (2020-2032) (USD Million)
10.2.5 North America Super Hi-Vision Market Estimates and Forecasts, By Technology (2020-2032) (USD Million)
10.2.6 USA
10.2.6.1 USA Super Hi-Vision Market Estimates and Forecasts, By Type (2020-2032) (USD Million)
10.2.6.2 USA Super Hi-Vision Market Estimates and Forecasts, By Applications (2020-2032) (USD Million)
10.2.6.3 USA Super Hi-Vision Market Estimates and Forecasts, By Technology (2020-2032) (USD Million)
10.2.7 Canada
10.2.7.1 Canada Super Hi-Vision Market Estimates and Forecasts, By Type (2020-2032) (USD Million)
10.2.7.2 Canada Super Hi-Vision Market Estimates and Forecasts, By Applications (2020-2032) (USD Million)
10.2.7.3 Canada Super Hi-Vision Market Estimates and Forecasts, By Technology (2020-2032) (USD Million)
10.2.8 Mexico
10.2.8.1 Mexico Super Hi-Vision Market Estimates and Forecasts, By Type (2020-2032) (USD Million)
10.2.8.2 Mexico Super Hi-Vision Market Estimates and Forecasts, By Applications (2020-2032) (USD Million)
10.2.8.3 Mexico Super Hi-Vision Market Estimates and Forecasts, By Technology (2020-2032) (USD Million)
10.3 Europe
10.3.1 Eastern Europe
10.3.1.1 Trends Analysis
10.3.1.2 Eastern Europe Super Hi-Vision Market Estimates and Forecasts, by Country (2020-2032) (USD Million)
10.3.1.3 Eastern Europe Super Hi-Vision Market Estimates and Forecasts, By Type (2020-2032) (USD Million)
10.3.1.4 Eastern Europe Super Hi-Vision Market Estimates and Forecasts, By Applications (2020-2032) (USD Million)
10.3.1.5 Eastern Europe Super Hi-Vision Market Estimates and Forecasts, By Technology (2020-2032) (USD Million)
10.3.1.6 Poland
10.3.1.6.1 Poland Super Hi-Vision Market Estimates and Forecasts, By Type (2020-2032) (USD Million)
10.3.1.6.2 Poland Super Hi-Vision Market Estimates and Forecasts, By Applications (2020-2032) (USD Million)
10.3.1.6.3 Poland Super Hi-Vision Market Estimates and Forecasts, By Technology (2020-2032) (USD Million)
10.3.1.7 Romania
10.3.1.7.1 Romania Super Hi-Vision Market Estimates and Forecasts, By Type (2020-2032) (USD Million)
10.3.1.7.2 Romania Super Hi-Vision Market Estimates and Forecasts, By Applications (2020-2032) (USD Million)
10.3.1.7.3 Romania Super Hi-Vision Market Estimates and Forecasts, By Technology (2020-2032) (USD Million)
10.3.1.8 Hungary
10.3.1.8.1 Hungary Super Hi-Vision Market Estimates and Forecasts, By Type (2020-2032) (USD Million)
10.3.1.8.2 Hungary Super Hi-Vision Market Estimates and Forecasts, By Applications (2020-2032) (USD Million)
10.3.1.8.3 Hungary Super Hi-Vision Market Estimates and Forecasts, By Technology (2020-2032) (USD Million)
10.3.1.9 Turkey
10.3.1.9.1 Turkey Super Hi-Vision Market Estimates and Forecasts, By Type (2020-2032) (USD Million)
10.3.1.9.2 Turkey Super Hi-Vision Market Estimates and Forecasts, By Applications (2020-2032) (USD Million)
10.3.1.9.3 Turkey Super Hi-Vision Market Estimates and Forecasts, By Technology (2020-2032) (USD Million)
10.3.1.10 Rest of Eastern Europe
10.3.1.10.1 Rest of Eastern Europe Super Hi-Vision Market Estimates and Forecasts, By Type (2020-2032) (USD Million)
10.3.1.10.2 Rest of Eastern Europe Super Hi-Vision Market Estimates and Forecasts, By Applications (2020-2032) (USD Million)
10.3.1.10.3 Rest of Eastern Europe Super Hi-Vision Market Estimates and Forecasts, By Technology (2020-2032) (USD Million)
10.3.2 Western Europe
10.3.2.1 Trends Analysis
10.3.2.2 Western Europe Super Hi-Vision Market Estimates and Forecasts, by Country (2020-2032) (USD Million)
10.3.2.3 Western Europe Super Hi-Vision Market Estimates and Forecasts, By Type (2020-2032) (USD Million)
10.3.2.4 Western Europe Super Hi-Vision Market Estimates and Forecasts, By Applications (2020-2032) (USD Million)
10.3.2.5 Western Europe Super Hi-Vision Market Estimates and Forecasts, By Technology (2020-2032) (USD Million)
10.3.2.6 Germany
10.3.2.6.1 Germany Super Hi-Vision Market Estimates and Forecasts, By Type (2020-2032) (USD Million)
10.3.2.6.2 Germany Super Hi-Vision Market Estimates and Forecasts, By Applications (2020-2032) (USD Million)
10.3.2.6.3 Germany Super Hi-Vision Market Estimates and Forecasts, By Technology (2020-2032) (USD Million)
10.3.2.7 France
10.3.2.7.1 France Super Hi-Vision Market Estimates and Forecasts, By Type (2020-2032) (USD Million)
10.3.2.7.2 France Super Hi-Vision Market Estimates and Forecasts, By Applications (2020-2032) (USD Million)
10.3.2.7.3 France Super Hi-Vision Market Estimates and Forecasts, By Technology (2020-2032) (USD Million)
10.3.2.8 UK
10.3.2.8.1 UK Super Hi-Vision Market Estimates and Forecasts, By Type (2020-2032) (USD Million)
10.3.2.8.2 UK Super Hi-Vision Market Estimates and Forecasts, By Applications (2020-2032) (USD Million)
10.3.2.8.3 UK Super Hi-Vision Market Estimates and Forecasts, By Technology (2020-2032) (USD Million)
10.3.2.9 Italy
10.3.2.9.1 Italy Super Hi-Vision Market Estimates and Forecasts, By Type (2020-2032) (USD Million)
10.3.2.9.2 Italy Super Hi-Vision Market Estimates and Forecasts, By Applications (2020-2032) (USD Million)
10.3.2.9.3 Italy Super Hi-Vision Market Estimates and Forecasts, By Technology (2020-2032) (USD Million)
10.3.2.10 Spain
10.3.2.10.1 Spain Super Hi-Vision Market Estimates and Forecasts, By Type (2020-2032) (USD Million)
10.3.2.10.2 Spain Super Hi-Vision Market Estimates and Forecasts, By Applications (2020-2032) (USD Million)
10.3.2.10.3 Spain Super Hi-Vision Market Estimates and Forecasts, By Technology (2020-2032) (USD Million)
10.3.2.11 Netherlands
10.3.2.11.1 Netherlands Super Hi-Vision Market Estimates and Forecasts, By Type (2020-2032) (USD Million)
10.3.2.11.2 Netherlands Super Hi-Vision Market Estimates and Forecasts, By Applications (2020-2032) (USD Million)
10.3.2.11.3 Netherlands Super Hi-Vision Market Estimates and Forecasts, By Technology (2020-2032) (USD Million)
10.3.2.12 Switzerland
10.3.2.12.1 Switzerland Super Hi-Vision Market Estimates and Forecasts, By Type (2020-2032) (USD Million)
10.3.2.12.2 Switzerland Super Hi-Vision Market Estimates and Forecasts, By Applications (2020-2032) (USD Million)
10.3.2.12.3 Switzerland Super Hi-Vision Market Estimates and Forecasts, By Technology (2020-2032) (USD Million)
10.3.2.13 Austria
10.3.2.13.1 Austria Super Hi-Vision Market Estimates and Forecasts, By Type (2020-2032) (USD Million)
10.3.2.13.2 Austria Super Hi-Vision Market Estimates and Forecasts, By Applications (2020-2032) (USD Million)
10.3.2.13.3 Austria Super Hi-Vision Market Estimates and Forecasts, By Technology (2020-2032) (USD Million)
10.3.2.14 Rest of Western Europe
10.3.2.14.1 Rest of Western Europe Super Hi-Vision Market Estimates and Forecasts, By Type (2020-2032) (USD Million)
10.3.2.14.2 Rest of Western Europe Super Hi-Vision Market Estimates and Forecasts, By Applications (2020-2032) (USD Million)
10.3.2.14.3 Rest of Western Europe Super Hi-Vision Market Estimates and Forecasts, By Technology (2020-2032) (USD Million)
10.4 Asia Pacific
10.4.1 Trends Analysis
10.4.2 Asia Pacific Super Hi-Vision Market Estimates and Forecasts, by Country (2020-2032) (USD Million)
10.4.3 Asia Pacific Super Hi-Vision Market Estimates and Forecasts, By Type (2020-2032) (USD Million)
10.4.4 Asia Pacific Super Hi-Vision Market Estimates and Forecasts, By Applications (2020-2032) (USD Million)
10.4.5 Asia Pacific Super Hi-Vision Market Estimates and Forecasts, By Technology (2020-2032) (USD Million)
10.4.6 China
10.4.6.1 China Super Hi-Vision Market Estimates and Forecasts, By Type (2020-2032) (USD Million)
10.4.6.2 China Super Hi-Vision Market Estimates and Forecasts, By Applications (2020-2032) (USD Million)
10.4.6.3 China Super Hi-Vision Market Estimates and Forecasts, By Technology (2020-2032) (USD Million)
10.4.7 India
10.4.7.1 India Super Hi-Vision Market Estimates and Forecasts, By Type (2020-2032) (USD Million)
10.4.7.2 India Super Hi-Vision Market Estimates and Forecasts, By Applications (2020-2032) (USD Million)
10.4.7.3 India Super Hi-Vision Market Estimates and Forecasts, By Technology (2020-2032) (USD Million)
10.4.8 Japan
10.4.8.1 Japan Super Hi-Vision Market Estimates and Forecasts, By Type (2020-2032) (USD Million)
10.4.8.2 Japan Super Hi-Vision Market Estimates and Forecasts, By Applications (2020-2032) (USD Million)
10.4.8.3 Japan Super Hi-Vision Market Estimates and Forecasts, By Technology (2020-2032) (USD Million)
10.4.9 South Korea
10.4.9.1 South Korea Super Hi-Vision Market Estimates and Forecasts, By Type (2020-2032) (USD Million)
10.4.9.2 South Korea Super Hi-Vision Market Estimates and Forecasts, By Applications (2020-2032) (USD Million)
10.4.9.3 South Korea Super Hi-Vision Market Estimates and Forecasts, By Technology (2020-2032) (USD Million)
10.4.10 Vietnam
10.4.10.1 Vietnam Super Hi-Vision Market Estimates and Forecasts, By Type (2020-2032) (USD Million)
10.4.10.2 Vietnam Super Hi-Vision Market Estimates and Forecasts, By Applications (2020-2032) (USD Million)
10.4.10.3 Vietnam Super Hi-Vision Market Estimates and Forecasts, By Technology (2020-2032) (USD Million)
10.4.11 Singapore
10.4.11.1 Singapore Super Hi-Vision Market Estimates and Forecasts, By Type (2020-2032) (USD Million)
10.4.11.2 Singapore Super Hi-Vision Market Estimates and Forecasts, By Applications (2020-2032) (USD Million)
10.4.11.3 Singapore Super Hi-Vision Market Estimates and Forecasts, By Technology (2020-2032) (USD Million)
10.4.12 Australia
10.4.12.1 Australia Super Hi-Vision Market Estimates and Forecasts, By Type (2020-2032) (USD Million)
10.4.12.2 Australia Super Hi-Vision Market Estimates and Forecasts, By Applications (2020-2032) (USD Million)
10.4.12.3 Australia Super Hi-Vision Market Estimates and Forecasts, By Technology (2020-2032) (USD Million)
10.4.13 Rest of Asia Pacific
10.4.13.1 Rest of Asia Pacific Super Hi-Vision Market Estimates and Forecasts, By Type (2020-2032) (USD Million)
10.4.13.2 Rest of Asia Pacific Super Hi-Vision Market Estimates and Forecasts, By Applications (2020-2032) (USD Million)
10.4.13.3 Rest of Asia Pacific Super Hi-Vision Market Estimates and Forecasts, By Technology (2020-2032) (USD Million)
10.5 Middle East and Africa
10.5.1 Middle East
10.5.1.1 Trends Analysis
10.5.1.2 Middle East Super Hi-Vision Market Estimates and Forecasts, by Country (2020-2032) (USD Million)
10.5.1.3 Middle East Super Hi-Vision Market Estimates and Forecasts, By Type (2020-2032) (USD Million)
10.5.1.4 Middle East Super Hi-Vision Market Estimates and Forecasts, By Applications (2020-2032) (USD Million)
10.5.1.5 Middle East Super Hi-Vision Market Estimates and Forecasts, By Technology (2020-2032) (USD Million)
10.5.1.6 UAE
10.5.1.6.1 UAE Super Hi-Vision Market Estimates and Forecasts, By Type (2020-2032) (USD Million)
10.5.1.6.2 UAE Super Hi-Vision Market Estimates and Forecasts, By Applications (2020-2032) (USD Million)
10.5.1.6.3 UAE Super Hi-Vision Market Estimates and Forecasts, By Technology (2020-2032) (USD Million)
10.5.1.7 Egypt
10.5.1.7.1 Egypt Super Hi-Vision Market Estimates and Forecasts, By Type (2020-2032) (USD Million)
10.5.1.7.2 Egypt Super Hi-Vision Market Estimates and Forecasts, By Applications (2020-2032) (USD Million)
10.5.1.7.3 Egypt Super Hi-Vision Market Estimates and Forecasts, By Technology (2020-2032) (USD Million)
10.5.1.8 Saudi Arabia
10.5.1.8.1 Saudi Arabia Super Hi-Vision Market Estimates and Forecasts, By Type (2020-2032) (USD Million)
10.5.1.8.2 Saudi Arabia Super Hi-Vision Market Estimates and Forecasts, By Applications (2020-2032) (USD Million)
10.5.1.8.3 Saudi Arabia Super Hi-Vision Market Estimates and Forecasts, By Technology (2020-2032) (USD Million)
10.5.1.9 Qatar
10.5.1.9.1 Qatar Super Hi-Vision Market Estimates and Forecasts, By Type (2020-2032) (USD Million)
10.5.1.9.2 Qatar Super Hi-Vision Market Estimates and Forecasts, By Applications (2020-2032) (USD Million)
10.5.1.9.3 Qatar Super Hi-Vision Market Estimates and Forecasts, By Technology (2020-2032) (USD Million)
10.5.1.10 Rest of Middle East
10.5.1.10.1 Rest of Middle East Super Hi-Vision Market Estimates and Forecasts, By Type (2020-2032) (USD Million)
10.5.1.10.2 Rest of Middle East Super Hi-Vision Market Estimates and Forecasts, By Applications (2020-2032) (USD Million)
10.5.1.10.3 Rest of Middle East Super Hi-Vision Market Estimates and Forecasts, By Technology (2020-2032) (USD Million)
10.5.2 Africa
10.5.2.1 Trends Analysis
10.5.2.2 Africa Super Hi-Vision Market Estimates and Forecasts, by Country (2020-2032) (USD Million)
10.5.2.3 Africa Super Hi-Vision Market Estimates and Forecasts, By Type (2020-2032) (USD Million)
10.5.2.4 Africa Super Hi-Vision Market Estimates and Forecasts, By Applications (2020-2032) (USD Million)
10.5.2.5 Africa Super Hi-Vision Market Estimates and Forecasts, By Technology (2020-2032) (USD Million)
10.5.2.6 South Africa
10.5.2.6.1 South Africa Super Hi-Vision Market Estimates and Forecasts, By Type (2020-2032) (USD Million)
10.5.2.6.2 South Africa Super Hi-Vision Market Estimates and Forecasts, By Applications (2020-2032) (USD Million)
10.5.2.6.3 South Africa Super Hi-Vision Market Estimates and Forecasts, By Technology (2020-2032) (USD Million)
10.5.2.7 Nigeria
10.5.2.7.1 Nigeria Super Hi-Vision Market Estimates and Forecasts, By Type (2020-2032) (USD Million)
10.5.2.7.2 Nigeria Super Hi-Vision Market Estimates and Forecasts, By Applications (2020-2032) (USD Million)
10.5.2.7.3 Nigeria Super Hi-Vision Market Estimates and Forecasts, By Technology (2020-2032) (USD Million)
10.5.2.8 Rest of Africa
10.5.2.8.1 Rest of Africa Super Hi-Vision Market Estimates and Forecasts, By Type (2020-2032) (USD Million)
10.5.2.8.2 Rest of Africa Super Hi-Vision Market Estimates and Forecasts, By Applications (2020-2032) (USD Million)
10.5.2.8.3 Rest of Africa Super Hi-Vision Market Estimates and Forecasts, By Technology (2020-2032) (USD Million)
10.6 Latin America
10.6.1 Trends Analysis
10.6.2 Latin America Super Hi-Vision Market Estimates and Forecasts, by Country (2020-2032) (USD Million)
10.6.3 Latin America Super Hi-Vision Market Estimates and Forecasts, By Type (2020-2032) (USD Million)
10.6.4 Latin America Super Hi-Vision Market Estimates and Forecasts, By Applications (2020-2032) (USD Million)
10.6.5 Latin America Super Hi-Vision Market Estimates and Forecasts, By Technology (2020-2032) (USD Million)
10.6.6 Brazil
10.6.6.1 Brazil Super Hi-Vision Market Estimates and Forecasts, By Type (2020-2032) (USD Million)
10.6.6.2 Brazil Super Hi-Vision Market Estimates and Forecasts, By Applications (2020-2032) (USD Million)
10.6.6.3 Brazil Super Hi-Vision Market Estimates and Forecasts, By Technology (2020-2032) (USD Million)
10.6.7 Argentina
10.6.7.1 Argentina Super Hi-Vision Market Estimates and Forecasts, By Type (2020-2032) (USD Million)
10.6.7.2 Argentina Super Hi-Vision Market Estimates and Forecasts, By Applications (2020-2032) (USD Million)
10.6.7.3 Argentina Super Hi-Vision Market Estimates and Forecasts, By Technology (2020-2032) (USD Million)
10.6.8 Colombia
10.6.8.1 Colombia Super Hi-Vision Market Estimates and Forecasts, By Type (2020-2032) (USD Million)
10.6.8.2 Colombia Super Hi-Vision Market Estimates and Forecasts, By Applications (2020-2032) (USD Million)
10.6.8.3 Colombia Super Hi-Vision Market Estimates and Forecasts, By Technology (2020-2032) (USD Million)
10.6.9 Rest of Latin America
10.6.9.1 Rest of Latin America Super Hi-Vision Market Estimates and Forecasts, By Type (2020-2032) (USD Million)
10.6.9.2 Rest of Latin America Super Hi-Vision Market Estimates and Forecasts, By Applications (2020-2032) (USD Million)
10.6.9.3 Rest of Latin America Super Hi-Vision Market Estimates and Forecasts, By Technology (2020-2032) (USD Million)
11. Company Profiles
11.1 Samsung Group
11.1.1 Company Overview
11.1.2 Financial
11.1.3 Products/ Services Offered
11.1.4 SWOT Analysis
11.2 LG Electronics Inc.
11.2.1 Company Overview
11.2.2 Financial
11.2.3 Products/ Services Offered
11.2.4 SWOT Analysis
11.3 Dell Inc.
11.3.1 Company Overview
11.3.2 Financial
11.3.3 Products/ Services Offered
11.3.4 SWOT Analysis
11.4 Red Digital Cinema Camera Company
11.4.1 Company Overview
11.4.2 Financial
11.4.3 Products/ Services Offered
11.4.4 SWOT Analysis
11.5 Sharp Corporation
11.5.1 Company Overview
11.5.2 Financial
11.5.3 Products/ Services Offered
11.5.4 SWOT Analysis
11.6 JVC
11.6.1 Company Overview
11.6.2 Financial
11.6.3 Products/ Services Offered
11.6.4 SWOT Analysis
11.7 BOE Japan Co. Ltd.
11.7.1 Company Overview
11.7.2 Financial
11.7.3 Products/ Services Offered
11.7.4 SWOT Analysis
11.8 Panasonic Corporation
11.8.1 Company Overview
11.8.2 Financial
11.8.3 Products/ Services Offered
11.8.4 SWOT Analysis
11.9 Canon Inc.
11.9.1 Company Overview
11.9.2 Financial
11.9.3 Products/ Services Offered
11.9.4 SWOT Analysis
11.10 Ikegami Tsushinki Co. Ltd.
11.10.1 Company Overview
11.10.2 Financial
11.10.3 Products/ Services Offered
11.10.4 SWOT Analysis
12. Use Cases and Best Practices
13. Conclusion
An accurate research report requires proper strategizing as well as implementation. There are multiple factors involved in the completion of good and accurate research report and selecting the best methodology to compete the research is the toughest part. Since the research reports we provide play a crucial role in any company’s decision-making process, therefore we at SNS Insider always believe that we should choose the best method which gives us results closer to reality. This allows us to reach at a stage wherein we can provide our clients best and accurate investment to output ratio.
Each report that we prepare takes a timeframe of 350-400 business hours for production. Starting from the selection of titles through a couple of in-depth brain storming session to the final QC process before uploading our titles on our website we dedicate around 350 working hours. The titles are selected based on their current market cap and the foreseen CAGR and growth.
The 5 steps process:
Step 1: Secondary Research:
Secondary Research or Desk Research is as the name suggests is a research process wherein, we collect data through the readily available information. In this process we use various paid and unpaid databases which our team has access to and gather data through the same. This includes examining of listed companies’ annual reports, Journals, SEC filling etc. Apart from this our team has access to various associations across the globe across different industries. Lastly, we have exchange relationships with various university as well as individual libraries.

Step 2: Primary Research
When we talk about primary research, it is a type of study in which the researchers collect relevant data samples directly, rather than relying on previously collected data. This type of research is focused on gaining content specific facts that can be sued to solve specific problems. Since the collected data is fresh and first hand therefore it makes the study more accurate and genuine.
We at SNS Insider have divided Primary Research into 2 parts.
Part 1 wherein we interview the KOLs of major players as well as the upcoming ones across various geographic regions. This allows us to have their view over the market scenario and acts as an important tool to come closer to the accurate market numbers. As many as 45 paid and unpaid primary interviews are taken from both the demand and supply side of the industry to make sure we land at an accurate judgement and analysis of the market.
This step involves the triangulation of data wherein our team analyses the interview transcripts, online survey responses and observation of on filed participants. The below mentioned chart should give a better understanding of the part 1 of the primary interview.

Part 2: In this part of primary research the data collected via secondary research and the part 1 of the primary research is validated with the interviews from individual consultants and subject matter experts.
Consultants are those set of people who have at least 12 years of experience and expertise within the industry whereas Subject Matter Experts are those with at least 15 years of experience behind their back within the same space. The data with the help of two main processes i.e., FGDs (Focused Group Discussions) and IDs (Individual Discussions). This gives us a 3rd party nonbiased primary view of the market scenario making it a more dependable one while collation of the data pointers.
Step 3: Data Bank Validation
Once all the information is collected via primary and secondary sources, we run that information for data validation. At our intelligence centre our research heads track a lot of information related to the market which includes the quarterly reports, the daily stock prices, and other relevant information. Our data bank server gets updated every fortnight and that is how the information which we collected using our primary and secondary information is revalidated in real time.

Step 4: QA/QC Process
After all the data collection and validation our team does a final level of quality check and quality assurance to get rid of any unwanted or undesired mistakes. This might include but not limited to getting rid of the any typos, duplication of numbers or missing of any important information. The people involved in this process include technical content writers, research heads and graphics people. Once this process is completed the title gets uploader on our platform for our clients to read it.
Step 5: Final QC/QA Process:
This is the last process and comes when the client has ordered the study. In this process a final QA/QC is done before the study is emailed to the client. Since we believe in giving our clients a good experience of our research studies, therefore, to make sure that we do not lack at our end in any way humanly possible we do a final round of quality check and then dispatch the study to the client.
Key Segments:
By Type
4K
8K
By Applications
Consumer Electronics
Commercial Electronics
Medical Science
Others
By Technology
LED
OLED
LCD
Request for Segment Customization as per your Business Requirement: Segment Customization Request
Regional Coverage:
North America
US
Canada
Mexico
Europe
Eastern Europe
Poland
Romania
Hungary
Turkey
Rest of Eastern Europe
Western Europe
Germany
France
UK
Italy
Spain
Netherlands
Switzerland
Austria
Rest of Western Europe
Asia Pacific
China
India
Japan
South Korea
Vietnam
Singapore
Australia
Rest of Asia Pacific
Middle East & Africa
Middle East
UAE
Egypt
Saudi Arabia
Qatar
Rest of Middle East
Africa
Nigeria
South Africa
Rest of Africa
Latin America
Brazil
Argentina
Colombia
Rest of Latin America
Request for Country Level Research Report: Country Level Customization Request
Available Customization
With the given market data, SNS Insider offers customization as per the company’s specific needs. The following customization options are available for the report:
Detailed Volume Analysis
Criss-Cross segment analysis (e.g. Product X Application)
Competitive Product Benchmarking
Geographic Analysis
Additional countries in any of the regions
Customized Data Representation
Detailed analysis and profiling of additional market players
The OLED Display Market Size was valued at USD 44.07 Billion in 2023 and is expected to grow at a CAGR of 13.7% to reach USD 138.85 Billion by 2032.
The Power Over Ethernet (PoE) Chipset Market size was valued at USD 674.60 million in 2023 and is expected to grow at a CAGR of 11.35% From 2024-2032.
The Enterprise Manufacturing Intelligence Market Size was valued at USD 5.18 Billion in 2023 and is expected to grow to USD 16.11 Billion by 2032 and grow at a CAGR of 13.44% over the forecast period of 2024-2032
The Microprocessor Market Size was valued at USD 62.67 Billion in 2023 and is expected to grow at a CAGR of 8.20% to reach USD 126.91 Billion by 2032.
The Connected Hardhats Market size was valued at USD 103.8 Million in 2023 and expected to grow at a CAGR of 15.73% to reach USD 386.49 Million by 2032.
The Pressure Sensor Market Size was valued at USD 19.7 billion in 2023 and is expected to reach USD 28.52 billion by 2032 and grow at a CAGR of 4.2% over the forecast period 2024-2032.

Hi! Click one of our member below to chat on Phone
© 2025 All Rights Reserved by SNS Insider Pvt Ltd


