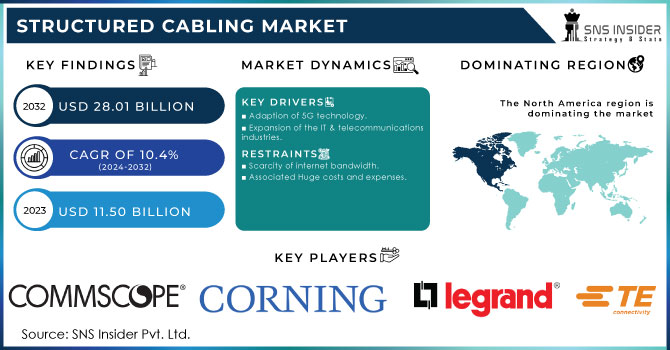
The Structured Cabling Market Size was valued at USD 12.26 Billion in 2023 and is expected to reach USD 28.90 Billion by 2032 and grow at a CAGR of 10.0% over the forecast period 2024-2032. The Market includes key metrics such as market segmentation by component (cables, connectivity hardware, services) to identify dominant segments. Installation and maintenance cost trends provide financial insights, while adoption rates across industries like IT & telecom, data centers, and healthcare highlight sector demand. Bandwidth growth trends driven by cloud adoption, enterprise spending patterns, and the impact of 5G, IoT, and AI further shape market dynamics. Fiber optic vs. copper cable usage ratios reflect industry shifts, while sustainability trends like eco-friendly, halogen-free cables showcase environmental considerations, offering a holistic view of market evolution.
Get more information on Structured Cabling Market - Request Sample Report
Key Drivers:
Increasing Data Traffic and Connectivity Needs to Drive the Expansion of Structured Cabling Solutions in the IT and Telecom Sectors
The demand for higher bandwidth and faster data transfer speeds, driven by the growing adoption of digital technologies and cloud computing, has accelerated the need for advanced structured cabling solutions. In industries such as IT and telecommunications, increased reliance on network infrastructure and real-time data access necessitates the implementation of high-performance cabling systems. This is further fueled by the expansion of 5G networks, IoT devices, and connected technologies, requiring upgraded and reliable cabling solutions for seamless operation and efficient data flow, thus propelling the structured cabling market’s growth.
Restraint:
High Initial Installation Costs of Structured Cabling Systems impede widespread Adoption, Particularly in Developing Regions
One of the significant challenges facing the structured cabling market is the high upfront costs associated with the installation of advanced cabling systems. These initial costs, which include materials, labor, and specialized equipment, may deter small and medium-sized businesses, particularly in developing regions, from investing in upgraded cabling infrastructure. While long-term benefits such as improved network efficiency and reduced maintenance costs exist, the high initial investment can slow the adoption rate and prevent wider penetration, especially in price-sensitive markets.
Opportunity:
Integration of Fiber Optic Cables and 5G Networks Creates New Growth Opportunities in the Structured Cabling Market
The ongoing rollout of 5G networks presents a significant opportunity for growth within the structured cabling market, particularly in the area of fiber optic cables. As 5G technology promises faster data speeds and low latency, there is an increasing need for high-bandwidth, high-performance fiber optic cabling solutions to support these networks. This trend offers an excellent growth opportunity for companies that specialize in fiber optic infrastructure, as they can tap into the expanding market of 5G and other advanced wireless technologies, driving demand for modern structured cabling systems.
Challenge:
Rapid Technological Advancements Pose Challenges in Maintaining Compatibility Across Various Structured Cabling Systems
The fast-paced technological advancements in networking solutions, such as the rise of 5G, IoT, and cloud computing, have created challenges in maintaining compatibility across existing and newly installed structured cabling systems. As network technologies evolve rapidly, it becomes essential for businesses to ensure that their cabling infrastructure can support future upgrades without requiring costly replacements or reconfigurations. This challenge of ensuring seamless integration between legacy and modern cabling systems requires careful planning, expertise, and investment in adaptable solutions that can accommodate ongoing technological changes in the market.
By Type
The Copper Cables segment accounted for the largest revenue share of 48% in 2023, primarily driven by their cost-effectiveness, widespread use in legacy infrastructure, and ability to support a variety of applications, including networking, data centers, and telecommunications. Copper cables, particularly Cat 6 and Cat 6A cables, remain popular due to their relatively lower installation costs and sufficient performance for medium-range data transmission.
The Fiber Optic Cables segment is experiencing the largest CAGR of 11.44% during the forecast period, driven by the increasing need for high-speed internet, cloud services, and data-intensive applications. Companies like Corning Inc. and CommScope are actively developing and launching innovative fiber optic cabling solutions that offer enhanced data transmission capabilities, reduced latency, and greater bandwidth. With the expansion of 5G networks and the growing adoption of IoT devices, the demand for fiber optic solutions has surged, particularly for applications in data centers, telecom networks, and enterprise-level infrastructure.
By Vertical
The IT & Telecommunication segment dominated the structured cabling market with the largest revenue share of 33% in 2023. The demand for robust and reliable network infrastructure is particularly high in this vertical due to the rapid expansion of telecommunications networks and IT services worldwide. Companies like Cisco Systems Inc. and CommScope have launched advanced cabling solutions optimized for high-speed data transmission, such as high-performance fiber optic cables and networking infrastructure systems. With the increasing reliance on cloud computing, 5G technology, and IoT, the IT & telecom industry is investing heavily in upgrading its network systems, further driving the demand for structured cabling.
The Industrial segment is expected to grow at the largest CAGR of 11.69% during the forecast period, as industries increasingly adopt automation, smart manufacturing, and IoT-driven processes. With the rise of Industry 4.0, companies like Panduit and Schneider Electric are developing new structured cabling products designed to support advanced industrial applications, such as industrial Ethernet solutions and high-performance cables. The growth of industrial automation, robotics, and connected devices in factories and warehouses drives the need for more reliable, scalable, and durable cabling solutions.
By Application
The LAN segment dominated the structured cabling market in 2023, accounting for the largest share of revenue. This dominance can be attributed to the widespread use of LAN systems in commercial, industrial, and residential buildings to support network communication and data transfer. The rising trend of digital transformation and the growing dependence on cloud computing further boost the need for robust LAN systems. The growth of smart office environments and remote working solutions also drives the demand for efficient LAN solutions, which ensures seamless connectivity and high-speed communication.
The Data Center segment is projected to grow at the largest CAGR during the forecasted period, driven by the rapid expansion of cloud computing, big data analytics, and IoT. The surge in e-commerce, video streaming, and the increasing adoption of remote work further accentuates the need for scalable and high-performance cabling solutions in data centers. Structured cabling plays a critical role in maintaining efficient data transfer, minimizing downtime, and ensuring optimal network performance. As data centers evolve to meet the demands of next-generation technologies such as 5G and AI, the need for advanced and flexible cabling solutions continues to grow, making the data center segment one of the fastest-growing applications in the structured cabling market.
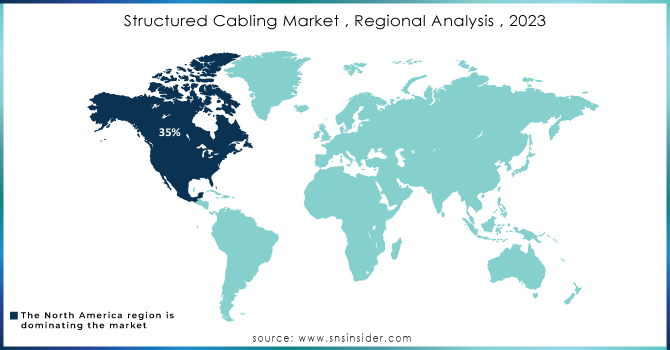
North America Region dominated the structured cabling market in 2023, holding a significant market share of approximately 34%. This dominance can be attributed to robust infrastructure investments, high demand for data centers, and advancements in communication technologies such as 5G and cloud computing. Major companies like CommScope, Belden Inc., and Cisco Systems are based in North America, and their continuous product development and innovation in high-performance cabling solutions further drive market growth in the region.
Asia Pacific is the fastest-growing region in the structured cabling market, with an estimated CAGR of 11.11% during the forecasted period. This rapid growth is driven by increasing industrialization, urbanization, and the adoption of advanced technologies like 5G, IoT, and cloud computing. Countries such as China, India, and Japan are experiencing a surge in data center development, telecommunications infrastructure, and IT network upgrades, creating a high demand for efficient structured cabling solutions.
For instance, major telecom companies in Asia are investing heavily in fiber optic cabling to support the growing need for higher bandwidth and faster data speeds. The government’s push for smart cities and industrial automation in this region is also propelling the demand for structured cabling solutions, making Asia Pacific the fastest-growing market for structured cabling systems.
Get a Customized Report as per your Business Requirement - Request For Customized Report
Some of the major players in the Structured Cabling Market are:
ABB Ltd. (Structured Cabling Solutions, Data Center Cabling Systems)
Anixter International Inc. (Network Cabling Solutions, Fiber Optic Cables)
Belden Inc. (Copper Cabling Systems, Fiber Optic Connectivity Solutions)
Legrand SA (LAN Cabling Systems, Intelligent Cable Management)
Panduit Corp (Category 6A Copper Cabling, Fiber Optic Patch Panels)
CommScope Holding Co. Inc. (SYSTIMAX Structured Cabling, FiberGuide Fiber Management)
Furukawa Electric (FITEL Fiber Optic Cables, MPO/MTP Connectivity Solutions)
Cisco Systems Inc. (Cisco Structured Cabling, Data Center Networking Solutions)
Corning Inc. (Pre-Terminated Fiber Optic Cables, EDGE Data Center Solutions)
Datwyler Holding Inc. (IT Infrastructure Cabling, High-Density Data Center Cabling)
Furukawa Electric Co. Ltd. (Optical Fiber Cables, High-Speed Data Cabling)
Hubnetix Corp. (Smart Building Cabling, High-Performance Network Cabling)
Nexans (LANmark Cabling Solutions, Fiber Optic Distribution Systems)
Schneider Electric (Actassi Structured Cabling, Data Center Cabling Solutions)
TE Connectivity (Category 6A Shielded Cables, Optical Fiber Connectivity)
In May 2024, ABB expanded its electrification portfolio by acquiring Siemens' Wiring Accessories business in China. This strategic move broadened ABB's market reach and complemented its regional offerings in smart buildings. The acquisition included wiring accessories, smart home systems, smart door locks, and other home automation products, which continued under the Siemens brand through a licensing agreement.
In March 2024, Belden Inc. launched new solutions to enhance connectivity, increase speeds, and provide more power for mission-critical environments. The releases featured Belden's I/O Plenum Stadium Cables and Access Control Cables, a LioN-X IO-Link Hub from Lumberg Automation, and enhancements to Belden’s REVConnect Connectivity System, Belden Horizon Console, and Hirschmann Industrial HiVision.
Report Attributes | Details |
---|---|
Market Size in 2023 | US$ 12.26 Billion |
Market Size by 2032 | US$ 28.90 Billion |
CAGR | CAGR of 10.0 % From 2024 to 2032 |
Base Year | 2023 |
Forecast Period | 2024-2032 |
Historical Data | 2020-2022 |
Report Scope & Coverage | Market Size, Segments Analysis, Competitive Landscape, Regional Analysis, DROC & SWOT Analysis, Forecast Outlook |
Key Segments | • By Type (Copper Cables, Fiber Optic Cables, Others) • By Application (LAN, Data Center) • By Vertical (Government, Industrial, IT & Telecommunication, Residential & Commercial, Others) |
Regional Analysis/Coverage | North America (US, Canada, Mexico), Europe (Eastern Europe [Poland, Romania, Hungary, Turkey, Rest of Eastern Europe] Western Europe] Germany, France, UK, Italy, Spain, Netherlands, Switzerland, Austria, Rest of Western Europe]), Asia Pacific (China, India, Japan, South Korea, Vietnam, Singapore, Australia, Rest of Asia Pacific), Middle East & Africa (Middle East [UAE, Egypt, Saudi Arabia, Qatar, Rest of Middle East], Africa [Nigeria, South Africa, Rest of Africa], Latin America (Brazil, Argentina, Colombia, Rest of Latin America) |
Company Profiles | ABB Ltd., Anixter International Inc., Belden Inc., Legrand SA, Panduit Corp, CommScope Holding Co. Inc., Furukawa Electric, Cisco Systems Inc., Corning Inc., Datwyler Holding Inc., Furukawa Electric Co. Ltd., Hubnetix Corp., Nexans, Schneider Electric, TE Connectivity |
Ans: The Structured Cabling Market is expected to grow at a CAGR of 10.0% during 2024-2032.
Ans: The Structured Cabling Market size was USD 12.26 billion in 2023 and is expected to Reach USD 28.90 billion by 2032.
Ans: The major growth factor of the Structured Cabling Market is the increasing demand for high-speed data transmission driven by the expansion of 5G, cloud computing, and IoT technologies.
Ans: The Copper Cables segment dominated the Structured Cabling Market.
Ans: North America dominated the Structured Cabling Market in 2023.
Table Of Contents
1. Introduction
1.1 Market Definition
1.2 Scope (Inclusion and Exclusions)
1.3 Research Assumptions
2. Executive Summary
2.1 Market Overview
2.2 Regional Synopsis
2.3 Competitive Summary
3. Research Methodology
3.1 Top-Down Approach
3.2 Bottom-up Approach
3.3. Data Validation
3.4 Primary Interviews
4. Market Dynamics Impact Analysis
4.1 Market Driving Factors Analysis
4.1.1 Drivers
4.1.2 Restraints
4.1.3 Opportunities
4.1.4 Challenges
4.2 PESTLE Analysis
4.3 Porter’s Five Forces Model
5. Statistical Insights and Trends Reporting
5.1 Deployment and Installation Growth (2023)
5.2 Investment Trends (Historic and Future)
5.3 Sustainability Initiatives (2023)
5.4 Supply Chain Metrics
6. Competitive Landscape
6.1 List of Major Companies, By Region
6.2 Market Share Analysis, By Region
6.3 Product Benchmarking
6.3.1 Product specifications and features
6.3.2 Pricing
6.4 Strategic Initiatives
6.4.1 Marketing and promotional activities
6.4.2 Distribution and Supply Chain Strategies
6.4.3 Expansion plans and new product launches
6.4.4 Strategic partnerships and collaborations
6.5 Technological Advancements
6.6 Market Positioning and Branding
7. Digital Freight Matching Market Segmentation, By Type
7.1 Chapter Overview
7.2 Copper Cables
7.2.1 Copper Cables Market Trends Analysis (2020-2032)
7.2.2 Copper Cables Market Size Estimates and Forecasts to 2032 (USD Billion)
7.3 Fiber Optic Cables
7.3.1 Fiber Optic Cables Market Trends Analysis (2020-2032)
7.3.2 Fiber Optic Cables Market Size Estimates and Forecasts to 2032 (USD Billion)
7.4 Others
7.4.1 Others Market Trends Analysis (2020-2032)
7.4.2 Others Market Size Estimates and Forecasts to 2032 (USD Billion)
8. Digital Freight Matching Market Segmentation, By Application
8.1 Chapter Overview
8.2 LAN
8.2.1 LAN Market Trends Analysis (2020-2032)
8.2.2 LAN Market Size Estimates and Forecasts to 2032 (USD Billion)
8.3 Data Center
8.3.1 Data Center Market Trends Analysis (2020-2032)
8.3.2 Data Center Market Size Estimates and Forecasts to 2032 (USD Billion)
9. Digital Freight Matching Market Segmentation, By Vertical
9.1 Chapter Overview
9.2 Government
9.2.1 Government Market Trends Analysis (2020-2032)
9.2.2 Government Market Size Estimates and Forecasts to 2032 (USD Billion)
9.3 Industrial
9.3.1 Industrial Market Trends Analysis (2020-2032)
9.3.2 Industrial Market Size Estimates and Forecasts to 2032 (USD Billion)
9.4 IT & Telecommunication
9.4.1 IT & Telecommunication Market Trends Analysis (2020-2032)
9.4.2 IT & Telecommunication Market Size Estimates and Forecasts to 2032 (USD Billion)
9.5 Residential & Commercial
9.5.1 Residential & Commercial Market Trends Analysis (2020-2032)
9.5.2 Residential & Commercial Market Size Estimates and Forecasts to 2032 (USD Billion)
9.6 Others
9.6.1 Others Market Trends Analysis (2020-2032)
9.6.2 Others Market Size Estimates and Forecasts to 2032 (USD Billion)
10. Regional Analysis
10.1 Chapter Overview
10.2 North America
10.2.1 Trends Analysis
10.2.2 North America Structured Cabling Market Estimates and Forecasts, by Country (2020-2032) (USD Billion)
10.2.3 North America Structured Cabling Market Estimates and Forecasts, By Type (2020-2032) (USD Billion)
10.2.4 North America Structured Cabling Market Estimates and Forecasts, By Application (2020-2032) (USD Billion)
10.2.5 North America Structured Cabling Market Estimates and Forecasts, By Vertical (2020-2032) (USD Billion)
10.2.6 USA
10.2.6.1 USA Structured Cabling Market Estimates and Forecasts, By Type (2020-2032) (USD Billion)
10.2.6.2 USA Structured Cabling Market Estimates and Forecasts, By Application (2020-2032) (USD Billion)
10.2.6.3 USA Structured Cabling Market Estimates and Forecasts, By Vertical (2020-2032) (USD Billion)
10.2.7 Canada
10.2.7.1 Canada Structured Cabling Market Estimates and Forecasts, By Type (2020-2032) (USD Billion)
10.2.7.2 Canada Structured Cabling Market Estimates and Forecasts, By Application (2020-2032) (USD Billion)
10.2.7.3 Canada Structured Cabling Market Estimates and Forecasts, By Vertical (2020-2032) (USD Billion)
10.2.8 Mexico
10.2.8.1 Mexico Structured Cabling Market Estimates and Forecasts, By Type (2020-2032) (USD Billion)
10.2.8.2 Mexico Structured Cabling Market Estimates and Forecasts, By Application (2020-2032) (USD Billion)
10.2.8.3 Mexico Structured Cabling Market Estimates and Forecasts, By Vertical (2020-2032) (USD Billion)
10.3 Europe
10.3.1 Eastern Europe
10.3.1.1 Trends Analysis
10.3.1.2 Eastern Europe Structured Cabling Market Estimates and Forecasts, by Country (2020-2032) (USD Billion)
10.3.1.3 Eastern Europe Structured Cabling Market Estimates and Forecasts, By Type (2020-2032) (USD Billion)
10.3.1.4 Eastern Europe Structured Cabling Market Estimates and Forecasts, By Application (2020-2032) (USD Billion)
10.3.1.5 Eastern Europe Structured Cabling Market Estimates and Forecasts, By Vertical (2020-2032) (USD Billion)
10.3.1.6 Poland
10.3.1.6.1 Poland Structured Cabling Market Estimates and Forecasts, By Type (2020-2032) (USD Billion)
10.3.1.6.2 Poland Structured Cabling Market Estimates and Forecasts, By Application (2020-2032) (USD Billion)
10.3.1.6.3 Poland Structured Cabling Market Estimates and Forecasts, By Vertical (2020-2032) (USD Billion)
10.3.1.7 Romania
10.3.1.7.1 Romania Structured Cabling Market Estimates and Forecasts, By Type (2020-2032) (USD Billion)
10.3.1.7.2 Romania Structured Cabling Market Estimates and Forecasts, By Application (2020-2032) (USD Billion)
10.3.1.7.3 Romania Structured Cabling Market Estimates and Forecasts, By Vertical (2020-2032) (USD Billion)
10.3.1.8 Hungary
10.3.1.8.1 Hungary Structured Cabling Market Estimates and Forecasts, By Type (2020-2032) (USD Billion)
10.3.1.8.2 Hungary Structured Cabling Market Estimates and Forecasts, By Application (2020-2032) (USD Billion)
10.3.1.8.3 Hungary Structured Cabling Market Estimates and Forecasts, By Vertical (2020-2032) (USD Billion)
10.3.1.9 Turkey
10.3.1.9.1 Turkey Structured Cabling Market Estimates and Forecasts, By Type (2020-2032) (USD Billion)
10.3.1.9.2 Turkey Structured Cabling Market Estimates and Forecasts, By Application (2020-2032) (USD Billion)
10.3.1.9.3 Turkey Structured Cabling Market Estimates and Forecasts, By Vertical (2020-2032) (USD Billion)
10.3.1.10 Rest of Eastern Europe
10.3.1.10.1 Rest of Eastern Europe Structured Cabling Market Estimates and Forecasts, By Type (2020-2032) (USD Billion)
10.3.1.10.2 Rest of Eastern Europe Structured Cabling Market Estimates and Forecasts, By Application (2020-2032) (USD Billion)
10.3.1.10.3 Rest of Eastern Europe Structured Cabling Market Estimates and Forecasts, By Vertical (2020-2032) (USD Billion)
10.3.2 Western Europe
10.3.2.1 Trends Analysis
10.3.2.2 Western Europe Structured Cabling Market Estimates and Forecasts, by Country (2020-2032) (USD Billion)
10.3.2.3 Western Europe Structured Cabling Market Estimates and Forecasts, By Type (2020-2032) (USD Billion)
10.3.2.4 Western Europe Structured Cabling Market Estimates and Forecasts, By Application (2020-2032) (USD Billion)
10.3.2.5 Western Europe Structured Cabling Market Estimates and Forecasts, By Vertical (2020-2032) (USD Billion)
10.3.2.6 Germany
10.3.2.6.1 Germany Structured Cabling Market Estimates and Forecasts, By Type (2020-2032) (USD Billion)
10.3.2.6.2 Germany Structured Cabling Market Estimates and Forecasts, By Application (2020-2032) (USD Billion)
10.3.2.6.3 Germany Structured Cabling Market Estimates and Forecasts, By Vertical (2020-2032) (USD Billion)
10.3.2.7 France
10.3.2.7.1 France Structured Cabling Market Estimates and Forecasts, By Type (2020-2032) (USD Billion)
10.3.2.7.2 France Structured Cabling Market Estimates and Forecasts, By Application (2020-2032) (USD Billion)
10.3.2.7.3 France Structured Cabling Market Estimates and Forecasts, By Vertical (2020-2032) (USD Billion)
10.3.2.8 UK
10.3.2.8.1 UK Structured Cabling Market Estimates and Forecasts, By Type (2020-2032) (USD Billion)
10.3.2.8.2 UK Structured Cabling Market Estimates and Forecasts, By Application (2020-2032) (USD Billion)
10.3.2.8.3 UK Structured Cabling Market Estimates and Forecasts, By Vertical (2020-2032) (USD Billion)
10.3.2.9 Italy
10.3.2.9.1 Italy Structured Cabling Market Estimates and Forecasts, By Type (2020-2032) (USD Billion)
10.3.2.9.2 Italy Structured Cabling Market Estimates and Forecasts, By Application (2020-2032) (USD Billion)
10.3.2.9.3 Italy Structured Cabling Market Estimates and Forecasts, By Vertical (2020-2032) (USD Billion)
10.3.2.10 Spain
10.3.2.10.1 Spain Structured Cabling Market Estimates and Forecasts, By Type (2020-2032) (USD Billion)
10.3.2.10.2 Spain Structured Cabling Market Estimates and Forecasts, By Application (2020-2032) (USD Billion)
10.3.2.10.3 Spain Structured Cabling Market Estimates and Forecasts, By Vertical (2020-2032) (USD Billion)
10.3.2.11 Netherlands
10.3.2.11.1 Netherlands Structured Cabling Market Estimates and Forecasts, By Type (2020-2032) (USD Billion)
10.3.2.11.2 Netherlands Structured Cabling Market Estimates and Forecasts, By Application (2020-2032) (USD Billion)
10.3.2.11.3 Netherlands Structured Cabling Market Estimates and Forecasts, By Vertical (2020-2032) (USD Billion)
10.3.2.12 Switzerland
10.3.2.12.1 Switzerland Structured Cabling Market Estimates and Forecasts, By Type (2020-2032) (USD Billion)
10.3.2.12.2 Switzerland Structured Cabling Market Estimates and Forecasts, By Application (2020-2032) (USD Billion)
10.3.2.12.3 Switzerland Structured Cabling Market Estimates and Forecasts, By Vertical (2020-2032) (USD Billion)
10.3.2.13 Austria
10.3.2.13.1 Austria Structured Cabling Market Estimates and Forecasts, By Type (2020-2032) (USD Billion)
10.3.2.13.2 Austria Structured Cabling Market Estimates and Forecasts, By Application (2020-2032) (USD Billion)
10.3.2.13.3 Austria Structured Cabling Market Estimates and Forecasts, By Vertical (2020-2032) (USD Billion)
10.3.2.14 Rest of Western Europe
10.3.2.14.1 Rest of Western Europe Structured Cabling Market Estimates and Forecasts, By Type (2020-2032) (USD Billion)
10.3.2.14.2 Rest of Western Europe Structured Cabling Market Estimates and Forecasts, By Application (2020-2032) (USD Billion)
10.3.2.14.3 Rest of Western Europe Structured Cabling Market Estimates and Forecasts, By Vertical (2020-2032) (USD Billion)
10.4 Asia Pacific
10.4.1 Trends Analysis
10.4.2 Asia Pacific Structured Cabling Market Estimates and Forecasts, by Country (2020-2032) (USD Billion)
10.4.3 Asia Pacific Structured Cabling Market Estimates and Forecasts, By Type (2020-2032) (USD Billion)
10.4.4 Asia Pacific Structured Cabling Market Estimates and Forecasts, By Application (2020-2032) (USD Billion)
10.4.5 Asia Pacific Structured Cabling Market Estimates and Forecasts, By Vertical (2020-2032) (USD Billion)
10.4.6 China
10.4.6.1 China Structured Cabling Market Estimates and Forecasts, By Type (2020-2032) (USD Billion)
10.4.6.2 China Structured Cabling Market Estimates and Forecasts, By Application (2020-2032) (USD Billion)
10.4.6.3 China Structured Cabling Market Estimates and Forecasts, By Vertical (2020-2032) (USD Billion)
10.4.7 India
10.4.7.1 India Structured Cabling Market Estimates and Forecasts, By Type (2020-2032) (USD Billion)
10.4.7.2 India Structured Cabling Market Estimates and Forecasts, By Application (2020-2032) (USD Billion)
10.4.7.3 India Structured Cabling Market Estimates and Forecasts, By Vertical (2020-2032) (USD Billion)
10.4.8 Japan
10.4.8.1 Japan Structured Cabling Market Estimates and Forecasts, By Type (2020-2032) (USD Billion)
10.4.8.2 Japan Structured Cabling Market Estimates and Forecasts, By Application (2020-2032) (USD Billion)
10.4.8.3 Japan Structured Cabling Market Estimates and Forecasts, By Vertical (2020-2032) (USD Billion)
10.4.9 South Korea
10.4.9.1 South Korea Structured Cabling Market Estimates and Forecasts, By Type (2020-2032) (USD Billion)
10.4.9.2 South Korea Structured Cabling Market Estimates and Forecasts, By Application (2020-2032) (USD Billion)
10.4.9.3 South Korea Structured Cabling Market Estimates and Forecasts, By Vertical (2020-2032) (USD Billion)
10.4.10 Vietnam
10.4.10.1 Vietnam Structured Cabling Market Estimates and Forecasts, By Type (2020-2032) (USD Billion)
10.4.10.2 Vietnam Structured Cabling Market Estimates and Forecasts, By Application (2020-2032) (USD Billion)
10.4.10.3 Vietnam Structured Cabling Market Estimates and Forecasts, By Vertical (2020-2032) (USD Billion)
10.4.11 Singapore
10.4.11.1 Singapore Structured Cabling Market Estimates and Forecasts, By Type (2020-2032) (USD Billion)
10.4.11.2 Singapore Structured Cabling Market Estimates and Forecasts, By Application (2020-2032) (USD Billion)
10.4.11.3 Singapore Structured Cabling Market Estimates and Forecasts, By Vertical (2020-2032) (USD Billion)
10.4.12 Australia
10.4.12.1 Australia Structured Cabling Market Estimates and Forecasts, By Type (2020-2032) (USD Billion)
10.4.12.2 Australia Structured Cabling Market Estimates and Forecasts, By Application (2020-2032) (USD Billion)
10.4.12.3 Australia Structured Cabling Market Estimates and Forecasts, By Vertical (2020-2032) (USD Billion)
10.4.13 Rest of Asia Pacific
10.4.13.1 Rest of Asia Pacific Structured Cabling Market Estimates and Forecasts, By Type (2020-2032) (USD Billion)
10.4.13.2 Rest of Asia Pacific Structured Cabling Market Estimates and Forecasts, By Application (2020-2032) (USD Billion)
10.4.13.3 Rest of Asia Pacific Structured Cabling Market Estimates and Forecasts, By Vertical (2020-2032) (USD Billion)
10.5 Middle East and Africa
10.5.1 Middle East
10.5.1.1 Trends Analysis
10.5.1.2 Middle East Structured Cabling Market Estimates and Forecasts, by Country (2020-2032) (USD Billion)
10.5.1.3 Middle East Structured Cabling Market Estimates and Forecasts, By Type (2020-2032) (USD Billion)
10.5.1.4 Middle East Structured Cabling Market Estimates and Forecasts, By Application (2020-2032) (USD Billion)
10.5.1.5 Middle East Structured Cabling Market Estimates and Forecasts, By Vertical (2020-2032) (USD Billion)
10.5.1.6 UAE
10.5.1.6.1 UAE Structured Cabling Market Estimates and Forecasts, By Type (2020-2032) (USD Billion)
10.5.1.6.2 UAE Structured Cabling Market Estimates and Forecasts, By Application (2020-2032) (USD Billion)
10.5.1.6.3 UAE Structured Cabling Market Estimates and Forecasts, By Vertical (2020-2032) (USD Billion)
10.5.1.7 Egypt
10.5.1.7.1 Egypt Structured Cabling Market Estimates and Forecasts, By Type (2020-2032) (USD Billion)
10.5.1.7.2 Egypt Structured Cabling Market Estimates and Forecasts, By Application (2020-2032) (USD Billion)
10.5.1.7.3 Egypt Structured Cabling Market Estimates and Forecasts, By Vertical (2020-2032) (USD Billion)
10.5.1.8 Saudi Arabia
10.5.1.8.1 Saudi Arabia Structured Cabling Market Estimates and Forecasts, By Type (2020-2032) (USD Billion)
10.5.1.8.2 Saudi Arabia Structured Cabling Market Estimates and Forecasts, By Application (2020-2032) (USD Billion)
10.5.1.8.3 Saudi Arabia Structured Cabling Market Estimates and Forecasts, By Vertical (2020-2032) (USD Billion)
10.5.1.9 Qatar
10.5.1.9.1 Qatar Structured Cabling Market Estimates and Forecasts, By Type (2020-2032) (USD Billion)
10.5.1.9.2 Qatar Structured Cabling Market Estimates and Forecasts, By Application (2020-2032) (USD Billion)
10.5.1.9.3 Qatar Structured Cabling Market Estimates and Forecasts, By Vertical (2020-2032) (USD Billion)
10.5.1.10 Rest of Middle East
10.5.1.10.1 Rest of Middle East Structured Cabling Market Estimates and Forecasts, By Type (2020-2032) (USD Billion)
10.5.1.10.2 Rest of Middle East Structured Cabling Market Estimates and Forecasts, By Application (2020-2032) (USD Billion)
10.5.1.10.3 Rest of Middle East Structured Cabling Market Estimates and Forecasts, By Vertical (2020-2032) (USD Billion)
10.5.2 Africa
10.5.2.1 Trends Analysis
10.5.2.2 Africa Structured Cabling Market Estimates and Forecasts, by Country (2020-2032) (USD Billion)
10.5.2.3 Africa Structured Cabling Market Estimates and Forecasts, By Type (2020-2032) (USD Billion)
10.5.2.4 Africa Structured Cabling Market Estimates and Forecasts, By Application (2020-2032) (USD Billion)
10.5.2.5 Africa Structured Cabling Market Estimates and Forecasts, By Vertical (2020-2032) (USD Billion)
10.5.2.6 South Africa
10.5.2.6.1 South Africa Structured Cabling Market Estimates and Forecasts, By Type (2020-2032) (USD Billion)
10.5.2.6.2 South Africa Structured Cabling Market Estimates and Forecasts, By Application (2020-2032) (USD Billion)
10.5.2.6.3 South Africa Structured Cabling Market Estimates and Forecasts, By Vertical (2020-2032) (USD Billion)
10.5.2.7 Nigeria
10.5.2.7.1 Nigeria Structured Cabling Market Estimates and Forecasts, By Type (2020-2032) (USD Billion)
10.5.2.7.2 Nigeria Structured Cabling Market Estimates and Forecasts, By Application (2020-2032) (USD Billion)
10.5.2.7.3 Nigeria Structured Cabling Market Estimates and Forecasts, By Vertical (2020-2032) (USD Billion)
10.5.2.8 Rest of Africa
10.5.2.8.1 Rest of Africa Structured Cabling Market Estimates and Forecasts, By Type (2020-2032) (USD Billion)
10.5.2.8.2 Rest of Africa Structured Cabling Market Estimates and Forecasts, By Application (2020-2032) (USD Billion)
10.5.2.8.3 Rest of Africa Structured Cabling Market Estimates and Forecasts, By Vertical (2020-2032) (USD Billion)
10.6 Latin America
10.6.1 Trends Analysis
10.6.2 Latin America Structured Cabling Market Estimates and Forecasts, by Country (2020-2032) (USD Billion)
10.6.3 Latin America Structured Cabling Market Estimates and Forecasts, By Type (2020-2032) (USD Billion)
10.6.4 Latin America Structured Cabling Market Estimates and Forecasts, By Application (2020-2032) (USD Billion)
10.6.5 Latin America Structured Cabling Market Estimates and Forecasts, By Vertical (2020-2032) (USD Billion)
10.6.6 Brazil
10.6.6.1 Brazil Structured Cabling Market Estimates and Forecasts, By Type (2020-2032) (USD Billion)
10.6.6.2 Brazil Structured Cabling Market Estimates and Forecasts, By Application (2020-2032) (USD Billion)
10.6.6.3 Brazil Structured Cabling Market Estimates and Forecasts, By Vertical (2020-2032) (USD Billion)
10.6.7 Argentina
10.6.7.1 Argentina Structured Cabling Market Estimates and Forecasts, By Type (2020-2032) (USD Billion)
10.6.7.2 Argentina Structured Cabling Market Estimates and Forecasts, By Application (2020-2032) (USD Billion)
10.6.7.3 Argentina Structured Cabling Market Estimates and Forecasts, By Vertical (2020-2032) (USD Billion)
10.6.8 Colombia
10.6.8.1 Colombia Structured Cabling Market Estimates and Forecasts, By Type (2020-2032) (USD Billion)
10.6.8.2 Colombia Structured Cabling Market Estimates and Forecasts, By Application (2020-2032) (USD Billion)
10.6.8.3 Colombia Structured Cabling Market Estimates and Forecasts, By Vertical (2020-2032) (USD Billion)
10.6.9 Rest of Latin America
10.6.9.1 Rest of Latin America Structured Cabling Market Estimates and Forecasts, By Type (2020-2032) (USD Billion)
10.6.9.2 Rest of Latin America Structured Cabling Market Estimates and Forecasts, By Application (2020-2032) (USD Billion)
10.6.9.3 Rest of Latin America Structured Cabling Market Estimates and Forecasts, By Vertical (2020-2032) (USD Billion)
11. Company Profiles
11.1 ABB Ltd.
11.1.1 Company Overview
11.1.2 Financial
11.1.3 Products/ Services Offered
11.1.4 SWOT Analysis
11.2 Anixter International Inc.
11.2.1 Company Overview
11.2.2 Financial
11.2.3 Products/ Services Offered
11.2.4 SWOT Analysis
11.3 Belden Inc.
11.3.1 Company Overview
11.3.2 Financial
11.3.3 Products/ Services Offered
11.3.4 SWOT Analysis
11.4 Legrand SA
11.4.1 Company Overview
11.4.2 Financial
11.4.3 Products/ Services Offered
11.4.4 SWOT Analysis
11.5 Panduit Corp
11.5.1 Company Overview
11.5.2 Financial
11.5.3 Products/ Services Offered
11.5.4 SWOT Analysis
11.6 CommScope Holding Co. Inc.
11.6.1 Company Overview
11.6.2 Financial
11.6.3 Products/ Services Offered
11.6.4 SWOT Analysis
11.7 Furukawa Electric
11.7.1 Company Overview
11.7.2 Financial
11.7.3 Products/ Services Offered
11.7.4 SWOT Analysis
11.8 Cisco Systems Inc.
11.8.1 Company Overview
11.8.2 Financial
11.8.3 Products/ Services Offered
11.8.4 SWOT Analysis
11.9 Corning Inc.
11.9.1 Company Overview
11.9.2 Financial
11.9.3 Products/ Services Offered
11.9.4 SWOT Analysis
11.10 Datwyler Holding Inc.
11.10.1 Company Overview
11.10.2 Financial
11.10.3 Products/ Services Offered
11.10.4 SWOT Analysis
12. Use Cases and Best Practices
13. Conclusion
An accurate research report requires proper strategizing as well as implementation. There are multiple factors involved in the completion of good and accurate research report and selecting the best methodology to compete the research is the toughest part. Since the research reports we provide play a crucial role in any company’s decision-making process, therefore we at SNS Insider always believe that we should choose the best method which gives us results closer to reality. This allows us to reach at a stage wherein we can provide our clients best and accurate investment to output ratio.
Each report that we prepare takes a timeframe of 350-400 business hours for production. Starting from the selection of titles through a couple of in-depth brain storming session to the final QC process before uploading our titles on our website we dedicate around 350 working hours. The titles are selected based on their current market cap and the foreseen CAGR and growth.
The 5 steps process:
Step 1: Secondary Research:
Secondary Research or Desk Research is as the name suggests is a research process wherein, we collect data through the readily available information. In this process we use various paid and unpaid databases which our team has access to and gather data through the same. This includes examining of listed companies’ annual reports, Journals, SEC filling etc. Apart from this our team has access to various associations across the globe across different industries. Lastly, we have exchange relationships with various university as well as individual libraries.
Step 2: Primary Research
When we talk about primary research, it is a type of study in which the researchers collect relevant data samples directly, rather than relying on previously collected data. This type of research is focused on gaining content specific facts that can be sued to solve specific problems. Since the collected data is fresh and first hand therefore it makes the study more accurate and genuine.
We at SNS Insider have divided Primary Research into 2 parts.
Part 1 wherein we interview the KOLs of major players as well as the upcoming ones across various geographic regions. This allows us to have their view over the market scenario and acts as an important tool to come closer to the accurate market numbers. As many as 45 paid and unpaid primary interviews are taken from both the demand and supply side of the industry to make sure we land at an accurate judgement and analysis of the market.
This step involves the triangulation of data wherein our team analyses the interview transcripts, online survey responses and observation of on filed participants. The below mentioned chart should give a better understanding of the part 1 of the primary interview.
Part 2: In this part of primary research the data collected via secondary research and the part 1 of the primary research is validated with the interviews from individual consultants and subject matter experts.
Consultants are those set of people who have at least 12 years of experience and expertise within the industry whereas Subject Matter Experts are those with at least 15 years of experience behind their back within the same space. The data with the help of two main processes i.e., FGDs (Focused Group Discussions) and IDs (Individual Discussions). This gives us a 3rd party nonbiased primary view of the market scenario making it a more dependable one while collation of the data pointers.
Step 3: Data Bank Validation
Once all the information is collected via primary and secondary sources, we run that information for data validation. At our intelligence centre our research heads track a lot of information related to the market which includes the quarterly reports, the daily stock prices, and other relevant information. Our data bank server gets updated every fortnight and that is how the information which we collected using our primary and secondary information is revalidated in real time.
Step 4: QA/QC Process
After all the data collection and validation our team does a final level of quality check and quality assurance to get rid of any unwanted or undesired mistakes. This might include but not limited to getting rid of the any typos, duplication of numbers or missing of any important information. The people involved in this process include technical content writers, research heads and graphics people. Once this process is completed the title gets uploader on our platform for our clients to read it.
Step 5: Final QC/QA Process:
This is the last process and comes when the client has ordered the study. In this process a final QA/QC is done before the study is emailed to the client. Since we believe in giving our clients a good experience of our research studies, therefore, to make sure that we do not lack at our end in any way humanly possible we do a final round of quality check and then dispatch the study to the client.
Key Segments:
Request for Segment Customization as per your Business Requirement: Segment Customization Request
Regional Coverage:
North America
US
Canada
Mexico
Europe
Eastern Europe
Poland
Romania
Hungary
Turkey
Rest of Eastern Europe
Western Europe
Germany
France
UK
Italy
Spain
Netherlands
Switzerland
Austria
Rest of Western Europe
Asia Pacific
China
India
Japan
South Korea
Vietnam
Singapore
Australia
Rest of Asia Pacific
Middle East & Africa
Middle East
UAE
Egypt
Saudi Arabia
Qatar
Rest of Middle East
Africa
Nigeria
South Africa
Rest of Africa
Latin America
Brazil
Argentina
Colombia
Rest of Latin America
Request for Country Level Research Report: Country Level Customization Request
Available Customization
With the given market data, SNS Insider offers customization as per the company’s specific needs. The following customization options are available for the report:
Detailed Volume Analysis
Criss-Cross segment analysis (e.g. Product X Application)
Competitive Product Benchmarking
Geographic Analysis
Additional countries in any of the regions
Customized Data Representation
Detailed analysis and profiling of additional market players
The Interposer and Fan-out Wafer Level Packaging Market was valued at USD 32.38 billion in 2023 and is projected to reach USD 88.77 billion by 2032, growing at a CAGR of 11.86% from 2024 to 2032.
The Interactive Tables Market was valued at USD 1.43 Billion in 2023 and is expected to reach USD 3.01 Billion by 2032 and grow at a CAGR of 8.66% over the forecast period 2024-2032.
The Satellite Modem Market Size was valued at USD 507.2 million in 2023, and is expected to reach USD 1391.88 million by 2032, and grow at a CAGR of 11.87% over the forecast period 2024-2032.
The IoT Node and Gateway Market Size was valued at USD 478.12 billion in 2023 and is expected to reach USD 1459.33 billion by 2032 and grow at a CAGR of 13.2% over the forecast period 2024-2032.
The Data Acquisition (DAQ) System Market size is expected to be valued at USD 8.84 Billion in 2023. It is estimated to reach USD 17.37 Billion by 2032, growing at a CAGR of 7.8% during 2024-2032.
The Thyristor Protectors Market size was Valued at USD 0.7 billion in 2023 and is estimated to Reach USD 1.006 billion by 2032 and grow at a CAGR of 4.11% over the forecast period of 2024-2032.
Hi! Click one of our member below to chat on Phone