image

Stroke Diagnostics and Therapeutics Market Report Scope & Overview:

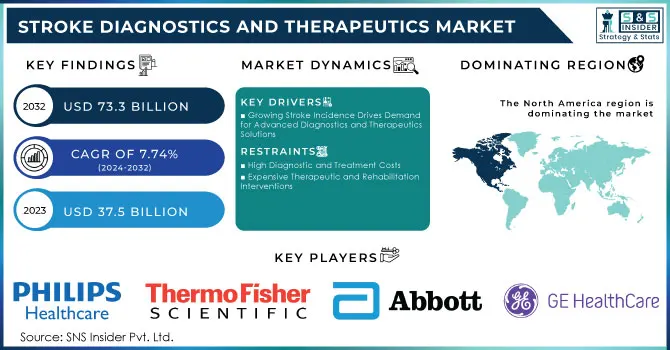
The Stroke Diagnostics and Therapeutics Market was valued at USD 37.5 Billion in 2023 and is expected to reach USD 73.3 Billion by 2032 and grow at a CAGR of 7.74% over the forecast period of 2024-2032.

Stroke diagnostics and therapeutics are the most promising markets with significant growth, led mainly by increased cases of ischemic strokes. According to the CDC, 795,000 people suffer from a new or recurrent stroke every year in the United States, which was due to an ischemic stroke in 87% of the cases. Increasing cases of stroke, especially ischemic stroke due to arterial blockage, make for a compelling case for more advanced diagnostics as well as novel treatments.

Technological developments in imaging, among them CT and Magnetic Resonance Imaging (MRI) scans, have significantly improved the accuracy and speed of stroke diagnosis; and demand throughout much of the world for such technologies grows daily. Imaging innovations such as perfusion and diffusion-weighted imaging allow neurologists to ascertain damage to brain tissue more precisely, which might now result in more favorable outcomes because of improved treatment. Integration of telemedicine into stroke care has been introduced as a means of expanding access to expert consultations, especially where needed, in underserved regions, and improving patient outcomes.

Public health initiatives have educated the masses on the symptoms of a stroke, which enables patients to access a health facility in the early stages, thus increasing diagnosis rates. The research into stroke management is ongoing, and new therapeutic interventions such as clot-dissolving drugs and personalized rehabilitation have been established, hence increasing market growth.

Hence, despite this upward trend, high-end diagnostic equipment and therapy-priced treatments remain a major challenge. Advanced MRI and CT scanners, operational costs, and maintenance costs act as major impediments to the growth of the market. Huge monetary limitations amongst patients themselves also exist, especially in those cases where patients are not sufficiently covered by insurance programs, limiting them from availing of stroke care in an outright and comprehensive manner.

However, the market will keep moving due to the emphasis placed on early detection, personalized medicine, and telehealth solutions. Rising incidences of strokes, combined with other developments in diagnostics and therapeutics, are expected to cause tremendous growth in the stroke diagnostics and treatment market during the next few years.

Table of Diagnostic Techniques (for stroke)

Diagnostic Method (for Stroke)

Description

Advantages

Limitations

CT Scan

Imaging to detect brain abnormalities

Fast and widely available

Limited in detecting small strokes

MRI

High-resolution imaging for detailed brain structure

Superior detail and sensitivity

Longer time required for scanning

Ultrasound

Used to examine blood flow in the carotid arteries

Non-invasive and cost-effective

Limited to superficial blood flow

PET Scan

Functional imaging that detects metabolic activity

Useful for identifying tissue viability

High cost and less availability

Angiography

Imaging blood vessels using contrast dye

Excellent for visualizing blockages

Invasive and carries some risk


Table of Therapeutic Approaches (in stroke):

Therapeutic Approach (in stroke)

Description

Indications

Common Medications

Thrombolysis

Use of clot-dissolving drugs to restore blood flow

Ischemic stroke

tPA (Tissue Plasminogen Activator)

Antiplatelet Therapy

Prevention of further clots by inhibiting platelet aggregation

Post-stroke prevention

Aspirin, Clopidogrel

Anticoagulants

Blood thinners to prevent clot formation

Atrial fibrillation and DVT

Warfarin, Rivaroxaban

Surgical Intervention

Procedures to remove clots or repair blood vessels

Severe cases and hemorrhagic strokes

Endovascular procedures

Rehabilitation Therapy

Physical and occupational therapy for recovery

Post-stroke recovery

Customized rehabilitation programs


Stroke Diagnostics and Therapeutics Market Dynamics

Drivers

  • Growing Stroke Incidence Drives Demand for Advanced Diagnostics and Therapeutics Solutions

Increasing stroke cases across the global population provide an initial impetus for market growth in the Stroke Diagnostics and Therapeutics Market. Contributing factors such as the aging demographic, sedentary lifestyles, and elevated rates of high blood pressure, diabetes, and obesity are fueling increased demand for healthcare services related to stroke. According to the World Health Organization's Global Stroke Factsheet, lifetime stroke risk has risen by 50% in the past 17 years. Presently, it has been observed that 1 in every 4 people will suffer from a stroke at some point during their lifetime.

This would further enhance the incidence of stroke and all of its complications in the aged population of the developed world, increasing the demand for a sophisticated diagnostic tool, new treatment options, and comprehensive rehabilitation solutions. Apart from this, increased awareness programs relating to the prevention of stroke, risk factors, and early warning signs for stroke are enhancing early diagnosis and timely medical intervention, hence further augmenting the demand for effective stroke care solutions worldwide.

A leading trend in the stroke diagnostics and therapeutics market is the increasing use of artificial intelligence and machine learning algorithms for stroke diagnosis and imaging analysis. AI-based platforms can rapidly analyze medical images such as CT scans and MRIs to detect slight stroke indicators find areas that suffer from ischemia and enable differentiation between various stroke subtypes. This technology aids radiologists and neurologists in the interpretation of complex imaging data and thus substantially reduces the time taken to interpret, improving diagnostic accuracy.

The expansion of telemedicine and remote stroke care is altering the market landscape. Digital biomarkers and remote monitoring technologies are gaining acceptability. They allow continuous follow-up with a stroke patient's health. These will facilitate early detection of complications, risk assessment for recurrence, and implementation of individualized treatment strategies based on real-time analytics. Remote stroke management is thus more efficient and accessible.

Restraints

  • High Diagnostic and Treatment Costs

  • Expensive Therapeutic and Rehabilitation Interventions

  • Stroke Diagnostics and Therapeutics Market Segmentation Overview

By Type

The stroke diagnostics and therapeutics market is subdivided into two main categories: diagnostics and therapeutics. From these two categories, in 2023 therapeutics has accounted for the highest share of revenue at 57.3% of the overall market revenue. This can be mainly ascribed to immediate therapy post stroke where therapeutic interventions are given greater acuteness to stabilize the patient's condition. The therapeutics segment is further promoted by the easy availability of diverse treatment options, including medications, surgical procedures, and rehabilitation therapies.

On the other hand, diagnostics will witness the highest growth during the forecast period. Increasing appreciation of the importance of early stroke detection and timely, accurate diagnosis, there is an increasing desire for more advanced diagnostic tools and technologies, including imaging modalities, biomarker analysis, and genetic testing. All of these advance the diagnostic timeline, which reduces long-term complications and improves patient outcomes. The growth of this segment is further catalyzed by the increasing adoption of non-invasive and efficient diagnostic techniques.

By Application

Based on Application, the stroke diagnostics and therapeutics market can be divided into two types: ischemic stroke and hemorrhagic stroke. Amongst them, the ischemic stroke segment held the largest market share of 76.4% in 2023. This is mainly because the number of patients suffering from ischemic stroke is much more as compared to hemorrhagic strokes. The research findings by Neurology Clinics indicate that ischemic strokes are responsible for 70% to 80% of total deaths as a result of stroke in the United States. Since it is anticipated that the incidence of stroke, on average, will continue to increase, the segment for ischemic stroke is likely to increase at a stable rate over the next few years.

However, the hemorrhagic stroke segment is likely to be the largest gainer during the forecasting period. Even though the incidence is relatively low, there is a higher risk of death and permanent disability associated with hemorrhagic stroke. Growth in this area is primarily driven by further developments in diagnostic imaging and therapeutic interventions as well as growing interest in more timely diagnosis and treatment of hemorrhagic stroke. More importantly, rising awareness about the severe health impact of hemorrhagic strokes is fueling healthcare spending as well as the need for advanced stroke care solutions, which in turn is driving fast growth in the segment.

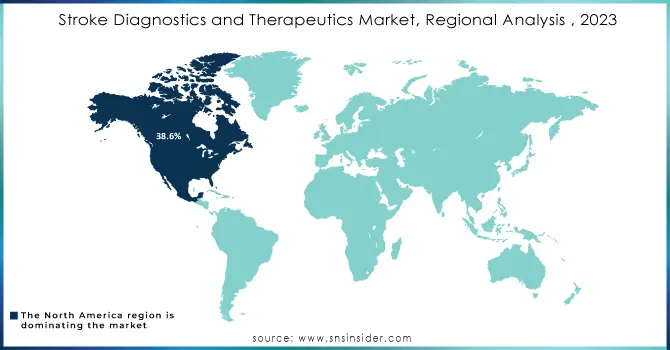
Stroke Diagnostics and Therapeutics Market Regional Analysis

The North American region continued to be a leader in the global market, accounting for 38.6% of the shares in the year 2023. For example, in the United States, a stroke occurs every 40 seconds, and somebody dies due to a stroke every 3 minutes and 14 seconds, as reported by the Centers for Disease Control and Prevention. Growth in the North American region is contributed to by a wide variety of factors like a rising incidence of strokes in the U.S. and Canada, thereby leading to an increased demand for diagnostic and therapeutic solutions. The growth rate in North America is driven strongly by the rapidly increasing elderly population; stroke incidence is far higher among older adults than in any other age group, driving the North American market forward.

The Asia Pacific region is expected to show the highest compound annual growth rate (CAGR) during the forecast period. Factors driving this growth include increased patient awareness and an upsurge in the level of healthcare expenditure in the major countries, China, Japan, and India. Stroke prevention is one of the main focus areas with early diagnosis and a developing infrastructure of healthcare facilities providing an inviting environment for the growth of the Stroke Diagnostics and Therapeutics Market in the Asia Pacific region.

Key Players in Stroke Diagnostics Market

  • Philips Healthcare

  • Roche Diagnostics

  • Thermo Fisher Scientific

  • Abbott Laboratories

  • Siemens Healthineers

  • GE Healthcare

  • Bayer

  • BrainHQ

  • Cordis Corporation

Key Players in Stroke Therapeutics Market 

Recent Developments

In Oct 2024, Siemens Healthineers partnered with over 20 industry and public organizations, including seven top stroke hospitals, to co-lead the UMBRELLA1 project aimed at improving stroke care across Europe. The €26.9 million initiative is funded by the Innovative Health Initiative (IHI) and industry partners, focusing on enhancing stroke management and patient outcomes over the next five years.

In May 2024, Midland Pharmaceuticals emerged as a new player in the market, focusing on the development of innovative therapeutics for spinal cord injuries and strokes. This company aims to advance treatment options in these critical areas, contributing to the ongoing evolution of stroke diagnostics and therapeutics.


Stroke Diagnostics and Therapeutics Market Report Scope:

Report Attributes Details
Market Size in 2023 US$ 37.5 billion 
Market Size by 2032 US$ 73.3 billion 
CAGR CAGR of 7.74% From 2024 to 2032
Base Year 2023
Forecast Period 2024-2032
Historical Data 2020-2022
Report Scope & Coverage Market Size, Segments Analysis, Competitive  Landscape, Regional Analysis, DROC & SWOT Analysis, Forecast Outlook
Key Segments • By Type [Diagnostics (Imaging Diagnostics, Blood Tests, Others), Therapeutics (Acute Stroke Therapies, Secondary Prevention Therapies, Neurorehabilitation)]
• By Application (Haemorrhagic Stroke, Ischemic Stroke)
Regional Analysis/Coverage North America (US, Canada, Mexico), Europe (Eastern Europe [Poland, Romania, Hungary, Turkey, Rest of Eastern Europe] Western Europe] Germany, France, UK, Italy, Spain, Netherlands, Switzerland, Austria, Rest of Western Europe]), Asia Pacific (China, India, Japan, South Korea, Vietnam, Singapore, Australia, Rest of Asia Pacific), Middle East & Africa (Middle East [UAE, Egypt, Saudi Arabia, Qatar, Rest of Middle East], Africa [Nigeria, South Africa, Rest of Africa], Latin America (Brazil, Argentina, Colombia, Rest of Latin America)
Company Profiles Philips Healthcare, Roche Diagnostics, Thermo Fisher Scientific, Abbott Laboratories, Siemens Healthineers, GE Healthcare, Bayer, BrainHQ, Cordis Corporation, Stryker Corporation, Pfizer, Boston Scientific Corporation, Genentech, Inc., Medtronic plc, Merck & Co. Inc, Siemens AG, Koninklijke Philips N.V.
Key Drivers • Growing Stroke Incidence Drives Demand for Advanced Diagnostics and Therapeutics Solutions
Restraints • High Diagnostic and Treatment Costs
• Expensive Therapeutic and Rehabilitation Interventions

Frequently Asked Questions

Ans: The estimated compound annual growth rate is 7.74% during the forecast period for the Stroke Diagnostics and Therapeutics market.

Ans: The projected market value of the Stroke Diagnostics and Therapeutics market is estimated at USD 37.5 billion in 2023 and is expected to reach USD 73.3 billion by 2032.

Ans: The growing stroke incidence drives demand for advanced diagnostics and therapeutics solutions.

Ans: High diagnostic and treatment costs are the restraints on the Stroke Diagnostics and Therapeutics market.

Ans: North America is the dominant region with a 38.6% share in the Stroke Diagnostics and Therapeutics market.

1. Introduction

1.1 Market Definition

1.2 Scope (Inclusion and Exclusions)

1.3 Research Assumptions

2. Executive Summary

2.1 Market Overview

2.2 Regional Synopsis

2.3 Competitive Summary

3. Research Methodology

3.1 Top-Down Approach

3.2 Bottom-up Approach

3.3. Data Validation

3.4 Primary Interviews

4. Market Dynamics Impact Analysis

4.1 Market Driving Factors Analysis

4.1.2 Drivers

4.1.2 Restraints

4.1.3 Opportunities

4.1.4 Challenges

4.2 PESTLE Analysis

4.3 Porter’s Five Forces Model

5. Statistical Insights and Trends Reporting

5.1 Incidence and Prevalence (2023)

5.2 Prescription Trends, (2023), by Region

5.3 Device Volume, by Region (2020-2032)

5.4 Healthcare Spending, by Region, (Government, Commercial, Private, Out-of-Pocket), 2023

6. Competitive Landscape

6.1 List of Major Companies, By Region

6.2 Market Share Analysis, By Region

6.3 Service Benchmarking

6.3.1 Service specifications and features

6.3.2 Pricing

6.4 Strategic Initiatives

6.4.1 Marketing and promotional activities

6.4.2 Distribution and Supply Chain Strategies

6.4.3 Expansion plans and new Service launches

6.4.4 Strategic partnerships and collaborations

6.5 Technological Advancements

6.6 Market Positioning and Branding

7. Stroke Diagnostics and Therapeutics Market Segmentation, by Type

    1. Chapter Overview

     7.2 Diagnostics

             7.2.1 Diagnostics Market Trends Analysis (2020-2032)

7.2.2 Diagnostics Market Size Estimates and Forecasts to 2032 (USD Million)

7.2.3 Imaging Diagnostics

             7.2.3.1 Imaging Diagnostics Market Trends Analysis (2020-2032)

7.2.3.2Imaging Diagnostics Market Size Estimates and Forecasts to 2032 (USD Million)

7.2.4 Blood Tests


             7.2.4.1 Blood Tests Market Trends Analysis (2020-2032)

7.2.4.2 Blood Tests Market Size Estimates and Forecasts to 2032 (USD Million)

7.2.5 Others

             7.2.5.1 Others Market Trends Analysis (2020-2032)

7.2.5.2 Others Market Size Estimates and Forecasts to 2032 (USD Million)

    7.3 Therapeutics

             7.3.1 Therapeutics Market Trends Analysis (2020-2032)

7.3.2 Therapeutics Market Size Estimates and Forecasts to 2032 (USD Million)

 7.3.3 Acute Stroke Therapies

             7.3.3.1 Acute Stroke Therapies Market Trends Analysis (2020-2032)

7.3.3.2 Acute Stroke Therapies Market Size Estimates and Forecasts to 2032 (USD Million)

7.3.4 Secondary Prevention Therapies

             7.3.4.1Secondary Prevention Therapies Market Trends Analysis (2020-2032)

7.3.4.2 Secondary Prevention Therapies Market Size Estimates and Forecasts to 2032 (USD Million)

7.3.5 Neurorehabilitation

             7.3.5.1 Neurorehabilitation Market Trends Analysis (2020-2032)

7.3.5.2 Neurorehabilitation Market Size Estimates and Forecasts to 2032 (USD Million)

8. Stroke Diagnostics and Therapeutics Market Segmentation, by Application  

    1. Chapter Overview

     8.2 Haemorrhagic Stroke

             8.2.1 Haemorrhagic Stroke Market Trends Analysis (2020-2032)

8.2.2 Haemorrhagic Stroke Market Size Estimates and Forecasts to 2032 (USD Million)

8.3 Ischemic Stroke

8.3.1 Ischemic Stroke Market Trends Analysis (2020-2032)

              8.3.2 Ischemic Stroke Market Size Estimates and Forecasts to 2032 (USD Million)

9. Regional Analysis

9.1 Chapter Overview

9.2 North America

9.2.1 Trends Analysis

9.2.2 North America Stroke Diagnostics and Therapeutics Market Estimates and Forecasts, by Country (2020-2032) (USD Million)

9.2.3 North America Stroke Diagnostics and Therapeutics Market Estimates and Forecasts, by Type (2020-2032) (USD Million)  

9.2.4 North America Stroke Diagnostics and Therapeutics Market Estimates and Forecasts, by Application (2020-2032) (USD Million)

9.2.5 USA

9.2.5.1 USA Stroke Diagnostics and Therapeutics Market Estimates and Forecasts, by Type (2020-2032) (USD Million)

9.2.5.2 USA Stroke Diagnostics and Therapeutics Market Estimates and Forecasts, by Application (2020-2032) (USD Million)

9.2.6 Canada

9.2.6.1 Canada Stroke Diagnostics and Therapeutics Market Estimates and Forecasts, by Type (2020-2032) (USD Million)

9.2.6.2 Canada Stroke Diagnostics and Therapeutics Market Estimates and Forecasts, by Application (2020-2032) (USD Million)

9.2.7 Mexico

9.2.7.1 Mexico Stroke Diagnostics and Therapeutics Market Estimates and Forecasts, by Type (2020-2032) (USD Million)

9.2.7.2 Mexico Stroke Diagnostics and Therapeutics Market Estimates and Forecasts, by Application (2020-2032) (USD Million)

9.3 Europe

9.3.1 Eastern Europe

9.3.1.1 Trends Analysis

9.3.1.2 Eastern Europe Stroke Diagnostics and Therapeutics Market Estimates and Forecasts, by Country (2020-2032) (USD Million)

9.3.1.3 Eastern Europe Stroke Diagnostics and Therapeutics Market Estimates and Forecasts, by Type (2020-2032) (USD Million)  

9.3.1.4 Eastern Europe Stroke Diagnostics and Therapeutics Market Estimates and Forecasts, by Application (2020-2032) (USD Million)

9.3.1.5 Poland

9.3.1.5.1 Poland Stroke Diagnostics and Therapeutics Market Estimates and Forecasts, by Type (2020-2032) (USD Million)

9.3.1.5.2 Poland Stroke Diagnostics and Therapeutics Market Estimates and Forecasts, by Application (2020-2032) (USD Million)

9.3.1.6 Romania

9.3.1.6.1 Romania Stroke Diagnostics and Therapeutics Market Estimates and Forecasts, by Type (2020-2032) (USD Million)

9.3.1.6.2 Romania Stroke Diagnostics and Therapeutics Market Estimates and Forecasts, by Application (2020-2032) (USD Million)

9.3.1.7 Hungary

9.3.1.7.1 Hungary Stroke Diagnostics and Therapeutics Market Estimates and Forecasts, by Type (2020-2032) (USD Million)

9.3.1.7.2 Hungary Stroke Diagnostics and Therapeutics Market Estimates and Forecasts, by Application (2020-2032) (USD Million)

9.3.1.8 Turkey

9.3.1.8.1 Turkey Stroke Diagnostics and Therapeutics Market Estimates and Forecasts, by Type (2020-2032) (USD Million)

9.3.1.8.2 Turkey Stroke Diagnostics and Therapeutics Market Estimates and Forecasts, by Application (2020-2032) (USD Million)

9.3.1.9 Rest of Eastern Europe

9.3.1.9.1 Rest of Eastern Europe Stroke Diagnostics and Therapeutics Market Estimates and Forecasts, by Type (2020-2032) (USD Million)

9.3.1.9.2 Rest of Eastern Europe Stroke Diagnostics and Therapeutics Market Estimates and Forecasts, by Application (2020-2032) (USD Million)

9.3.2 Western Europe

9.3.2.1 Trends Analysis

9.3.2.2 Western Europe Stroke Diagnostics and Therapeutics Market Estimates and Forecasts, by Country (2020-2032) (USD Million)

9.3.2.3 Western Europe Stroke Diagnostics and Therapeutics Market Estimates and Forecasts, by Type (2020-2032) (USD Million)  

9.3.2.4 Western Europe Stroke Diagnostics and Therapeutics Market Estimates and Forecasts, by Application (2020-2032) (USD Million)

9.3.2.5 Germany

9.3.2.5.1 Germany Stroke Diagnostics and Therapeutics Market Estimates and Forecasts, by Type (2020-2032) (USD Million)

9.3.2.5.2 Germany Stroke Diagnostics and Therapeutics Market Estimates and Forecasts, by Application (2020-2032) (USD Million)

9.3.2.6 France

9.3.2.6.1 France Stroke Diagnostics and Therapeutics Market Estimates and Forecasts, by Type (2020-2032) (USD Million)

9.3.2.6.2 France Stroke Diagnostics and Therapeutics Market Estimates and Forecasts, by Application (2020-2032) (USD Million)

9.3.2.7 UK

9.3.2.7.1 UK Stroke Diagnostics and Therapeutics Market Estimates and Forecasts, by Type (2020-2032) (USD Million)

9.3.2.7.2 UK Stroke Diagnostics and Therapeutics Market Estimates and Forecasts, by Application (2020-2032) (USD Million)

9.3.2.8 Italy

9.3.2.8.1 Italy Stroke Diagnostics and Therapeutics Market Estimates and Forecasts, by Type (2020-2032) (USD Million)

9.3.2.8.2 Italy Stroke Diagnostics and Therapeutics Market Estimates and Forecasts, by Application (2020-2032) (USD Million)

9.3.2.9 Spain

9.3.2.9.1 Spain Stroke Diagnostics and Therapeutics Market Estimates and Forecasts, by Type (2020-2032) (USD Million)

9.3.2.9.2 Spain Stroke Diagnostics and Therapeutics Market Estimates and Forecasts, by Application (2020-2032) (USD Million)

9.3.2.10 Netherlands

9.3.2.10.1 Netherlands Stroke Diagnostics and Therapeutics Market Estimates and Forecasts, by Type (2020-2032) (USD Million)

9.3.2.10.2 Netherlands Stroke Diagnostics and Therapeutics Market Estimates and Forecasts, by Application (2020-2032) (USD Million)

9.3.2.11 Switzerland

9.3.2.11.1 Switzerland Stroke Diagnostics and Therapeutics Market Estimates and Forecasts, by Type (2020-2032) (USD Million)

9.3.2.11.2 Switzerland Stroke Diagnostics and Therapeutics Market Estimates and Forecasts, by Application (2020-2032) (USD Million)

9.3.2.12 Austria

9.3.2.12.1 Austria Stroke Diagnostics and Therapeutics Market Estimates and Forecasts, by Type (2020-2032) (USD Million)

9.3.2.12.2 Austria Stroke Diagnostics and Therapeutics Market Estimates and Forecasts, by Application (2020-2032) (USD Million)

9.3.2.13 Rest of Western Europe

9.3.2.13.1 Rest of Western Europe Stroke Diagnostics and Therapeutics Market Estimates and Forecasts, by Type (2020-2032) (USD Million)

9.3.2.13.2 Rest of Western Europe Stroke Diagnostics and Therapeutics Market Estimates and Forecasts, by Application (2020-2032) (USD Million)

9.4 Asia Pacific

9.4.1 Trends Analysis

9.4.2 Asia Pacific Stroke Diagnostics and Therapeutics Market Estimates and Forecasts, by Country (2020-2032) (USD Million)

9.4.3 Asia Pacific Stroke Diagnostics and Therapeutics Market Estimates and Forecasts, by Type (2020-2032) (USD Million)  

9.4.4 Asia Pacific Stroke Diagnostics and Therapeutics Market Estimates and Forecasts, by Application (2020-2032) (USD Million)

9.4.5 China

9.4.5.1 China Stroke Diagnostics and Therapeutics Market Estimates and Forecasts, by Type (2020-2032) (USD Million)

9.4.5.2 China Stroke Diagnostics and Therapeutics Market Estimates and Forecasts, by Application (2020-2032) (USD Million)

9.4.6 India

9.4.5.1 India Stroke Diagnostics and Therapeutics Market Estimates and Forecasts, by Type (2020-2032) (USD Million)

9.4.5.2 India Stroke Diagnostics and Therapeutics Market Estimates and Forecasts, by Application (2020-2032) (USD Million)

9.4.5 Japan

9.4.5.1 Japan Stroke Diagnostics and Therapeutics Market Estimates and Forecasts, by Type (2020-2032) (USD Million)

9.4.5.2 Japan Stroke Diagnostics and Therapeutics Market Estimates and Forecasts, by Application (2020-2032) (USD Million)

9.4.6 South Korea

9.4.6.1 South Korea Stroke Diagnostics and Therapeutics Market Estimates and Forecasts, by Type  (2020-2032) (USD Million)

9.4.6.2 South Korea Stroke Diagnostics and Therapeutics Market Estimates and Forecasts, by Application  (2020-2032) (USD Million)

9.4.7 Vietnam

9.4.7.1 Vietnam Stroke Diagnostics and Therapeutics Market Estimates and Forecasts, by Type  (2020-2032) (USD Million)

9.2.7.2 Vietnam Stroke Diagnostics and Therapeutics Market Estimates and Forecasts, by Application  (2020-2032) (USD Million)

9.4.8 Singapore

9.4.8.1 Singapore Stroke Diagnostics and Therapeutics Market Estimates and Forecasts, by Type  (2020-2032) (USD Million)

9.4.8.2 Singapore Stroke Diagnostics and Therapeutics Market Estimates and Forecasts, by Application  (2020-2032) (USD Million)

9.4.9 Australia

9.4.9.1 Australia Stroke Diagnostics and Therapeutics Market Estimates and Forecasts, by Type  (2020-2032) (USD Million)

9.4.9.2 Australia Stroke Diagnostics and Therapeutics Market Estimates and Forecasts, by Application  (2020-2032) (USD Million)

9.4.10 Rest of Asia Pacific

9.4.10.1 Rest of Asia Pacific Stroke Diagnostics and Therapeutics Market Estimates and Forecasts, by Type  (2020-2032) (USD Million)

9.4.10.2 Rest of Asia Pacific Stroke Diagnostics and Therapeutics Market Estimates and Forecasts, by Application  (2020-2032) (USD Million)

9.5 Middle East and Africa

9.5.1 Middle East

9.5.1.1 Trends Analysis

9.5.1.2 Middle East Stroke Diagnostics and Therapeutics Market Estimates and Forecasts, by Country (2020-2032) (USD Million)

9.5.1.3 Middle East Stroke Diagnostics and Therapeutics Market Estimates and Forecasts, by Type  (2020-2032) (USD Million)  

9.5.1.4 Middle East Stroke Diagnostics and Therapeutics Market Estimates and Forecasts, by Application  (2020-2032) (USD Million)

9.5.1.5 UAE

9.5.1.5.1 UAE Stroke Diagnostics and Therapeutics Market Estimates and Forecasts, by Type  (2020-2032) (USD Million)

9.5.1.5.2 UAE Stroke Diagnostics and Therapeutics Market Estimates and Forecasts, by Application  (2020-2032) (USD Million)

9.5.1.6 Egypt

9.5.1.6.1 Egypt Stroke Diagnostics and Therapeutics Market Estimates and Forecasts, by Type  (2020-2032) (USD Million)

9.5.1.6.2 Egypt Stroke Diagnostics and Therapeutics Market Estimates and Forecasts, by Application  (2020-2032) (USD Million)

9.5.1.7 Saudi Arabia

9.5.1.7.1 Saudi Arabia Stroke Diagnostics and Therapeutics Market Estimates and Forecasts, by Type  (2020-2032) (USD Million)

9.5.1.7.2 Saudi Arabia Stroke Diagnostics and Therapeutics Market Estimates and Forecasts, by Application  (2020-2032) (USD Million)

9.5.1.8 Qatar

9.5.1.8.1 Qatar Stroke Diagnostics and Therapeutics Market Estimates and Forecasts, by Type  (2020-2032) (USD Million)

9.5.1.8.2 Qatar Stroke Diagnostics and Therapeutics Market Estimates and Forecasts, by Application  (2020-2032) (USD Million)

9.5.1.9 Rest of Middle East

9.5.1.9.1 Rest of Middle East Stroke Diagnostics and Therapeutics Market Estimates and Forecasts, by Type  (2020-2032) (USD Million)

9.5.1.9.2 Rest of Middle East Stroke Diagnostics and Therapeutics Market Estimates and Forecasts, by Application  (2020-2032) (USD Million)

9.5.2 Africa

9.5.2.1 Trends Analysis

9.5.2.2 Africa Stroke Diagnostics and Therapeutics Market Estimates and Forecasts, by Country (2020-2032) (USD Million)

9.5.2.3 Africa Stroke Diagnostics and Therapeutics Market Estimates and Forecasts, by Type  (2020-2032) (USD Million)  

9.5.2.4 Africa Stroke Diagnostics and Therapeutics Market Estimates and Forecasts, by Application  (2020-2032) (USD Million)

9.5.2.5 South Africa

9.5.2.5.1 South Africa Stroke Diagnostics and Therapeutics Market Estimates and Forecasts, by Type  (2020-2032) (USD Million)

9.5.2.5.2 South Africa Stroke Diagnostics and Therapeutics Market Estimates and Forecasts, by Application  (2020-2032) (USD Million)

9.5.2.6 Nigeria

9.5.2.6.1 Nigeria Stroke Diagnostics and Therapeutics Market Estimates and Forecasts, by Type  (2020-2032) (USD Million)

9.5.2.6.2 Nigeria Stroke Diagnostics and Therapeutics Market Estimates and Forecasts, by Application  (2020-2032) (USD Million)

9.6 Latin America

9.6.1 Trends Analysis

9.6.2 Latin America Stroke Diagnostics and Therapeutics Market Estimates and Forecasts, by Country (2020-2032) (USD Million)

9.6.3 Latin America Stroke Diagnostics and Therapeutics Market Estimates and Forecasts, by Type  (2020-2032) (USD Million)  

9.6.4 Latin America Stroke Diagnostics and Therapeutics Market Estimates and Forecasts, by Application  (2020-2032) (USD Million)

9.6.5 Brazil

9.6.5.1 Brazil Stroke Diagnostics and Therapeutics Market Estimates and Forecasts, by Type  (2020-2032) (USD Million)

9.6.5.2 Brazil Stroke Diagnostics and Therapeutics Market Estimates and Forecasts, by Application  (2020-2032) (USD Million)

9.6.6 Argentina

9.6.6.1 Argentina Stroke Diagnostics and Therapeutics Market Estimates and Forecasts, by Type  (2020-2032) (USD Million)

9.6.6.2 Argentina Stroke Diagnostics and Therapeutics Market Estimates and Forecasts, by Application  (2020-2032) (USD Million)

9.6.7 Colombia

9.6.7.1 Colombia Stroke Diagnostics and Therapeutics Market Estimates and Forecasts, by Type  (2020-2032) (USD Million)

9.6.7.2 Colombia Stroke Diagnostics and Therapeutics Market Estimates and Forecasts, by Application  (2020-2032) (USD Million)

9.6.8 Rest of Latin America

9.6.8.1 Rest of Latin America Stroke Diagnostics and Therapeutics Market Estimates and Forecasts, by Type (2020-2032) (USD Million)

9.6.8.2 Rest of Latin America Stroke Diagnostics and Therapeutics Market Estimates and Forecasts, by Application (2020-2032) (USD Million)

10. Company Profiles

10.1 Philips Healthcare

10.1.1 Company Overview

10.1.2 Financial

10.1.3 Services/ Services Offered

110.1.4 SWOT Analysis

10.2 Roche Diagnostics

10.2.1 Company Overview

10.2.2 Financial

10.2.3 Services/ Services Offered

10.2.4 SWOT Analysis

10.3 Thermo Fisher Scientific

10.3.1 Company Overview

10.3.2 Financial

10.3.3 Services/ Services Offered

10.3.4 SWOT Analysis

10.4 Abbott Laboratories

10.4.1 Company Overview

10.4.2 Financial

10.4.3 Services/ Services Offered

10.4.4 SWOT Analysis

10.5 Siemens Healthineers

10.5.1 Company Overview

10.5.2 Financial

10.5.3 Services/ Services Offered

10.5.4 SWOT Analysis

10.6 GE Healthcare

10.6.1 Company Overview

10.6.2 Financial

10.6.3 Services/ Services Offered

10.6.4 SWOT Analysis

10.7 Bayer

10.7.1 Company Overview

10.7.2 Financial

10.7.3 Services/ Services Offered

10.7.4 SWOT Analysis

10.8 Cordis Corporation

10.8.1 Company Overview

10.8.2 Financial

10.8.3 Services/ Services Offered

10.8.4 SWOT Analysis

10.9 Stryker Corporation

10.9.1 Company Overview

10.9.2 Financial

10.9.3 Services/ Services Offered

10.9.4 SWOT Analysis

10.10 Pfizer

10.9.1 Company Overview

10.9.2 Financial

10.9.3 Services/ Services Offered

10.9.4 SWOT Analysis

11. Use Cases and Best Practices

12. Conclusion

An accurate research report requires proper strategizing as well as implementation. There are multiple factors involved in the completion of good and accurate research report and selecting the best methodology to compete the research is the toughest part. Since the research reports we provide play a crucial role in any company’s decision-making process, therefore we at SNS Insider always believe that we should choose the best method which gives us results closer to reality. This allows us to reach at a stage wherein we can provide our clients best and accurate investment to output ratio.

Each report that we prepare takes a timeframe of 350-400 business hours for production. Starting from the selection of titles through a couple of in-depth brain storming session to the final QC process before uploading our titles on our website we dedicate around 350 working hours. The titles are selected based on their current market cap and the foreseen CAGR and growth.


The 5 steps process:

Step 1: Secondary Research:

Secondary Research or Desk Research is as the name suggests is a research process wherein, we collect data through the readily available information. In this process we use various paid and unpaid databases which our team has access to and gather data through the same. This includes examining of listed companies’ annual reports, Journals, SEC filling etc. Apart from this our team has access to various associations across the globe across different industries. Lastly, we have exchange relationships with various university as well as individual libraries.

Secondary Research

Step 2: Primary Research

When we talk about primary research, it is a type of study in which the researchers collect relevant data samples directly, rather than relying on previously collected data.  This type of research is focused on gaining content specific facts that can be sued to solve specific problems. Since the collected data is fresh and first hand therefore it makes the study more accurate and genuine.

We at SNS Insider have divided Primary Research into 2 parts.

Part 1 wherein we interview the KOLs of major players as well as the upcoming ones across various geographic regions. This allows us to have their view over the market scenario and acts as an important tool to come closer to the accurate market numbers. As many as 45 paid and unpaid primary interviews are taken from both the demand and supply side of the industry to make sure we land at an accurate judgement and analysis of the market.

This step involves the triangulation of data wherein our team analyses the interview transcripts, online survey responses and observation of on filed participants. The below mentioned chart should give a better understanding of the part 1 of the primary interview.

Primary Research

Part 2: In this part of primary research the data collected via secondary research and the part 1 of the primary research is validated with the interviews from individual consultants and subject matter experts.

Consultants are those set of people who have at least 12 years of experience and expertise within the industry whereas Subject Matter Experts are those with at least 15 years of experience behind their back within the same space. The data with the help of two main processes i.e., FGDs (Focused Group Discussions) and IDs (Individual Discussions). This gives us a 3rd party nonbiased primary view of the market scenario making it a more dependable one while collation of the data pointers.

Step 3: Data Bank Validation

Once all the information is collected via primary and secondary sources, we run that information for data validation. At our intelligence centre our research heads track a lot of information related to the market which includes the quarterly reports, the daily stock prices, and other relevant information. Our data bank server gets updated every fortnight and that is how the information which we collected using our primary and secondary information is revalidated in real time.

Data Bank Validation

Step 4: QA/QC Process

After all the data collection and validation our team does a final level of quality check and quality assurance to get rid of any unwanted or undesired mistakes. This might include but not limited to getting rid of the any typos, duplication of numbers or missing of any important information. The people involved in this process include technical content writers, research heads and graphics people. Once this process is completed the title gets uploader on our platform for our clients to read it.

Step 5: Final QC/QA Process:

This is the last process and comes when the client has ordered the study. In this process a final QA/QC is done before the study is emailed to the client. Since we believe in giving our clients a good experience of our research studies, therefore, to make sure that we do not lack at our end in any way humanly possible we do a final round of quality check and then dispatch the study to the client.

Key Segmentation

By Type

  • Diagnostics

    • Imaging Diagnostics

    • Blood Tests

    • Others

  • Therapeutics

    • Acute Stroke Therapies

    • Secondary Prevention Therapies

    • Neurorehabilitation

By Application

  • Haemorrhagic Stroke

  • Ischemic Stroke

Request for Segment Customization as per your Business Requirement: Segment Customization Request

Regional Coverage:

North America

  • US

  • Canada

  • Mexico

Europe

  • Eastern Europe

    • Poland

    • Romania

    • Hungary

    • Turkey

    • Rest of Eastern Europe

  • Western Europe

    • Germany

    • France

    • UK

    • Italy

    • Spain

    • Netherlands

    • Switzerland

    • Austria

    • Rest of Western Europe

Asia Pacific

  • China

  • India

  • Japan

  • South Korea

  • Vietnam

  • Singapore

  • Australia

  • Rest of Asia Pacific

Middle East & Africa

Middle East

  • UAE

  • Egypt

  • Saudi Arabia

  • Qatar

  • Rest of the Middle East

Africa

  • Nigeria

  • South Africa

  • Rest of Africa

Latin America

  • Brazil

  • Argentina

  • Colombia

  • Rest of Latin America

Request for Country Level Research Report: Country Level Customization Request

Available Customization

With the given market data, SNS Insider offers customization as per the company’s specific needs. The following customization options are available for the report:

  • Product Analysis

  • Criss-Cross segment analysis (e.g. Product X Application)

  • Product Matrix which gives a detailed comparison of the product portfolio of each company

  • Geographic Analysis

  • Additional countries in any of the regions

  • Company Information

  • Detailed analysis and profiling of additional market players (Up to five)


  •            5000 (33% Discount)


  •            8950 (40% Discount)


  •            3050 (23% Discount)

Start a Conversation

Hi! Click one of our member below to chat on Phone