STEM Education In K-12 Market Report Scope & Overview:
The STEM Education in K-12 Market was valued at USD 58.71 billion in 2024 and is expected to reach USD 168.63 billion by 2032, growing at a CAGR of 14.17% from 2025-2032.

To Get more information on STEM Education in K-12 Market - Request Free Sample Report
This report includes key insights on policy and regulation trends, demographic participation data, program outcomes and career interests, and student performance metrics. The market is witnessing rapid growth driven by increasing governmental focus on STEM curriculum integration, enhanced funding initiatives, and private sector collaborations aimed at future workforce readiness. Rising student interest in science and technology careers, coupled with improved access to digital learning tools and resources, is further boosting participation across diverse demographic groups. Continuous assessment of student performance metrics and program impact is shaping educational strategies, helping institutions and policymakers align learning outcomes with evolving industry demands and skill requirements, fostering a more innovation-driven education ecosystem.
U.S. STEM Education In K-12 Market was valued at USD 14.12 billion in 2024 and is expected to reach USD 46.26 billion by 2032, growing at a CAGR of 14.09% from 2025-2032.
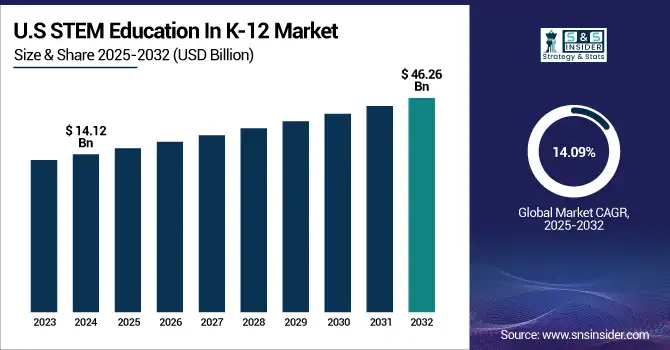
The growth of the U.S. STEM Education in K-12 Market is driven by a strong national emphasis on developing future-ready skills to meet the demands of a technology-driven economy. Increased federal and state investments, curriculum reforms, and partnerships with tech companies are enhancing STEM learning environments. The rising need for a skilled workforce in AI, robotics, and data science is encouraging early exposure to STEM disciplines. Additionally, digital transformation in education, expanding access to online and blended learning tools, and efforts to close gender and diversity gaps are contributing to wider participation and sustained market expansion through 2032.
STEM Education in K-12 Market Size and Forecast:
-
Market Size in 2024: USD 58.71 Billion
-
Market Size by 2032: USD 168.63 Billion
-
CAGR: 14.17% from 2025 to 2032
-
Base Year: 2024
-
Forecast Period: 2025–2032
-
Historical Data: 2021–2023
Key STEM Education in K-12 Market Trends:
-
Integration of AI and machine learning in classrooms enhances personalized learning, adaptive assessments, and skill-based progression for students.
-
Expansion of robotics and hands-on STEM kits fosters experiential learning, creativity, and problem-solving skills among K-12 students.
-
Growth of coding, programming, and computational thinking programs prepares students for technology-driven careers and future workforce demands.
-
Focus on STEAM (STEM + Arts) encourages interdisciplinary learning, combining creativity with scientific and technical knowledge for holistic education.
-
Adoption of virtual labs, AR/VR, and gamified learning tools improves engagement, interactive learning, and comprehension of complex STEM concepts.
-
Government initiatives and increased funding for STEM programs drive curriculum development, teacher training, and infrastructure improvements in K-12 schools.
-
Emphasis on closing gender gaps and promoting inclusivity in STEM encourages equitable access and participation among all students.
STEM Education in K-12 Market Drivers:
-
Rising demand for future-ready skills is prompting K-12 institutions to embed STEM learning early in academic curriculums.
The growing necessity to prepare students for careers in science, technology, engineering, and mathematics is transforming K-12 education globally. As technology becomes more pervasive across all industries, academic institutions are emphasizing STEM competencies to align with labor market trends. Educators and policymakers are advocating curriculum reforms, interactive teaching models, and real-world problem-solving experiences to boost student engagement. Integration of coding, robotics, and data literacy from elementary levels is becoming a norm to build foundational skills. The shift toward digital economies also pushes schools to incorporate interdisciplinary learning through STEM to develop critical thinking, creativity, and analytical skills. This evolving landscape has made STEM education not only relevant but essential in equipping students with adaptable skillsets for future workforce requirements.
STEM Education in K-12 Market Restraints:
-
Limited access to qualified STEM educators hinders the quality and scalability of K-12 STEM education initiatives.
A significant gap exists between the demand for STEM-focused learning and the availability of trained, experienced educators to deliver it. Many schools, especially in rural and underserved areas, face challenges in hiring teachers with adequate STEM backgrounds or certifications. Without properly trained staff, even well-funded programs fail to deliver intended learning outcomes. This educator shortage not only affects classroom delivery but also limits students' exposure to advanced STEM topics. Moreover, professional development programs for teachers often lack depth or consistency, leaving educators underprepared for rapid curriculum advancements. As a result, the potential impact of STEM education initiatives is curtailed, affecting the overall growth and adoption of these programs across K-12 education systems.
STEM Education in K-12 Market Opportunities:
-
Integration of emerging technologies like AI and VR in STEM curricula is opening new immersive learning experiences for K-12 students.
The increasing availability of advanced technologies is creating innovative ways to engage students in STEM subjects. Tools such as virtual reality, augmented reality, artificial intelligence, and gamified simulations allow learners to explore complex scientific concepts in interactive environments. These tech-based solutions enhance understanding, retention, and enthusiasm, especially in subjects perceived as difficult. With education technology companies introducing affordable and scalable platforms, schools can implement immersive experiences across various grade levels. Furthermore, the adoption of these technologies prepares students for tech-driven careers by familiarizing them with industry-relevant tools early on. The trend also encourages more collaboration between schools and tech providers, fostering a dynamic and future-ready STEM education ecosystem.
STEM Education in K-12 Market Challenges:
-
Inconsistent curriculum standards across regions make it difficult to implement uniform and scalable K-12 STEM programs.
A major hurdle in expanding STEM education in K-12 settings lies in the fragmented nature of educational policies and curricula. Different school districts or countries often follow unique frameworks, making it challenging to design unified STEM programs or assessments. This lack of standardization affects how subjects are taught, which technologies are used, and how outcomes are measured. As a result, students may receive uneven learning experiences based on geography or funding levels. The absence of a cohesive strategy complicates teacher training and resource distribution as well. Without streamlined curriculum alignment, scaling STEM initiatives effectively and ensuring equal access to quality education remains a persistent challenge for educators and policymakers.
STEM Education in K-12 Market Segmentation Analysis:
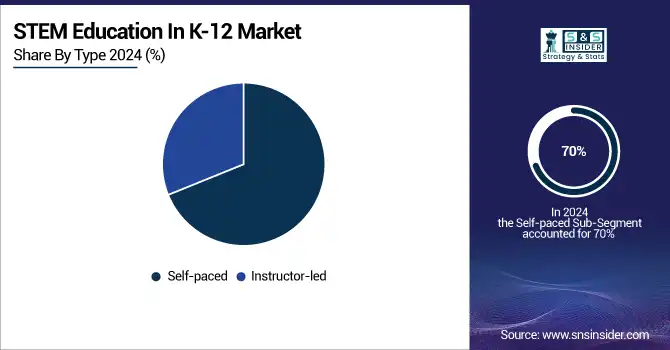
By Type, Self-Paced Learning Leads STEM Education in K-12 Market, While Instructor-Led Segment Grows Rapidly
Self-paced segment dominated the STEM Education in K-12 market with the highest revenue share of about 70% in 2024 due to its flexibility, accessibility, and scalability. Students can learn at their own pace, which enhances comprehension and engagement, particularly in complex STEM subjects. The approach supports diverse learning styles, reduces dependency on instructor availability, and integrates well with digital platforms. Additionally, schools favor self-paced solutions for cost-effectiveness and ease of implementation across different grade levels and geographic regions.
Instructor-led segment is expected to grow at the fastest CAGR of about 15.87% from 2025–2032 due to its personalized guidance, real-time feedback, and structured learning environment. As schools invest in quality STEM education, demand for qualified instructors and interactive sessions is increasing. Instructor-led models offer better support for hands-on activities, complex problem-solving, and collaborative learning. This method is especially effective in building critical thinking and team-based skills, making it increasingly popular among educators and parents alike.
By Application, High School Segment Dominates STEM Education Market, Middle School Segment Shows Fastest Growth
High School (9–12) segment dominated the STEM Education in K-12 market with the highest revenue share of about 42% in 2024 owing to a stronger focus on career readiness and college preparation. Students in this stage are more engaged in advanced STEM subjects like calculus, physics, and coding. Schools prioritize this age group with specialized programs, labs, and industry exposure to prepare students for higher education and tech-driven careers. This segment also sees higher participation in extracurricular STEM competitions and certifications.
Middle School (6–8) segment is expected to grow at the fastest CAGR of about 15.60% from 2025–2032 due to the increasing focus on early STEM intervention. Educators and policymakers are targeting this age group to build foundational skills and stimulate interest in STEM fields before high school. Interactive modules, gamified learning, and early exposure to coding and robotics are helping boost engagement. This proactive approach enhances retention in STEM pathways, setting a strong academic and career direction early on.
STEM Education in K-12 Market Regional Analysis:
North America Dominates STEM Education in K-12 Market in 2024
North America holds an estimated 38% market share in 2024, driven by strong government initiatives promoting STEM curriculum, high adoption of digital learning tools, and increasing investment in educational infrastructure. This causes widespread integration of technology-enhanced learning platforms and personalized STEM programs across schools. Additionally, partnerships between schools, universities, and tech companies provide students with real-world STEM exposure.

Get Customized Report as per Your Business Requirement - Enquiry Now
-
United States Leads North America’s STEM Education Market
The U.S. dominates due to a well-established educational infrastructure, high funding for STEM programs, and a strong emphasis on technology adoption in classrooms. Initiatives like Code.org and NSF-backed STEM curricula support teacher training and curriculum development. EdTech adoption, including interactive learning platforms, robotics kits, and coding programs, enhances student engagement and skill development. These factors collectively make the U.S. central to North America’s STEM education growth, driving innovation, accessibility, and quality learning outcomes across K-12 institutions.
Asia Pacific is the Fastest-Growing Region in STEM Education in the K-12 Market in 2024
The region is expected to grow at a CAGR of 16.5%, driven by rising government focus on STEM skills, increasing investments in EdTech, and expanding internet penetration. This causes rapid adoption of digital learning platforms and STEM-focused curricula. Private and public schools increasingly integrate hands-on STEM labs and project-based learning to prepare students for higher education and future careers in technology and engineering.
-
China Leads Asia Pacific’s STEM Education Market
China dominates the Asia Pacific market due to large student populations, government-backed STEM initiatives, and investments in smart classrooms and online learning platforms. Programs like “Made in China 2025” emphasize technological innovation and early STEM exposure. EdTech adoption, including robotics, coding, and AI-integrated learning solutions, is rapidly expanding. China’s focus on quality education, tech infrastructure, and scalable digital tools positions it as the market leader in the region.
Europe STEM Education Market Insights, 2024
Europe is witnessing steady growth in STEM K-12 education, driven by educational reforms, digital curriculum adoption, and government-backed STEM initiatives across schools. Germany’s emphasis on digital STEM labs and coding programs improves student skill development, causing higher engagement and performance in science and technology subjects.
-
Germany Leads Europe’s STEM Education Market
Germany dominates due to its robust education system, focus on vocational STEM training, and widespread integration of digital tools in classrooms. Initiatives like MINT-EC promote STEM excellence, while schools implement interactive coding and robotics programs. Collaboration with industry ensures students gain hands-on experience in engineering, science, and technology projects. Germany’s leadership encourages other European countries to adopt similar programs, reinforcing its position as the regional hub for STEM K-12 education and innovation.
Middle East & Africa and Latin America STEM Education Market Insights, 2024
The STEM K-12 market in these regions is expanding steadily, supported by government initiatives, EdTech adoption, and investments in school infrastructure. Countries such as the UAE and Saudi Arabia focus on smart classrooms and coding programs, while Brazil and Mexico implement technology-driven STEM curricula to enhance science and math skills. Partnerships with international organizations and private EdTech companies are fostering digital learning, robotics labs, and teacher training. Rising awareness of STEM’s importance in future workforce development is driving market adoption in schools across both regions.
Competitive Landscape of the STEM Education in K-12 Market:
Activate Learning
Activate Learning is a U.S.-based leader in K–12 STEM education, specializing in science curricula such as OpenSciEd K–12 and elementary science kits. With extensive experience in curriculum development, the company designs and implements interactive, inquiry-based learning solutions that engage students in hands-on STEM activities. Its programs integrate digital platforms, kits, and lesson plans to support personalized learning across grades. Activate Learning operates in schools nationwide, providing teacher training, curriculum support, and resources that foster scientific literacy and problem-solving skills. Its role in the STEM education market is vital, as it empowers students to explore concepts independently and prepares them for advanced studies in science, technology, engineering, and math.
-
In 2024, Activate Learning expanded its OpenSciEd K–12 curriculum with enhanced digital modules, interactive labs, and teacher professional development programs, reinforcing hands-on STEM learning.
Amplify Education, Inc.
Amplify Education, Inc. is a U.S.-based STEM education company offering programs like Amplify Science and mCLASS, focusing on inquiry-driven learning and literacy integration. It designs engaging, research-backed curricula that enhance student understanding in science, technology, and engineering. Amplify supports educators with digital tools, assessment platforms, and interactive resources that enable differentiated instruction and data-driven insights. Its role in the STEM education market is significant, providing scalable solutions that improve student outcomes and engagement in K–12 classrooms.
-
In March 2024, Amplify Education launched updated Amplify Science modules with immersive simulations, adaptive assessments, and collaborative activities to strengthen STEM comprehension.
Bedford, Freeman & Worth Publishing Group, LLC
Bedford, Freeman & Worth Publishing Group, LLC is a U.S.-based educational publisher specializing in advanced STEM learning materials, including Physics for the IB Diploma and Principles of Life. The company provides comprehensive textbooks, digital content, and supplementary resources for high school students, supporting curriculum standards and exam preparation. Its role in the STEM education market is crucial, delivering rigorous, research-informed materials that foster critical thinking, problem-solving, and conceptual mastery. Bedford, Freeman & Worth facilitates both in-class instruction and remote learning, enhancing accessibility and student engagement.
-
In January 2024, the company released enhanced digital editions with interactive exercises, simulations, and teacher guides to boost STEM learning outcomes.
Carolina Biological Supply Company
Carolina Biological Supply Company is a U.S.-based STEM education provider offering laboratory kits, curriculum materials, and hands-on experiments for K–12 students. Its STEM curriculum solutions, such as STC Elementary Curriculum and Building Blocks of Science, support experiential learning, critical thinking, and scientific inquiry. Carolina Biological serves schools and districts nationwide, providing training, technical support, and classroom resources. Its role in the STEM market is essential, enabling students to conduct experiments safely, understand complex concepts, and engage actively with STEM subjects.
-
In 2024, Carolina Biological Supply expanded its STEM kits with updated experiments, virtual lab simulations, and instructional support for remote and hybrid learning environments.
STEM Education in the K-12 Market Key Players:
-
Amplify Education, Inc.
-
Bedford, Freeman & Worth Publishing Group, LLC
-
Carolina Biological Supply Company
-
Cengage Learning
-
Discovery Education
-
Houghton Mifflin Harcourt
-
Kendall Hunt Publishing Company
-
Lab-Aids
-
McGraw Hill
-
OpenSciEd
-
PASCO Scientific
-
Savvas Learning
-
School Specialty, LLC
-
Vernier Software & Technology
-
LEGO Education
-
Pearson Education
-
STEMfinity
-
TCI (Teachers’ Curriculum Institute)
| Report Attributes | Details |
|---|---|
| Market Size in 2024 | US$ 58.71 Billion |
| Market Size by 2032 | US$ 168.63 Billion |
| CAGR | CAGR of 14.17% From 2025 to 2032 |
| Base Year | 2024 |
| Forecast Period | 2025-2032 |
| Historical Data | 2021-2023 |
| Report Scope & Coverage | Market Size, Segments Analysis, Competitive Landscape, Regional Analysis, DROC & SWOT Analysis, Forecast Outlook |
| Key Segments | • By Type (Self-paced, Instructor-led) • By Application (Elementary School (K-5), Middle School (6-8), High School (9-12)) |
| Regional Analysis/Coverage | North America (US, Canada, Mexico), Europe (Eastern Europe [Poland, Romania, Hungary, Turkey, Rest of Eastern Europe] Western Europe] Germany, France, UK, Italy, Spain, Netherlands, Switzerland, Austria, Rest of Western Europe]), Asia Pacific (China, India, Japan, South Korea, Vietnam, Singapore, Australia, Rest of Asia Pacific), Middle East & Africa (Middle East [UAE, Egypt, Saudi Arabia, Qatar, Rest of Middle East], Africa [Nigeria, South Africa, Rest of Africa], Latin America (Brazil, Argentina, Colombia, Rest of Latin America) |
| Company Profiles | Activate Learning, Amplify Education, Inc., Bedford, Freeman & Worth Publishing Group, LLC, Carolina Biological Supply Company, Cengage Learning, Discovery Education, EduCo International, Houghton Mifflin Harcourt, Kendall Hunt Publishing Company, Lab-Aids, McGraw Hill, OpenSciEd, PASCO Scientific, Savvas Learning, School Specialty, LLC |
