Get More Information on Spring Water Market - Request Sample Report
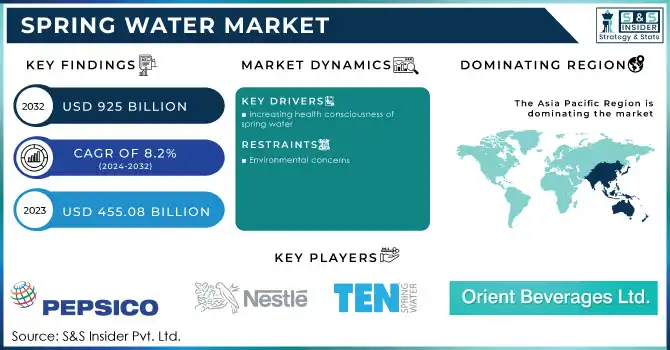
The Spring Water Market size was USD 455.08 billion in 2023 and is expected to Reach USD 925 billion by 2032 and grow at a CAGR of 8.2% over the forecast period of 2024-2032.
Spring water is water that flows naturally from the ground from an underground aquifer. It is typically collected from natural springs, although it can also be bottled and sold in retail establishments. Because it is naturally filtered by the ground, spring water is generally considered to be healthier than other types of water, such as tap water or refined water.
Based on Packaging, Spring water is dominated by bottled springs, however, canned springs are gaining ground due to convenience and sustainability. In accordance with the International Bottled Water Association, bottled water will account for around 92.5% of total sales in the United States in 2022.
The supermarkets/hypermarkets distribution channel is expected to grow most rapidly. Supermarkets and hypermarkets provide a wide range of consumer goods and food and beverage products, along with convenience and substantial savings. It operates at convenient times and at an easily accessible location. It has a wide customer base and generates consistent revenue for market participants.
KEY DRIVERS
Increasing health consciousness of spring water
Consumers are becoming more conscious of the necessity of hydration and are seeking healthier beverage options. Because it is free of calories, sugar, and artificial chemicals, spring water is seen as a healthier option than other beverages such as sugary drinks and sodas. Furthermore, spring water is considered to include important elements that are good for your health, such as calcium, magnesium, and potassium. These minerals are essential for bone health, muscle function, and overall well-being. Spring water is becoming increasingly popular among consumers as a result of these supposed health benefits. This is fueling the spring water market's rise, which is projected to continue in the future years.
RESTRAIN
Environmental concerns
The generation of plastic garbage is among the main worries. Spring water is often sold in plastic bottles that end up in landfills or harm the environment. According to a World Wildlife Fund survey, over 1 million plastic bottles are purchased every minute, with only 9% recycled. Another issue to be concerned about is the exploitation of spring water. Spring water is obtained from subsurface aquifers, which are natural water reserves. Excessive spring water extraction can deplete aquifers and harm ecosystems. Furthermore, spring water companies are frequently required to carry their products over large distances to market. This mode of transportation may emit greenhouse gases and contribute to climate change.
Government regulations
OPPORTUNITY
Development of new products
Springwater firms are constantly inventing to create new goods that fit consumers' evolving needs. Some spring water firms are also offering flavored spring water, such as lemon, cucumber, and mint. These flavored spring waters are popular with customers looking for a pleasant and healthy alternative to sugary drinks. Other spring water firms are now producing nutrient-enriched spring water, such as electrolytes and vitamins. These nutrient-enhanced spring waters are popular among athletes and consumers trying to improve their hydration and nutrition levels. The creation of new goods is driving growth in the spring water market since it meets consumers' changing wants.
Investment in sustainable practices
CHALLENGES
High Cost of Spring Water Bottle
A spring water bottle is significantly more expensive than tap water. On average, spring bottled water costs 9.47 dollars per gallon, while the same amount of tap water costs 0.005 dollars. As a result, bottled water might be 2,000 times more expensive than tap water. In addition, many consumers dislike the taste, odor, and color of spring water. When the costs of production, distribution, and promotion for each spring bottle are considered, the total costs are substantial. Many bottled water facilities in springs sell purified consumption of water from the same water source as local water utilities.
The war between Russia and Ukraine is having an enormous impact on the spring water business. According to the International Bottled Water Association, 85% of spring water producers have reported an increase in production costs since the start of the war. Furthermore, 65% of businesses have reported interrupted supply networks. In other markets, the war has also reduced demand for spring water. since the beginning of the war, sales of spring water have dropped by 20% globally. Since the commencement of the war, the price of bottled water has risen by 10%.
During a recession, Spring water is frequently considered to be an expensive product, and consumers are prone to reduce their expenditure on expensive products. Tap water is a far cheaper option than spring water then customers are more likely to convert to tap water to save money. Some consumers are concerned about bottled water's environmental impact, and they may be more likely to convert to tap water during a recession to lessen their environmental impact. This has led to the Ukrainian bottled water market is anticipated to contract by 20% by 2023.
By Packaging
Bottled
Canned
By Distribution Channel
Supermarkets/Hypermarkets
Speciality Stores
Online Sales
Others
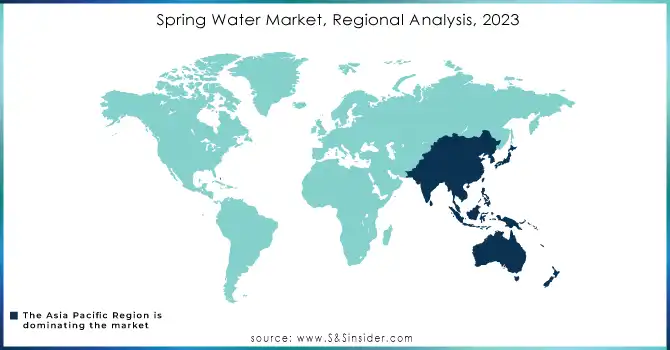
The Asia Pacific region is the largest market for spring water, with a 6.5% CAGR during the forecast period. The region's market growth can be ascribed to the region's vast population, rising income levels, and changing lifestyles of consumers. Furthermore, rising awareness of the health benefits of drinking spring water is propelling the market in this region forward.
The North American region is predicted to be the market for spring water, with a 5.9% CAGR during the forecast period. The growing health consciousness among consumers, as well as increased awareness about the benefits of drinking spring water, can be associated with the market's expansion in this region. the demand for spring water is high among athletes, sports persons, and consumers willing to have healthy lifestyles.
Europe accounted for 29.8% of the market share for spring water in 2022. The region's high share may be attributed mostly to the highest demand for natural spring water in Germany and France, which contributed 13.5% and 23.1% of the market volume share, respectively. Because of the increasing number of health-conscious customers and the increased use of bottled beverages, Europe leads the spring water market.
Need Any Customization Research On Spring Water Market- Inquiry Now
REGIONAL COVERAGE
North America
US
Canada
Mexico
Europe
Eastern Europe
Poland
Romania
Hungary
Turkey
Rest of Eastern Europe
Western Europe
Germany
France
UK
Italy
Spain
Netherlands
Switzerland
Austria
Rest of Western Europe
Asia Pacific
China
India
Japan
South Korea
Vietnam
Singapore
Australia
Rest of Asia Pacific
Middle East & Africa
Middle East
UAE
Egypt
Saudi Arabia
Qatar
Rest of Middle East
Africa
Nigeria
South Africa
Rest of Africa
Latin America
Brazil
Argentina
Colombia
Rest of Latin America
Some major key players in the Spring Water Market are KYIQ MOUNTAIN, Orient Beverages Pvt. Ltd., Ten Spring Water, CG Roxane LLC, Nestle S.A., PepsiCo, Berrington Water, Primo Water Corporation, Bluetriton Brands, Bisleri, Himalayas ONTOP., Danone, Tata Consumer Products Limited, and other key players.
In February 2023, Primo Water Corporation, a major North American and European supplier of sustainable drinking water solutions, announced the acquisition of another spring water source in Garland County, Arkansas, near to its existing Mountain Valley spring.
In May 2023, KYIQ MOUNTAIN is proud to introduce its high-quality 100% Natural Spring Water, sourced directly from the magnificent Yukon Mountains. KYIQ MOUNTAIN takes pleasure in using a natural mineral spring to provide unique mineral water that fulfills the highest purity and flavor standards.
In October 2023, Bisleri will expand its manufacturing and distribution networks. Bisleri is also expanding its offers into carbonated soft drinks, premiumization with the brand Vedica Himalayan Spring Water, and an innovative approach to its backbone of the packaged drinking water industry.
Report Attributes | Details |
Market Size in 2023 | US$ 455.08 Billion |
Market Size by 2032 | US$ 925 Billion |
CAGR | CAGR of 8.2 % From 2024 to 2032 |
Base Year | 2023 |
Forecast Period | 2024-2032 |
Historical Data | 2020-2022 |
Report Scope & Coverage | Market Size, Segments Analysis, Competitive Landscape, Regional Analysis, DROC & SWOT Analysis, Forecast Outlook |
Key Segments | • By Packaging (Bottled, Canned) • By Distribution Channel (Supermarkets/Hypermarkets, Speciality Stores, Online Sales, Others) |
Regional Analysis/Coverage | North America (US, Canada, Mexico), Europe (Eastern Europe [Poland, Romania, Hungary, Turkey, Rest of Eastern Europe] Western Europe] Germany, France, UK, Italy, Spain, Netherlands, Switzerland, Austria, Rest of Western Europe]), Asia Pacific (China, India, Japan, South Korea, Vietnam, Singapore, Australia, Rest of Asia Pacific), Middle East & Africa (Middle East [UAE, Egypt, Saudi Arabia, Qatar, Rest of Middle East], Africa [Nigeria, South Africa, Rest of Africa], Latin America (Brazil, Argentina, Colombia Rest of Latin America) |
Company Profiles | KYIQ MOUNTAIN, Orient Beverages Pvt. Ltd., Ten Spring Water, CG Roxane LLC, Nestle S.A., PepsiCo, Berrington Water, Primo Water Corporation, Bluetriton Brands, Bisleri, Himalayas ONTOP., Danone, Tata Consumer Products Limited |
Key Drivers | • Increasing health consciousness of spring water |
Market Challenges | • High Cost of Spring Water Bottle |
Ans: Spring Water Market is anticipated to expand by 8.2% from 2023 to 2030.
Ans: Spring Water Market size was valued at USD 223.9 billion in 2022.
Ans: The North American region dominated the Spring Water market in 2022.
Ans: Increasing the health consciousness of spring water are the drivers of the Spring Water Market.
Ans: Environmental concerns and Government regulations are the restraints of the Spring Water Market.
TABLE OF CONTENT
1. Introduction
1.1 Market Definition
1.2 Scope
1.3 Research Assumptions
2. Research Methodology
3. Market Dynamics
3.1 Drivers
3.2 Restraints
3.3 Opportunities
3.4 Challenges
4. Impact Analysis
4.1 Impact of Russia-Ukraine War
4.2 Impact of Ongoing Recession
4.3. Introduction
4.3.1 Impact on Major Economies
4.3.1.1 US
4.3.1.2 Canada
4.3.1.3 Germany
4.3.1.4 France
4.3.1.5 United Kingdom
4.3.1.6 China
4.3.1.7 Japan
4.3.1.8 South Korea
4.3.1.9 Rest of the World
5. Value Chain Analysis
6. Porter’s 5 forces model
7. PEST Analysis
8. Spring Water Market Segmentation, By Packaging
8.1 Bottled
8.2 Canned
9. Spring Water Market Segmentation, By Distribution Channel
9.1 Supermarkets/Hypermarkets
9.2 Convenience Stores
9.3 Online Stores
9.4 Other
10. Regional Analysis
10.1 Introduction
10.2 North America
10.2.1 North America Spring Water Market by Country
10.2.2 North America Spring Water Market by Packaging
10.2.3 North America Spring Water Market by Distribution Channel
10.2.4 USA
10.2.4.1 USA Spring Water Market by Packaging
10.2.4.2 USA Spring Water Market by Distribution Channel
10.2.5 Canada
10.2.5.1 Canada Spring Water Market by Packaging
10.2.5.2 Canada Spring Water Market by Distribution Channel
10.2.6 Mexico
10.2.6.1 Mexico Spring Water Market by Packaging
10.2.6.2 Mexico Spring Water Market by Distribution Channel
10.3 Europe
10.3.1 Eastern Europe
10.3.1.1 Eastern Europe Spring Water Market by Country
10.3.1.2 Eastern Europe Spring Water Market by Packaging
10.3.1.3 Eastern Europe Spring Water Market by Distribution Channel
10.3.1.4 Poland
10.3.1.4.1 Poland Spring Water Market by Packaging
10.3.1.4.2 Poland Spring Water Market by Distribution Channel
10.3.1.5 Romania
10.3.1.5.1 Romania Spring Water Market by Packaging
10.3.1.5.2 Romania Spring Water Market by Distribution Channel
10.3.1.6 Hungary
10.3.1.6.1 Hungary Spring Water Market by Packaging
10.3.1.6.2 Hungary Spring Water Market by Distribution Channel
10.3.1.7 Turkey
10.3.1.7.1 Turkey Spring Water Market by Packaging
10.3.1.7.2 Turkey Spring Water Market by Distribution Channel
10.3.1.8 Rest of Eastern Europe
10.3.1.8.1 Rest of Eastern Europe Spring Water Market by Packaging
10.3.1.8.2 Rest of Eastern Europe Spring Water Market by Distribution Channel
10.3.2 Western Europe
10.3.2.1 Western Europe Spring Water Market by Country
10.3.2.2 Western Europe Spring Water Market by Packaging
10.3.2.3 Western Europe Spring Water Market by Distribution Channel
10.3.2.4 Germany
10.3.2.4.1 Germany Spring Water Market by Packaging
10.3.2.4.2 Germany Spring Water Market by Distribution Channel
10.3.2.5 France
10.3.2.5.1 France Spring Water Market by Packaging
10.3.2.5.2 France Spring Water Market by Distribution Channel
10.3.2.6 UK
10.3.2.6.1 UK Spring Water Market by Packaging
10.3.2.6.2 UK Spring Water Market by Distribution Channel
10.3.2.7 Italy
10.3.2.7.1 Italy Spring Water Market by Packaging
10.3.2.7.2 Italy Spring Water Market by Distribution Channel
10.3.2.8 Spain
10.3.2.8.1 Spain Spring Water Market by Packaging
10.3.2.8.2 Spain Spring Water Market by Distribution Channel
10.3.2.9 Netherlands
10.3.2.9.1 Netherlands Spring Water Market by Packaging
10.3.2.9.2 Netherlands Spring Water Market by Distribution Channel
10.3.2.10 Switzerland
10.3.2.10.1 Switzerland Spring Water Market by Packaging
10.3.2.10.2 Switzerland Spring Water Market by Distribution Channel
10.3.2.11 Austria
10.3.2.11.1 Austria Spring Water Market by Packaging
10.3.2.11.2 Austria Spring Water Market by Distribution Channel
10.3.2.12 Rest of Western Europe
10.3.2.12.1 Rest of Western Europe Spring Water Market by Packaging
10.3.2.12.2 Rest of Western Europe Spring Water Market by Distribution Channel
10.4 Asia-Pacific
10.4.1 Asia Pacific Spring Water Market by Country
10.4.2 Asia Pacific Spring Water Market by Packaging
10.4.3 Asia Pacific Spring Water Market by Distribution Channel
10.4.4 China
10.4.4.1 China Spring Water Market by Packaging
10.4.4.2 China Spring Water Market by Distribution Channel
10.4.5 India
10.4.5.1 India Spring Water Market by Packaging
10.4.5.2 India Spring Water Market by Distribution Channel
10.4.6 Japan
10.4.6.1 Japan Spring Water Market by Packaging
10.4.6.2 Japan Spring Water Market by Distribution Channel
10.4.7 South Korea
10.4.7.1 South Korea Spring Water Market by Packaging
10.4.7.2 South Korea Spring Water Market by Distribution Channel
10.4.8 Vietnam
10.4.8.1 Vietnam Spring Water Market by Packaging
10.4.8.2 Vietnam Spring Water Market by Distribution Channel
10.4.9 Singapore
10.4.9.1 Singapore Spring Water Market by Packaging
10.4.9.2 Singapore Spring Water Market by Distribution Channel
10.4.10 Australia
10.4.10.1 Australia Spring Water Market by Packaging
10.4.10.2 Australia Spring Water Market by Distribution Channel
10.4.11 Rest of Asia-Pacific
10.4.11.1 Rest of Asia-Pacific Spring Water Market by Packaging
10.4.11.2 Rest of Asia-Pacific Spring Water Market by Distribution Channel
10.5 Middle East & Africa
10.5.1 Middle East
10.5.1.1 Middle East Spring Water Market by Country
10.5.1.2 Middle East Spring Water Market by Packaging
10.5.1.3 Middle East Spring Water Market by Distribution Channel
10.5.1.4 UAE
10.5.1.4.1 UAE Spring Water Market by Packaging
10.5.1.4.2 UAE Spring Water Market by Distribution Channel
10.5.1.5 Egypt
10.5.1.5.1 Egypt Spring Water Market by Packaging
10.5.1.5.2 Egypt Spring Water Market by Distribution Channel
10.5.1.6 Saudi Arabia
10.5.1.6.1 Saudi Arabia Spring Water Market by Packaging
10.5.1.6.2 Saudi Arabia Spring Water Market by Distribution Channel
10.5.1.7 Qatar
10.5.1.7.1 Qatar Spring Water Market by Packaging
10.5.1.7.2 Qatar Spring Water Market by Distribution Channel
10.5.1.8 Rest of Middle East
10.5.1.8.1 Rest of Middle East Spring Water Market by Packaging
10.5.1.8.2 Rest of Middle East Spring Water Market by Distribution Channel
10.5.2 Africa
10.5.2.1 Africa Spring Water Market by Country
10.5.2.2 Africa Spring Water Market by Packaging
10.5.2.3 Africa Spring Water Market by Distribution Channel
10.5.2.4 Nigeria
10.5.2.4.1 Nigeria Spring Water Market by Packaging
10.5.2.4.2 Nigeria Spring Water Market by Distribution Channel
10.5.2.5 South Africa
10.5.2.5.1 South Africa Spring Water Market by Packaging
10.5.2.5.2 South Africa Spring Water Market by Distribution Channel
10.5.2.6 Rest of Africa
10.5.2.6.1 Rest of Africa Spring Water Market by Packaging
10.5.2.6.2 Rest of Africa Spring Water Market by Distribution Channel
10.6 Latin America
10.6.1 Latin America Spring Water Market by Country
10.6.2 Latin America Spring Water Market by Packaging
10.6.3 Latin America Spring Water Market by Distribution Channel
10.6.4 Brazil
10.6.4.1 Brazil Spring Water Market by Packaging
10.6.4.2 Brazil Spring Water Market by Distribution Channel
10.6.5 Argentina
10.6.5.1 Argentina Spring Water Market by Packaging
10.6.5.2 Argentina Spring Water Market by Distribution Channel
10.6.6 Colombia
10.6.6.1 Colombia Spring Water Market by Packaging
10.6.6.2 Colombia Spring Water Market by Distribution Channel
10.6.7 Rest of Latin America
10.6.7.1 Rest of Latin America Spring Water Market by Packaging
10.6.7.2 Rest of Latin America Spring Water Market by Distribution Channel
11 Company Profile
11.1 Orient Beverages Pvt. Ltd.
11.1.1 Company Overview
11.1.2 Financials
11.1.3 Product/Services Offered
11.1.4 SWOT Analysis
11.1.5 The SNS View
11.2 CG Roxane LLC
11.2.1 Company Overview
11.2.2 Financials
11.2.3 Product/Services Offered
11.2.4 SWOT Analysis
11.2.5 The SNS View
11.3 Nestle S.A.
11.3.1 Company Overview
11.3.2 Financials
11.3.3 Product/Services Offered
11.3.4 SWOT Analysis
11.3.5 The SNS View
11.4 Bisleri
11.4 Company Overview
11.4.2 Financials
11.4.3 Product/Services Offered
11.4.4 SWOT Analysis
11.4.5 The SNS View
11.5 PepsiCo
11.5.1 Company Overview
11.5.2 Financials
11.5.3 Product/Services Offered
11.5.4 SWOT Analysis
11.5.5 The SNS View
11.6 Bluetriton Brands
11.6.1 Company Overview
11.6.2 Financials
11.6.3 Product/Services Offered
11.6.4 SWOT Analysis
11.6.5 The SNS View
11.7 Berrington Water
11.7.1 Company Overview
11.7.2 Financials
11.7.3 Product/Services Offered
11.7.4 SWOT Analysis
11.7.5 The SNS View
11.8 Ten Spring Water
11.8.1 Company Overview
11.8.2 Financials
11.8.3 Product/Services Offered
11.8.4 SWOT Analysis
11.8.5 The SNS View
11.9 Danone
11.9.1 Company Overview
11.9.2 Financials
11.9.3 Product/ Services Offered
11.9.4 SWOT Analysis
11.9.5 The SNS View
11.10 Tata Consumer Products Limited
11.10.1 Company Overview
11.10.2 Financials
11.10.3 Product/Services Offered
11.10.4 SWOT Analysis
11.10.5 The SNS View
11.11 Himalayas ONTOP
11.11.1 Company Overview
11.11.2 Financials
11.11.3 Product/Services Offered
11.11.4 SWOT Analysis
11.11.5 The SNS View
11.12 Primo Water Corporation
11.12.1 Company Overview
11.12.2 Financials
11.12.3 Product/Services Offered
11.12.4 SWOT Analysis
11.12.5 The SNS View
11.13 KYIQ MOUNTAIN
11.13.1 Company Overview
11.13.2 Financials
11.13.3 Product/Services Offered
11.13.4 SWOT Analysis
11.13.5 The SNS View
12. Competitive Landscape
12.1 Competitive Benchmarking
12.2 Market Share Analysis
12.3 Recent Developments
12.3.1 Industry News
12.3.2 Company News
12.3.3 Mergers & Acquisitions
13. USE Cases and Best Practices
14. Conclusion
An accurate research report requires proper strategizing as well as implementation. There are multiple factors involved in the completion of good and accurate research report and selecting the best methodology to compete the research is the toughest part. Since the research reports we provide play a crucial role in any company’s decision-making process, therefore we at SNS Insider always believe that we should choose the best method which gives us results closer to reality. This allows us to reach at a stage wherein we can provide our clients best and accurate investment to output ratio.
Each report that we prepare takes a timeframe of 350-400 business hours for production. Starting from the selection of titles through a couple of in-depth brain storming session to the final QC process before uploading our titles on our website we dedicate around 350 working hours. The titles are selected based on their current market cap and the foreseen CAGR and growth.
The 5 steps process:
Step 1: Secondary Research:
Secondary Research or Desk Research is as the name suggests is a research process wherein, we collect data through the readily available information. In this process we use various paid and unpaid databases which our team has access to and gather data through the same. This includes examining of listed companies’ annual reports, Journals, SEC filling etc. Apart from this our team has access to various associations across the globe across different industries. Lastly, we have exchange relationships with various university as well as individual libraries.
Step 2: Primary Research
When we talk about primary research, it is a type of study in which the researchers collect relevant data samples directly, rather than relying on previously collected data. This type of research is focused on gaining content specific facts that can be sued to solve specific problems. Since the collected data is fresh and first hand therefore it makes the study more accurate and genuine.
We at SNS Insider have divided Primary Research into 2 parts.
Part 1 wherein we interview the KOLs of major players as well as the upcoming ones across various geographic regions. This allows us to have their view over the market scenario and acts as an important tool to come closer to the accurate market numbers. As many as 45 paid and unpaid primary interviews are taken from both the demand and supply side of the industry to make sure we land at an accurate judgement and analysis of the market.
This step involves the triangulation of data wherein our team analyses the interview transcripts, online survey responses and observation of on filed participants. The below mentioned chart should give a better understanding of the part 1 of the primary interview.
Part 2: In this part of primary research the data collected via secondary research and the part 1 of the primary research is validated with the interviews from individual consultants and subject matter experts.
Consultants are those set of people who have at least 12 years of experience and expertise within the industry whereas Subject Matter Experts are those with at least 15 years of experience behind their back within the same space. The data with the help of two main processes i.e., FGDs (Focused Group Discussions) and IDs (Individual Discussions). This gives us a 3rd party nonbiased primary view of the market scenario making it a more dependable one while collation of the data pointers.
Step 3: Data Bank Validation
Once all the information is collected via primary and secondary sources, we run that information for data validation. At our intelligence centre our research heads track a lot of information related to the market which includes the quarterly reports, the daily stock prices, and other relevant information. Our data bank server gets updated every fortnight and that is how the information which we collected using our primary and secondary information is revalidated in real time.
Step 4: QA/QC Process
After all the data collection and validation our team does a final level of quality check and quality assurance to get rid of any unwanted or undesired mistakes. This might include but not limited to getting rid of the any typos, duplication of numbers or missing of any important information. The people involved in this process include technical content writers, research heads and graphics people. Once this process is completed the title gets uploader on our platform for our clients to read it.
Step 5: Final QC/QA Process:
This is the last process and comes when the client has ordered the study. In this process a final QA/QC is done before the study is emailed to the client. Since we believe in giving our clients a good experience of our research studies, therefore, to make sure that we do not lack at our end in any way humanly possible we do a final round of quality check and then dispatch the study to the client.
The Alternative Protein Market size was valued at USD 14.84 billion in 2023 and is expected to grow to USD 32.36 billion by 2032, with a growing at CAGR of 9.08% over the forecast period of 2024-2032.
The Industrial Sugar Market Size was esteemed at USD 30.94 billion out of 2022 and is supposed to arrive at USD 41.83 billion by 2030 and develop at a CAGR of 3.84% over the forecast period 2023-2030.
The Savory Ingredients Market Size was esteemed at USD 9.06 billion out of 2022 and is supposed to arrive at USD 16.72 billion by 2030 and develop at a CAGR of 7.95% over the forecast period 2023-2030.
The Commercial Seaweed Market was USD 21.03 billion by 2022 and is Expected to hit USD 52.78 billion by 2030, With CAGR of 12.2% by 2024-2031.
Industrial Starch Market Size was esteemed at USD 99.63 billion out of 2022 and is supposed to arrive at USD 179.02 billion by 2030, and develop at a CAGR of 7.6% over the forecast period 2023-2030.
Shrimp Market Report Scope & Overview: Shrimp Market
Hi! Click one of our member below to chat on Phone