Sports Technology Market Report Scope and Overview:
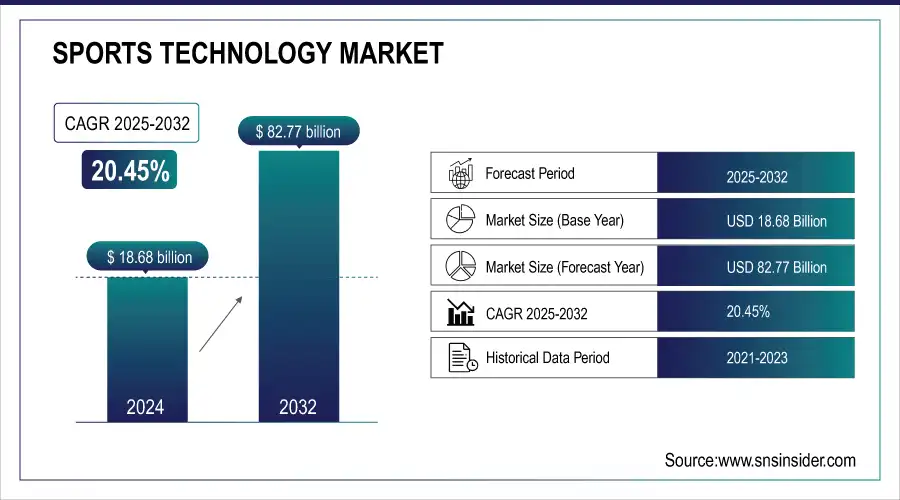
The Sports Technology Market Size was valued at USD 18.68 Billion in 2024 and is expected to reach USD 82.77 Billion by 2032 and grow at a CAGR of 20.45% over the forecast period 2025-2032.
The Sports Technology Market is experiencing significant growth, fueled by advancements in artificial intelligence and digital technologies, along with rising consumer engagement. AI plays a central role in transforming fan experiences, enhancing athlete safety, and boosting operational efficiency across the industry.
Get more information on Sports Technology Market - Request Sample Report
At the Paris 2024 Olympics, AI-powered systems will be employed to monitor social media interactions, ensuring a safer environment for athletes, while also optimizing event logistics through digital twinning of Olympic venues. These digital replicas will simulate various operational scenarios, such as power requirements and camera placements, to improve planning. AI is also revolutionizing broadcasting by offering personalized content through automated highlight generation and dynamic, multi-camera replays across 21 sports. Moreover, AI is improving athlete performance analysis with real-time motion tracking and biomechanical studies, providing valuable insights. The sports tech market benefits from the increasing popularity of e-sports, especially in Asia, with virtual sports and fitness tech gaining momentum. Fantasy sports, for example, have attracted 220 million users in India, with 70.5% reporting increased sports knowledge and viewing time, and 48% watching every game.
Sports Technology Market Size and Forecast:
-
Market Size in 2024: USD 18.68 Billion
-
Market Size by 2032: USD 82.77 Billion
-
CAGR (2025–2032): 20.45%
-
Base Year: 2024
-
Forecast Period: 2025–2032
-
Historical Data: 2021–2023
Sports Technology Market Highlights:
-
Rising investments in esports and digital platforms with Virtual Sports Platform Organization raising USD 265 million and Animoca Brands securing USD 120 million
-
Next-gen stadium experiences with venues like the Garden hosting up to 11,500 fans for hockey and basketball events
-
Wearables driving athlete safety and performance with devices like the WHOOP Strap, smart rings, and biometric sensors enabling real-time monitoring and injury prevention
-
AI and machine learning integration transforming talent scouting, training optimization, and injury prediction with personalized insights for athletes
-
Expanding role in fitness and health apps as wearable technology merges with virtual fitness programs and health applications reaching a global audience
-
Integration challenges remain a restraint as sports organizations face hurdles embedding new technologies into traditional systems requiring continuous upgrades and training
The growing interest in e-sports is also reflected in major funding, as platforms like Virtual Sports Platform Organization raised USD 265 million, and Animoca Brands, specializing in blockchain-based games, secured USD 120 million. Additionally, the Systems, Applications, and Products in Data Processing. Garden will host up to 11,500 fans for hockey and basketball events, further highlighting the expanding role of technology in enhancing fan engagement. The increasing integration of AI and machine learning in talent scouting, training, and performance analysis suggests that sportstech will continue to evolve, reshaping the industry’s landscape with more immersive experiences for both athletes and fans.
Sports Technology Market Drivers:
-
Transforming Athlete Performance and Safety Through Wearable Technology in Sportstech
Wearable technology is revolutionizing the sportstech market by significantly enhancing athlete safety, performance, and overall health monitoring. Devices like fitness trackers, smartwatches, and biometric sensors are now integral tools for athletes, offering real-time insights into crucial health metrics such as heart rate, sleep quality, and stress levels. These wearables enable precise monitoring of physical conditions during training, allowing athletes to optimize their performance and recovery cycles. Notably, during major events like the Tokyo 2020 Olympics, athletes utilized devices such as the WHOOP Strap to track recovery and manage strain, ensuring better performance management and injury prevention. Furthermore, the rise of AI-driven systems in wearables is transforming coaching methods, as AI analyzes collected data to offer personalized performance insights and predict potential injuries, fostering safer training environments. Innovations like smart rings and electronic tattoos are pushing the boundaries of wearable tech, making monitoring more discreet without compromising accuracy. These advancements are not only benefiting elite athletes but also reshaping the fitness industry, with wearables becoming key components in virtual fitness programs and health apps that appeal to a global audience. Moreover, wearable technology plays a crucial role in preventing injuries, with studies showing that a significant portion of pediatric overuse injuries are preventable. by providing early warnings of potential health issues, wearables allow for timely intervention, reducing the risk of overuse and non-contact injuries. As wearables continue to evolve, their ability to collect and analyze data will drive growth in the sportstech market, contributing to safer, more efficient training and competition environments.
Sports Technology Market Restraints:
-
Overcoming Integration Barriers to Unlock the Full Potential of Sports Technology
Overcoming integration challenges is essential for unlocking the full potential of sports technology, as many sports organizations struggle to seamlessly incorporate advanced technologies into existing systems. The complexity arises from the need to align new innovations, such as wearable devices, AI-driven analytics, and advanced tracking systems, with traditional sports infrastructure. This process often demands significant time, resources, and expertise to ensure compatibility and smooth functionality. As technologies rapidly evolve, maintaining an adaptive infrastructure becomes critical, and failure to do so can result in inefficiencies, data silos, or even reduced athlete performance and safety. Furthermore, the integration of AI, data analytics, and real-time monitoring systems requires continuous upgrades, training, and maintenance to fully leverage their benefits. Overcoming these barriers not only maximizes the utility of sports technologies but also accelerates their adoption, ultimately driving improved performance, better fan engagement, and safer environments for athletes.
Sports Technology Market Segment Analysis:
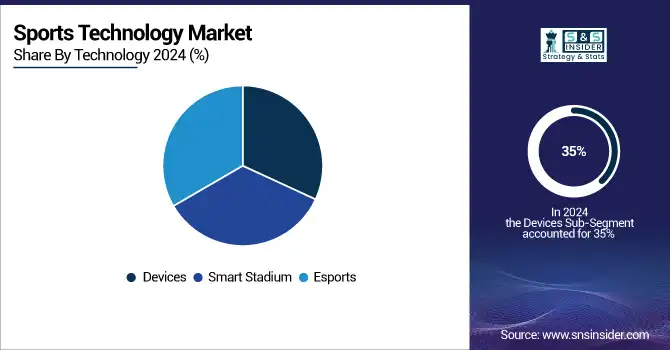
By Technology
In 2024, the Devices segment holds a dominant share of approximately 35% in the sport technology market. This growth is driven by the increasing demand for wearable devices, such as fitness trackers, smartwatches, and biometric sensors, which are becoming essential tools for athletes and fitness enthusiasts alike. These devices provide real-time data on various health metrics, including heart rate, sleep quality, and stress levels, enabling better performance tracking and recovery management. Furthermore, advancements in these technologies, such as the integration of AI for personalized insights and injury prevention, are driving their widespread adoption across both professional sports and recreational fitness. As consumer interest in health and fitness continues to rise, the Devices segment is expected to maintain its strong position in the sport technology market.
By End User
In 2024, the Sports Associations segment holds a dominant share of around 42% in the sport technology market. This is driven by the growing adoption of advanced sports technologies by professional sports leagues, clubs, and governing bodies to enhance performance, safety, and fan engagement. Sports associations are increasingly utilizing technologies such as AI-driven analytics, wearable devices, and performance monitoring tools to optimize athlete training, improve injury prevention, and make data-driven decisions. Additionally, these organizations are investing in technology to enhance broadcast experiences and fan interactions through virtual platforms and augmented reality. The increasing focus on performance optimization and the need for real-time data is fueling the dominance of sports associations in the sport technology market.
Sports Technology Market Regional Analysis:
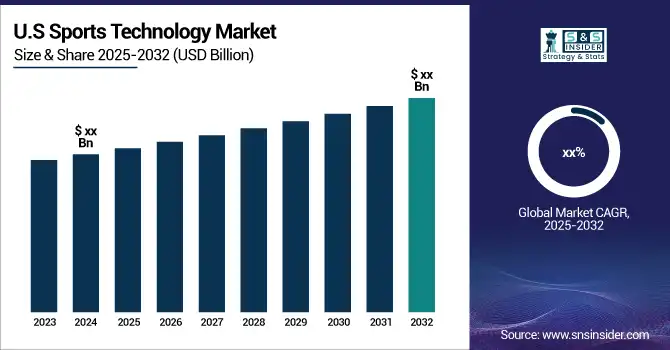
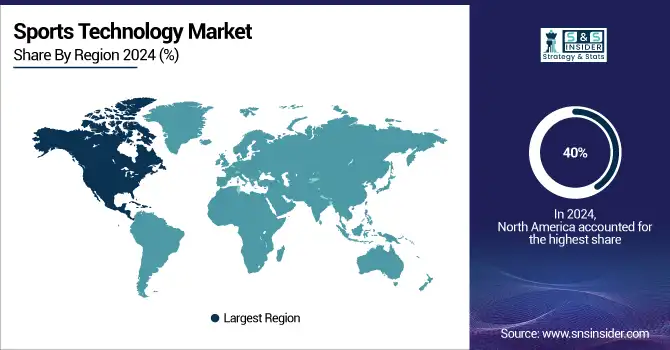
North America Sports Technology Market Trends:
In 2024, North America holds the largest share of the sport technology market, accounting for approximately 40% of the total revenue. The region’s dominance is driven by the high adoption of advanced technologies across the United States and Canada, where sports organizations and professionals are increasingly integrating AI, wearables, and performance analytics into training and competition. The United States, in particular, leads with significant investments in sports innovation, supported by major sports leagues like the NBA, NFL, and MLB, which have adopted cutting-edge technologies to enhance performance, improve player safety, and engage fans through immersive experiences. Canada is also witnessing growth, with a strong focus on wearable technology and AI-powered coaching tools. The presence of numerous tech companies and startups further accelerates the growth of sportstech in North America, positioning the region as a global leader in the market.
Get Customized Report as per your Business Requirement - Request For Customized Report
Europe Sports Technology Market Trends
In 2024, Europe represents a significant share of the sports technology market, supported by strong adoption in countries such as the United Kingdom, Germany, France, and Spain. European football (soccer) clubs are at the forefront of utilizing wearable devices, optical tracking, and AI-based analytics to improve player performance and reduce injury risks. Organizations like UEFA and domestic leagues have integrated technologies such as VAR (Video Assistant Referee) and Hawk-Eye to enhance decision-making accuracy. Germany and the UK are leading in research partnerships and sports innovation centers, driving cross-collaboration between universities, sports teams, and technology providers. In addition, the growing demand for fan engagement solutions, including AR/VR and data-driven broadcasting, is fueling regional growth.
Asia-Pacific Sports Technology Market Trends
Asia-Pacific is witnessing the fastest growth in the sports technology market, with countries such as China, Japan, India, South Korea, and Australia making major investments in AI, wearables, and smart stadium infrastructure. China is advancing rapidly in smart fitness platforms, esports, and fan engagement technologies, supported by strong government initiatives. Japan and South Korea are leveraging robotics, AR/VR, and analytics to enhance both traditional sports and esports ecosystems. India is emerging as a key market due to rising investments in cricket analytics, wearable devices, and grassroots sports technology adoption. Australia continues to innovate in athlete monitoring and performance wearables, particularly in rugby and cricket. This strong mix of tech adoption and sports culture positions Asia-Pacific as a powerhouse for future market expansion.
Latin America Sports Technology Market Trends
Latin America is experiencing steady growth in sports technology adoption, with Brazil, Mexico, and Argentina being key markets. Football dominates the region’s sports landscape, and clubs are increasingly implementing performance analytics, wearable devices, and fan engagement platforms. Brazil is leading with investments in advanced training tools and digital fan experiences, supported by its global football prominence. Mexico is showing increased adoption of sports broadcasting technologies and smart stadium solutions, while Argentina is focusing on data analytics and AI-based performance monitoring. Although the region faces budget constraints compared to North America and Europe, the growing presence of sports tech startups and partnerships with global providers are accelerating market penetration.
Middle East & Africa Sports Technology Market Trends
The Middle East & Africa region is emerging as a developing hub for sports technology, with growth driven by investments in world-class sports infrastructure and international events. Countries like the UAE, Qatar, and Saudi Arabia are at the forefront, integrating wearable devices, AI-based analytics, and smart stadium technologies to support football, athletics, and motorsports. Qatar’s hosting of the FIFA World Cup 2022 accelerated technology adoption in broadcasting, stadium operations, and fan engagement. Saudi Arabia’s Vision 2030 initiative is further boosting sports innovation and digital transformation. In Africa, South Africa and Nigeria are showing rising interest in wearable tech and performance monitoring tools, though adoption is still at an early stage. Overall, government backing and mega sporting events are fueling the region’s market growth.
Sports Technology Market Key Players:
-
Catapult Sports (Wearable GPS devices, athlete monitoring systems)
-
Zebra Technologies (Motion Works Sports Solution)
-
STATSports (Apex Athlete Series)
-
Hudl (Video analysis tools, sports performance platforms)
-
IBM (Watson AI for sports analytics)
-
SAP SE (SAP Sports One)
-
Stats Perform (Opta data, AI-driven sports analytics tools)
-
Hawk-Eye Innovations (Sony) (Hawk-Eye Vision System)
-
Second Spectrum (AI-powered video analytics)
-
Genius Sports (Data and technology services for sports leagues)
-
SportRadar (Sports data services, analytics platforms)
-
Whoop (WHOOP Strap)
-
Polar Electro (Heart rate monitors, wearable fitness trackers)
-
Fitbit (Google) (Fitness and activity trackers)
-
ChyronHego (TRACAB optical tracking system)
-
PlaySight Interactive (SmartCourt system)
-
ShotTracker (Real-time basketball analytics)
-
KINEXON (Wearable sensors, player tracking solutions)
-
Garmin (Forerunner GPS watches, fitness wearables)
-
Oracle (Oracle Cloud for sports analytics)
List of potential suppliers in the sports technology market across various domains:
1. Performance Analytics and Wearables
-
Catapult Sports (Wearable performance tracking systems)
-
STATSports (GPS-based player tracking)
-
WHOOP (Fitness and health monitoring wearables)
-
Polar (Heart rate monitors and sports watches)
-
Garmin (Fitness trackers and GPS devices)
2. Virtual Reality (VR) and Augmented Reality (AR)
-
STRIVR (Immersive VR training systems for athletes)
-
Beyond Sports (AR solutions for game analysis and fan engagement)
-
EON Reality (Sports AR/VR training platforms)
-
Rezzil (VR-based cognitive training for athletes)
-
VAR Live (AR/VR for fan experiences in stadiums)
3. Smart Stadium Solutions
-
Cisco Systems (Connected stadium technology and Wi-Fi solutions)
-
Daktronics (LED displays and scoreboards for stadiums)
-
NEC Corporation (Facial recognition and smart stadium security)
-
IBM (IoT solutions for crowd management and energy efficiency)
-
Johnson Controls (Building management systems for stadiums)
4. Data Analytics and AI Platforms
-
Opta Sports (Sports data and analytics)
-
Sportradar (Real-time sports data and betting solutions)
-
Second Spectrum (AI-driven player and game analytics)
-
Tableau (Data visualization tools for sports analytics)
-
SAP Sports One (Sports team management and analytics)
5. Esports and Gaming Technology
-
Razer (Gaming peripherals and devices)
-
HyperX (Esports hardware and accessories)
-
SteelSeries (Gaming headsets and keyboards)
-
Tobii (Eye-tracking technology for gaming)
-
Logitech G (Gaming equipment and software solutions)
6. Fan Engagement Platforms
-
Fanatics (Merchandising and e-commerce for sports fans)
-
Socios.com (Blockchain-based fan tokens)
-
Kiswe (Interactive live streaming for fans)
-
EngageRM (Fan relationship management solutions)
-
Pixellot (Automated sports video production for fan engagement)
7. Fitness and Training Equipment
-
Technogym (Fitness and strength training equipment)
-
Peloton (Connected fitness devices and virtual classes)
-
Tonal (AI-powered strength training machines)
-
Keiser (High-performance training equipment)
-
Fitbit (Wearable fitness devices)
8. Sports Equipment and Gear
-
Wilson Sporting Goods (Balls, racquets, and other sports gear)
-
Nike (Sportswear and gear)
-
Adidas (Footwear, apparel, and accessories)
-
Under Armour (Athletic performance gear)
-
Puma (Sports equipment and footwear)
9. Video and Motion Analysis
-
Hawk-Eye Innovations (Goal-line and ball tracking technology)
-
Dartfish (Sports video analysis software)
-
Hudl (Performance analysis for teams)
-
Coach's Eye (Video analysis for training)
-
PlaySight (Smart sports camera systems)
10. Rehabilitation and Recovery Technology
-
NormaTec (Compression recovery systems)
-
Hyperice (Percussion therapy and recovery devices)
-
Therabody (Percussive massage therapy devices)
-
Game Ready (Injury recovery systems)
-
Kinexon (Wearables for injury prevention and load management)
Sports Technology Market Competitive Landscape:
Catapult Sports, established in 2006 in Australia, is a leading provider of sports performance technology, specializing in wearable GPS devices, athlete monitoring systems, and analytics platforms. The company supports professional teams and athletes worldwide with data-driven insights to enhance performance, reduce injury risks, and optimize training efficiency across multiple sports disciplines.
-
October 30, 2024 – Catapult signed a deal with England’s Rugby Football Union, Premiership Rugby, and Premiership Women’s Rugby, becoming the preferred provider of athlete monitoring technology.
Zebra Technologies, established in 1969 in the United States, is a global leader in enterprise technology solutions, offering products such as the MotionWorks Sports Solution for real-time player and ball tracking. The company enables sports organizations to enhance performance analysis, fan engagement, and decision-making through advanced tracking and analytics tools.
-
March 25, 2024 – Zebra Technologies sponsored the NFL Health & Safety Summit, showcasing its RFID solutions to enhance player performance, injury prevention, and equipment tracking.
Hudl acquired StatsBomb in August 2024, merging StatsBomb’s advanced data analytics (football and American football) with Hudl’s video and analysis platform to offer deeper insights, streamlined workflows, and unified video-+-data solutions for teams and analysts worldwide.
-
August 12, 2024 – Hudl acquired StatsBomb, enhancing its professional sports solutions with advanced data analytics for football and American football teams, providing deeper insights for performance and recruitment.
The WNBA partnered with Genius Sports in 2021, making Genius Sports—established in 2001 in London—the league’s official data and technology partner. The collaboration provides real-time statistics, integrity services, and fan engagement tools, leveraging advanced data distribution and digital solutions to enhance the WNBA’s global reach and fan experiences.
-
March 5, 2024 – The WNBA partnered with Genius Sports' Second Spectrum to introduce 3D player and ball-tracking data leaguewide, enhancing strategic planning with advanced analytics for coaches and decision-makers.
| Report Attributes | Details |
|---|---|
| Market Size in 2024 | USD 18.68 Billion |
| Market Size by 2032 | USD 82.77 Billion |
| CAGR | CAGR of 20.45% From 2025 to 2032 |
| Base Year | 2024 |
| Forecast Period | 2025-2032 |
| Historical Data | 2021-2023 |
| Report Scope & Coverage | Market Size, Segments Analysis, Competitive Landscape, Regional Analysis, DROC & SWOT Analysis, Forecast Outlook |
| Key Segments | • By Type (Baseball, Cricket, Tennis, Rugby, Basketball, Ice Hockey, Soccer) • By Technology (Devices, Smart Stadium, E sports, Statistics & Analytics) • By End User ( Sports Clubs, Sports Associations, Sports Leagues, Others) |
| Regional Analysis/Coverage | North America (US, Canada), Europe (Germany, UK, France, Italy, Spain, Russia, Poland, Rest of Europe), Asia Pacific (China, India, Japan, South Korea, Australia, ASEAN Countries, Rest of Asia Pacific), Middle East & Africa (UAE, Saudi Arabia, Qatar, South Africa, Rest of Middle East & Africa), Latin America (Brazil, Argentina, Mexico, Colombia, Rest of Latin America). |
| Company Profiles | Catapult Sports, Zebra Technologies, STATSports, Hudl, IBM, SAP SE, Stats Perform, Hawk-Eye Innovations, Second Spectrum, Genius Sports, SportRadar, Whoop, Polar Electro, Fitbit, ChyronHego, PlaySight Interactive, ShotTracker, KINEXON, Garmin, and Oracle. |
