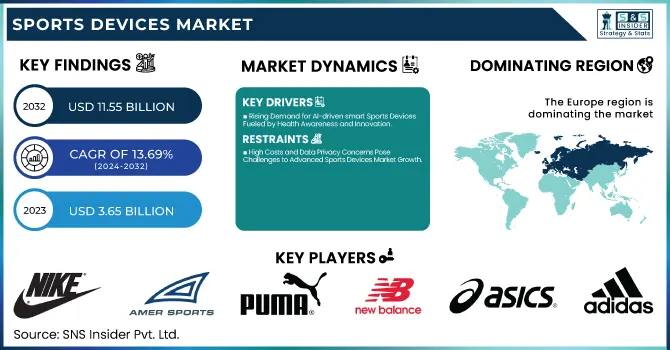
The Sports Devices Market Size was valued at USD 3.65 Billion in 2023 and is expected to reach USD 11.55 Billion by 2032 and grow at a CAGR of 13.69% over the forecast period 2024-2032. The sports devices market is experiencing continuous innovation buoyed by advancements in product capabilities, technological enhancements, and buoyant technology capabilities. Sports gadgets in current times present a greater degree of precision in measuring parameters such as heart rate, caloric intake, journey speed, and intensity, which expands user experience and workout efficiency.
To Get more information on Sports Devices Market - Request Free Sample Report
Ongoing advances in sensor technology, AI-driven insights, and IoT integration are making these solutions more functional and personalized. This drives manufacturers to upgrade product quality and reliability by providing durable designs complemented by extended battery life and seamless connectivity. The use of new technologies, such as biometric monitoring, smart textiles, and real-time data analytics, will continue to help performance optimization and injury prevention create a more personalized workout for each user.
Key Drivers:
Rising Demand for AI-driven smart Sports Devices Fueled by Health Awareness and Innovation
One of the factors supporting the demand for AI-driven smart sports devices includes the increasing awareness of consumers on health and fitness and the consequent adoption of smart sports & fitness devices such as fitness trackers, smartwatches, and performance monitoring equipment. Demand continues to grow on the back of trends like personalized workout routines and wearable technology. Moreover, improvements in sensors and data analytics have made it possible to track metrics such as heart rate, calories burnt, and movement patterns, adding to the overall user experience and performance feedback. With the increasing applications of IoT (Internet of Things) in sports gadgets, connectivity features are enhanced, from easy pairing to automatic sync with smartphones and fitness apps. Moreover, growing interest in professional sports and a rise in sports infrastructure development are anticipated to further fuel the growth of the market in the coming years.
Restrain:
High Costs and Data Privacy Concerns Pose Challenges to Advanced Sports Devices Market Growth
The cost factor in advanced sports devices is one of the main challenges, making it difficult for budget-savvy customers to purchase devices. High pricing of premium devices integrated with new advanced technologies like AI, IoT, and biometric features limit market penetration in a developing region. Furthermore, data privacy and security issues have also become some of the biggest obstacles. While sports devices collect sensitive user data, such as heart rate, location, and workout patterns, a cyberattack or data breach is a real possibility, making consumers hesitate.
Opportunity:
AI Integration and VR Solutions Drive Innovation in Sustainable and Fitness Focused Sports Devices
The biggest potential for the integration of artificial intelligence (AI) and machine learning (ML) into sports devices is to use predictive analytics to reduce injuries, improve performances, and provide tailored training advice. E-sports and new virtual reality (VR) training solutions also open up new opportunities for innovation. In addition, the increase in the popularity of environmental and sustainable sports instruments gives gain to manufacturers. Popularity Of Fitness Activities–Increasing disposable income coupled with lesser interest of the population in fitness activities, especially in emerging markets have made them lucrative prospects.
Challenges:
Lack of Standardization and Battery Limitations Challenge Growth in Sports Devices Market Expansion
The absence of standardization in devices and platforms is another critical challenge in the sports devices market. An unholy combination of proprietary software and hardware from different brands often spells havoc, creating compatibility problems for users who merely wish to connect their devices with other gadgets and fitness apps seamlessly. And more importantly, battery life limitations in wearable devices are still a problem for athletes that need to track for longer periods. It also struggles a lot to access rural areas with barriers in the form of awareness and affordability. To tackle these challenges, industry participants are innovating cost-effective solutions, promoting a rise in data encryption, and developing seamless battery solutions to strengthen market growth and attain maximum adoption.
By Component
In 2023, hardware was the dominant segment with a share of 59.8% in the sports devices market, fueled by the adoption of fitness trackers, smartwatches, and performance monitoring equipment, as reflected in a recent report by, Techsci Research. The rising popularity of professional sports training combined with improved wearable technologies was another major factor in the high market share of hardware. Demand for hardware-based tools was further driven by increasing consumer interest in tracking performance and health in real-time.
The software segment is to grow the fastest CAGR between 2024 to 2032. This boom is due to the seepage of AI, ML, and data analytics in sports applications. Software solutions are providing better user experiences through personalization that incorporates training insights, injury prevention, and performance optimization into one easy platform. Software segment growth will also be propelled by the rising adoption of interactive fitness apps and virtual coaching platforms.
By Device
The digital signage segment held the largest share in the sports devices market in 2023 at 33.9% share, as the segment is widely used in stadiums, fitness centers, and sports events. Digital signage solutions are an integral part of increasing audience engagement, delivering real-time updates and information like scores, ads, player statistics, etc. The proliferation of new interactive displays and sophisticated content management systems was also key to its proliferation.
The wearables segment is expected to record the fastest CAGR from 2024-2032. This increase is driven by consumer demand for fitness trackers, smartwatches, and smart clothing to measure health and performance metrics. From developing biometric sensors, and AI-based insights to offering personalized fitness solutions the continuous innovations in wearable sports devices are also speeding up their adoption, which makes it one of the leadership forces of future market growth.
By Deployment
In 2023, the on-premise segment accounted for 59.6% of the market share in the sports devices market due to its high security, heightened control of data, and reliability. The on-premise solution is a part of the top sports technology trends as it is preferred by several sports organizations, stadiums, and fitness centers needing real-time data processing and higher privacy. These solutions are more customized and the control over data is stronger, which truly is a perfect fit for the management of large-scale sports events and training programs.
The cloud segment is anticipated to experience the highest CAGR from 2024-2032. Cloud adoption has been increasing, driven by the need for scalable, flexible, and cost-effective solutions. The cloud-based platforms allow easy data access from anywhere, and enable remote monitoring and real-time analytics, resulting in better performance tracking of athletes and improved fan engagement. The increasing investment in AI-enabled sports analytics and fitness applications continues to propel the cloud in the sports devices market.
By Sport
In 2023, football was the largest segment in the sports devices market with a market share of 22.6%. The scale of this dominance was a direct result of the international appeal of the sport, especially in parts of the world like Europe, North America, and South America. Advanced performance tracking devices, GPS-enabled wearables, and video analysis tools are widely exploited in football to monitor athletes' performances, prevent injuries, and devise effective strategies. Moreover, increasing investment in football leagues and clubs also bolstered this segment’s growth.
Cricket will grow with the fastest CAGR from 2024-2032, mainly due to the increased number of fans worldwide and the technology adopted for training and match analysis. Demand for cricket smart wearables for performance monitoring, injury prevention, and recovery is driving growth in smart cricket gear of different types, including motion sensors and video analytics.
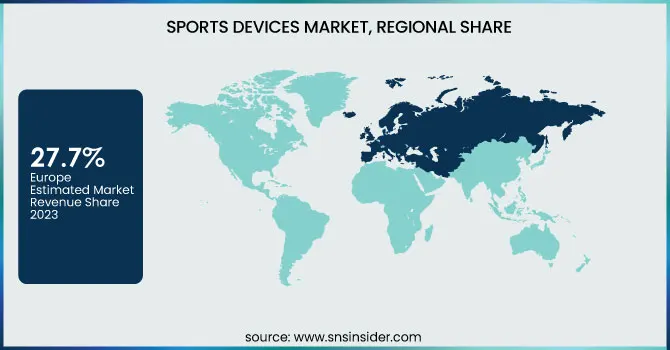
Europe held the major share in the sports devices market with a 27.7% share in 2023 This expansion was mainly due to the region's sports culture and infrastructure, coupled with a growing adoption of smart sports technology. Germany, the UK, and France have made significant investments into championship leagues, particularly in professional sports, leading to an increased demand for performance-tracking devices and digital signage within stadiums. Take, again, Premier League, in which clubs splash on using GPS trackers, heart rate monitors, and video analytics for improved performance and reduced injury risk. Likewise, the Tour de France makes use of advanced fitness wearables and data-driven insights into how athletes cope with endurance factors of the body, which allows them to devise the best strategies for accomplishing the racing event.
Middle East & Africa region held the fastest CAGR throughout 2024-2032 owing to increasing investment for sports infrastructure and increasing penetration of fitness activities. Qatar with FIFA World Cup 2022, Saudi Arabia with golf tournaments, and UAE with Dubai Fitness Challenge are among the countries promoting sports these days. Furthermore, increasing usage of smart wearables and real-time tracking devices among sports facilities in this area to boost athlete performance and offer fitness enthusiasts a seamless experience is further accelerating the demand for smart sports market expansion.
Get Customized Report as per Your Business Requirement - Enquiry Now
Some of the major players in the Sports Devices Market are:
Nike (Air Max Sneakers)
Adidas (Predator Football Boots)
Amer Sports (Salomon XT-6 Trail Shoes)
Puma (Future Z Football Boots)
Under Armour (Curry Basketball Shoes)
New Balance (990v5 Running Shoes)
Lululemon Athletica (Align Yoga Pants)
Athleta (Salutation Stash Pocket Tights)
Avery Dennison (Embelex Branding Solutions)
Asics (Gel-Kayano Running Shoes)
Technogym (MyRun Treadmill)
Salomon Group (Speedcross Trail Running Shoes)
Butterfly (Tenergy Table Tennis Rubbers)
Decathlon (Quechua Tents)
Net World Sports (FORZA Football Goals)
In July 2024, Nike and Hyperice unveiled a revolutionary wearable device combining performance tracking with recovery technology, offering real-time insights and enhanced muscle recovery for athletes.
In November 2024, Accenture teamed up with PUMA India to create an advanced supply chain network, leveraging digital technologies to enhance efficiency, inventory management, and customer experience.
| Report Attributes | Details |
|---|---|
| Market Size in 2023 | USD 3.65 Billion |
| Market Size by 2032 | USD 11.55 Billion |
| CAGR | CAGR of 13.69% From 2024 to 2032 |
| Base Year | 2023 |
| Forecast Period | 2024-2032 |
| Historical Data | 2020-2022 |
| Report Scope & Coverage | Market Size, Segments Analysis, Competitive Landscape, Regional Analysis, DROC & SWOT Analysis, Forecast Outlook |
| Key Segments | • By Component (Hardware, Software,) • By Device (Wearables, Digital Signage, Camera) • By Deployment (On-premise, Cloud) • By Sport (Football, Cricket, Baseball, Basketball, Rugby, Others) |
| Regional Analysis/Coverage | North America (US, Canada, Mexico), Europe (Eastern Europe [Poland, Romania, Hungary, Turkey, Rest of Eastern Europe] Western Europe] Germany, France, UK, Italy, Spain, Netherlands, Switzerland, Austria, Rest of Western Europe]), Asia Pacific (China, India, Japan, South Korea, Vietnam, Singapore, Australia, Rest of Asia Pacific), Middle East & Africa (Middle East [UAE, Egypt, Saudi Arabia, Qatar, Rest of Middle East], Africa [Nigeria, South Africa, Rest of Africa], Latin America (Brazil, Argentina, Colombia, Rest of Latin America) |
| Company Profiles | Nike, Adidas, Amer Sports, Puma, Under Armour, New Balance, Lululemon Athletica, Athleta, Avery Dennison, Asics, Technogym, Salomon Group, Butterfly, Decathlon, Net World Sports. |
Ans: The Sports Devices Market is expected to grow at a CAGR of 13.69%.
Ans: Sports Devices Market size was USD 3.65 billion in 2023 and is expected to Reach USD 11.55 billion by 2032.
Ans: The major key drivers for the growth of the sports devices market include rising health awareness, increasing adoption of wearable technology, advancements in sensor technology, and growing demand for performance-tracking solutions.
Ans: The Hardware segment dominated the Sports Devices Market in 2023.
Ans: In 2023, the Europe region led the Sports Devices market, capturing approximately 27.76% of the total market share.
1. Introduction
1.1 Market Definition
1.2 Scope (Inclusion and Exclusions)
1.3 Research Assumptions
2. Executive Summary
2.1 Market Overview
2.2 Regional Synopsis
2.3 Competitive Summary
3. Research Methodology
3.1 Top-Down Approach
3.2 Bottom-up Approach
3.3. Data Validation
3.4 Primary Interviews
4. Market Dynamics Impact Analysis
4.1 Market Driving Factors Analysis
4.1.1 Drivers
4.1.2 Restraints
4.1.3 Opportunities
4.1.4 Challenges
4.2 PESTLE Analysis
4.3 Porter’s Five Forces Model
5. Statistical Insights and Trends Reporting
5.1 Product Performance & Adoption
5.2 Innovation & Technological
5.3 Product Quality & Reliability
5.4 Emerging Technology Integration
6. Competitive Landscape
6.1 List of Major Companies, By Region
6.2 Market Share Analysis, By Region
6.3 Product Benchmarking
6.3.1 Product specifications and features
6.3.2 Pricing
6.4 Strategic Initiatives
6.4.1 Marketing and promotional activities
6.4.2 Distribution and Supply Chain Strategies
6.4.3 Expansion plans and new product launches
6.4.4 Strategic partnerships and collaborations
6.5 Technological Advancements
6.6 Market Positioning and Branding
7. Sports Devices Market Segmentation, By Component
7.1 Chapter Overview
7.2 Hardware
7.2.1 Hardware Market Trends Analysis (2020-2032)
7.2.2 Hardware Market Size Estimates and Forecasts to 2032 (USD Billion)
7.3 Software
7.3.1 Software Market Trends Analysis (2020-2032)
7.3.2 Software Market Size Estimates and Forecasts to 2032 (USD Billion)
8. Sports Devices Market Segmentation, By Device
8.1 Chapter Overview
8.2 Wearables
8.2.1 Wearables Market Trends Analysis (2020-2032)
8.2.2 Wearables Market Size Estimates and Forecasts to 2032 (USD Billion)
8.3 Digital Signage
8.3.1 Digital Signage Market Trends Analysis (2020-2032)
8.3.2 Digital Signage Market Size Estimates and Forecasts to 2032 (USD Billion)
8.4 Camera
8.4.1 Camera Market Trends Analysis (2020-2032)
8.4.2 Camera Market Size Estimates and Forecasts to 2032 (USD Billion)
9. Sports Devices Market Segmentation, By Deployment
9.1 Chapter Overview
9.2 On-premise
9.2.1 On-premise Market Trends Analysis (2020-2032)
9.2.2 On-premise Market Size Estimates and Forecasts to 2032 (USD Billion)
9.3 Cloud
9.3.1 Cloud Market Trends Analysis (2020-2032)
9.3.2 Cloud Market Size Estimates and Forecasts to 2032 (USD Billion)
10. Sports Devices Market Segmentation, By Sport
10.1 Chapter Overview
10.2 Football
10.2.1 Football Market Trends Analysis (2020-2032)
10.2.2 Football Market Size Estimates and Forecasts to 2032 (USD Billion)
10.3 Cricket
10.3.1 Cricket Market Trends Analysis (2020-2032)
10.3.2 Cricket Market Size Estimates and Forecasts to 2032 (USD Billion)
10.4 Baseball
10.4.1 Baseball Market Trends Analysis (2020-2032)
10.4.2 Baseball Market Size Estimates and Forecasts to 2032 (USD Billion)
10.5 Basketball
10.5.1 Basketball Market Trends Analysis (2020-2032)
10.5.2 Basketball Market Size Estimates and Forecasts to 2032 (USD Billion)
10.6 Rugby
10.6.1 Rugby Market Trends Analysis (2020-2032)
10.6.2 Rugby Market Size Estimates and Forecasts to 2032 (USD Billion)
10.7 Others
10.7.1 Others Market Trends Analysis (2020-2032)
10.7.2 Others Market Size Estimates and Forecasts to 2032 (USD Billion)
11. Regional Analysis
11.1 Chapter Overview
11.2 North America
11.2.1 Trends Analysis
11.2.2 North America Sports Devices Market Estimates and Forecasts, by Country (2020-2032) (USD Billion)
11.2.3 North America Sports Devices Market Estimates and Forecasts, By Component (2020-2032) (USD Billion)
11.2.4 North America Sports Devices Market Estimates and Forecasts, By Device (2020-2032) (USD Billion)
11.2.5 North America Sports Devices Market Estimates and Forecasts, By Deployment (2020-2032) (USD Billion)
11.2.6 North America Sports Devices Market Estimates and Forecasts, By Sport (2020-2032) (USD Billion)
11.2.7 USA
11.2.7.1 USA Sports Devices Market Estimates and Forecasts, By Component (2020-2032) (USD Billion)
11.2.7.2 USA Sports Devices Market Estimates and Forecasts, By Device (2020-2032) (USD Billion)
11.2.7.3 USA Sports Devices Market Estimates and Forecasts, By Deployment (2020-2032) (USD Billion)
11.2.7.4 USA Sports Devices Market Estimates and Forecasts, By Sport (2020-2032) (USD Billion)
11.2.8 Canada
11.2.8.1 Canada Sports Devices Market Estimates and Forecasts, By Component (2020-2032) (USD Billion)
11.2.8.2 Canada Sports Devices Market Estimates and Forecasts, By Device (2020-2032) (USD Billion)
11.2.8.3 Canada Sports Devices Market Estimates and Forecasts, By Deployment (2020-2032) (USD Billion)
11.2.8.4 Canada Sports Devices Market Estimates and Forecasts, By Sport (2020-2032) (USD Billion)
11.2.9 Mexico
11.2.9.1 Mexico Sports Devices Market Estimates and Forecasts, By Component (2020-2032) (USD Billion)
11.2.9.2 Mexico Sports Devices Market Estimates and Forecasts, By Device (2020-2032) (USD Billion)
11.2.9.3 Mexico Sports Devices Market Estimates and Forecasts, By Deployment (2020-2032) (USD Billion)
11.2.9.4 Mexico Sports Devices Market Estimates and Forecasts, By Sport (2020-2032) (USD Billion)
11.3 Europe
11.3.1 Eastern Europe
11.3.1.1 Trends Analysis
11.3.1.2 Eastern Europe Sports Devices Market Estimates and Forecasts, by Country (2020-2032) (USD Billion)
11.3.1.3 Eastern Europe Sports Devices Market Estimates and Forecasts, By Component (2020-2032) (USD Billion)
11.3.1.4 Eastern Europe Sports Devices Market Estimates and Forecasts, By Device (2020-2032) (USD Billion)
11.3.1.5 Eastern Europe Sports Devices Market Estimates and Forecasts, By Deployment (2020-2032) (USD Billion)
11.3.1.6 Eastern Europe Sports Devices Market Estimates and Forecasts, By Sport (2020-2032) (USD Billion)
11.3.1.7 Poland
11.3.1.7.1 Poland Sports Devices Market Estimates and Forecasts, By Component (2020-2032) (USD Billion)
11.3.1.7.2 Poland Sports Devices Market Estimates and Forecasts, By Device (2020-2032) (USD Billion)
11.3.1.7.3 Poland Sports Devices Market Estimates and Forecasts, By Deployment (2020-2032) (USD Billion)
11.3.1.7.4 Poland Sports Devices Market Estimates and Forecasts, By Sport (2020-2032) (USD Billion)
11.3.1.8 Romania
11.3.1.8.1 Romania Sports Devices Market Estimates and Forecasts, By Component (2020-2032) (USD Billion)
11.3.1.8.2 Romania Sports Devices Market Estimates and Forecasts, By Device (2020-2032) (USD Billion)
11.3.1.8.3 Romania Sports Devices Market Estimates and Forecasts, By Deployment (2020-2032) (USD Billion)
11.3.1.8.4 Romania Sports Devices Market Estimates and Forecasts, By Sport (2020-2032) (USD Billion)
11.3.1.9 Hungary
11.3.1.9.1 Hungary Sports Devices Market Estimates and Forecasts, By Component (2020-2032) (USD Billion)
11.3.1.9.2 Hungary Sports Devices Market Estimates and Forecasts, By Device (2020-2032) (USD Billion)
11.3.1.9.3 Hungary Sports Devices Market Estimates and Forecasts, By Deployment (2020-2032) (USD Billion)
11.3.1.9.4 Hungary Sports Devices Market Estimates and Forecasts, By Sport (2020-2032) (USD Billion)
11.3.1.10 Turkey
11.3.1.10.1 Turkey Sports Devices Market Estimates and Forecasts, By Component (2020-2032) (USD Billion)
11.3.1.10.2 Turkey Sports Devices Market Estimates and Forecasts, By Device (2020-2032) (USD Billion)
11.3.1.10.3 Turkey Sports Devices Market Estimates and Forecasts, By Deployment (2020-2032) (USD Billion)
11.3.1.10.4 Turkey Sports Devices Market Estimates and Forecasts, By Sport (2020-2032) (USD Billion)
11.3.1.11 Rest of Eastern Europe
11.3.1.11.1 Rest of Eastern Europe Sports Devices Market Estimates and Forecasts, By Component (2020-2032) (USD Billion)
11.3.1.11.2 Rest of Eastern Europe Sports Devices Market Estimates and Forecasts, By Device (2020-2032) (USD Billion)
11.3.1.11.3 Rest of Eastern Europe Sports Devices Market Estimates and Forecasts, By Deployment (2020-2032) (USD Billion)
11.3.1.11.4 Rest of Eastern Europe Sports Devices Market Estimates and Forecasts, By Sport (2020-2032) (USD Billion)
11.3.2 Western Europe
11.3.2.1 Trends Analysis
11.3.2.2 Western Europe Sports Devices Market Estimates and Forecasts, by Country (2020-2032) (USD Billion)
11.3.2.3 Western Europe Sports Devices Market Estimates and Forecasts, By Component (2020-2032) (USD Billion)
11.3.2.4 Western Europe Sports Devices Market Estimates and Forecasts, By Device (2020-2032) (USD Billion)
11.3.2.5 Western Europe Sports Devices Market Estimates and Forecasts, By Deployment (2020-2032) (USD Billion)
11.3.2.6 Western Europe Sports Devices Market Estimates and Forecasts, By Sport (2020-2032) (USD Billion)
11.3.2.7 Germany
11.3.2.7.1 Germany Sports Devices Market Estimates and Forecasts, By Component (2020-2032) (USD Billion)
11.3.2.7.2 Germany Sports Devices Market Estimates and Forecasts, By Device (2020-2032) (USD Billion)
11.3.2.7.3 Germany Sports Devices Market Estimates and Forecasts, By Deployment (2020-2032) (USD Billion)
11.3.2.7.4 Germany Sports Devices Market Estimates and Forecasts, By Sport (2020-2032) (USD Billion)
11.3.2.8 France
11.3.2.8.1 France Sports Devices Market Estimates and Forecasts, By Component (2020-2032) (USD Billion)
11.3.2.8.2 France Sports Devices Market Estimates and Forecasts, By Device (2020-2032) (USD Billion)
11.3.2.8.3 France Sports Devices Market Estimates and Forecasts, By Deployment (2020-2032) (USD Billion)
11.3.2.8.4 France Sports Devices Market Estimates and Forecasts, By Sport (2020-2032) (USD Billion)
11.3.2.9 UK
11.3.2.9.1 UK Sports Devices Market Estimates and Forecasts, By Component (2020-2032) (USD Billion)
11.3.2.9.2 UK Sports Devices Market Estimates and Forecasts, By Device (2020-2032) (USD Billion)
11.3.2.9.3 UK Sports Devices Market Estimates and Forecasts, By Deployment (2020-2032) (USD Billion)
11.3.2.9.4 UK Sports Devices Market Estimates and Forecasts, By Sport (2020-2032) (USD Billion)
11.3.2.10 Italy
11.3.2.10.1 Italy Sports Devices Market Estimates and Forecasts, By Component (2020-2032) (USD Billion)
11.3.2.10.2 Italy Sports Devices Market Estimates and Forecasts, By Device (2020-2032) (USD Billion)
11.3.2.10.3 Italy Sports Devices Market Estimates and Forecasts, By Deployment (2020-2032) (USD Billion)
11.3.2.10.4 Italy Sports Devices Market Estimates and Forecasts, By Sport (2020-2032) (USD Billion)
11.3.2.11 Spain
11.3.2.11.1 Spain Sports Devices Market Estimates and Forecasts, By Component (2020-2032) (USD Billion)
11.3.2.11.2 Spain Sports Devices Market Estimates and Forecasts, By Device (2020-2032) (USD Billion)
11.3.2.11.3 Spain Sports Devices Market Estimates and Forecasts, By Deployment (2020-2032) (USD Billion)
11.3.2.11.4 Spain Sports Devices Market Estimates and Forecasts, By Sport (2020-2032) (USD Billion)
11.3.2.12 Netherlands
11.3.2.12.1 Netherlands Sports Devices Market Estimates and Forecasts, By Component (2020-2032) (USD Billion)
11.3.2.12.2 Netherlands Sports Devices Market Estimates and Forecasts, By Device (2020-2032) (USD Billion)
11.3.2.12.3 Netherlands Sports Devices Market Estimates and Forecasts, By Deployment (2020-2032) (USD Billion)
11.3.2.12.4 Netherlands Sports Devices Market Estimates and Forecasts, By Sport (2020-2032) (USD Billion)
11.3.2.13 Switzerland
11.3.2.13.1 Switzerland Sports Devices Market Estimates and Forecasts, By Component (2020-2032) (USD Billion)
11.3.2.13.2 Switzerland Sports Devices Market Estimates and Forecasts, By Device (2020-2032) (USD Billion)
11.3.2.13.3 Switzerland Sports Devices Market Estimates and Forecasts, By Deployment (2020-2032) (USD Billion)
11.3.2.13.4 Switzerland Sports Devices Market Estimates and Forecasts, By Sport (2020-2032) (USD Billion)
11.3.2.14 Austria
11.3.2.14.1 Austria Sports Devices Market Estimates and Forecasts, By Component (2020-2032) (USD Billion)
11.3.2.14.2 Austria Sports Devices Market Estimates and Forecasts, By Device (2020-2032) (USD Billion)
11.3.2.14.3 Austria Sports Devices Market Estimates and Forecasts, By Deployment (2020-2032) (USD Billion)
11.3.2.14.4 Austria Sports Devices Market Estimates and Forecasts, By Sport (2020-2032) (USD Billion)
11.3.2.15 Rest of Western Europe
11.3.2.15.1 Rest of Western Europe Sports Devices Market Estimates and Forecasts, By Component (2020-2032) (USD Billion)
11.3.2.15.2 Rest of Western Europe Sports Devices Market Estimates and Forecasts, By Device (2020-2032) (USD Billion)
11.3.2.15.3 Rest of Western Europe Sports Devices Market Estimates and Forecasts, By Deployment (2020-2032) (USD Billion)
11.3.2.15.4 Rest of Western Europe Sports Devices Market Estimates and Forecasts, By Sport (2020-2032) (USD Billion)
11.4 Asia-Pacific
11.4.1 Trends Analysis
11.4.2 Asia-Pacific Sports Devices Market Estimates and Forecasts, by Country (2020-2032) (USD Billion)
11.4.3 Asia-Pacific Sports Devices Market Estimates and Forecasts, By Component (2020-2032) (USD Billion)
11.4.4 Asia-Pacific Sports Devices Market Estimates and Forecasts, By Device (2020-2032) (USD Billion)
11.4.5 Asia-Pacific Sports Devices Market Estimates and Forecasts, By Deployment (2020-2032) (USD Billion)
11.4.6 Asia-Pacific Sports Devices Market Estimates and Forecasts, By Sport (2020-2032) (USD Billion)
11.4.7 China
11.4.7.1 China Sports Devices Market Estimates and Forecasts, By Component (2020-2032) (USD Billion)
11.4.7.2 China Sports Devices Market Estimates and Forecasts, By Device (2020-2032) (USD Billion)
11.4.7.3 China Sports Devices Market Estimates and Forecasts, By Deployment (2020-2032) (USD Billion)
11.4.7.4 China Sports Devices Market Estimates and Forecasts, By Sport (2020-2032) (USD Billion)
11.4.8 India
11.4.8.1 India Sports Devices Market Estimates and Forecasts, By Component (2020-2032) (USD Billion)
11.4.8.2 India Sports Devices Market Estimates and Forecasts, By Device (2020-2032) (USD Billion)
11.4.8.3 India Sports Devices Market Estimates and Forecasts, By Deployment (2020-2032) (USD Billion)
11.4.8.4 India Sports Devices Market Estimates and Forecasts, By Sport (2020-2032) (USD Billion)
11.4.9 Japan
11.4.9.1 Japan Sports Devices Market Estimates and Forecasts, By Component (2020-2032) (USD Billion)
11.4.9.2 Japan Sports Devices Market Estimates and Forecasts, By Device (2020-2032) (USD Billion)
11.4.9.3 Japan Sports Devices Market Estimates and Forecasts, By Deployment (2020-2032) (USD Billion)
11.4.9.4 Japan Sports Devices Market Estimates and Forecasts, By Sport (2020-2032) (USD Billion)
11.4.10 South Korea
11.4.10.1 South Korea Sports Devices Market Estimates and Forecasts, By Component (2020-2032) (USD Billion)
11.4.10.2 South Korea Sports Devices Market Estimates and Forecasts, By Device (2020-2032) (USD Billion)
11.4.10.3 South Korea Sports Devices Market Estimates and Forecasts, By Deployment (2020-2032) (USD Billion)
11.4.10.4 South Korea Sports Devices Market Estimates and Forecasts, By Sport (2020-2032) (USD Billion)
11.4.11 Vietnam
11.4.11.1 Vietnam Sports Devices Market Estimates and Forecasts, By Component (2020-2032) (USD Billion)
11.4.11.2 Vietnam Sports Devices Market Estimates and Forecasts, By Device (2020-2032) (USD Billion)
11.4.11.3 Vietnam Sports Devices Market Estimates and Forecasts, By Deployment (2020-2032) (USD Billion)
11.4.11.4 Vietnam Sports Devices Market Estimates and Forecasts, By Sport (2020-2032) (USD Billion)
11.4.12 Singapore
11.4.12.1 Singapore Sports Devices Market Estimates and Forecasts, By Component (2020-2032) (USD Billion)
11.4.12.2 Singapore Sports Devices Market Estimates and Forecasts, By Device (2020-2032) (USD Billion)
11.4.12.3 Singapore Sports Devices Market Estimates and Forecasts, By Deployment (2020-2032) (USD Billion)
11.4.12.4 Singapore Sports Devices Market Estimates and Forecasts, By Sport (2020-2032) (USD Billion)
11.4.13 Australia
11.4.13.1 Australia Sports Devices Market Estimates and Forecasts, By Component (2020-2032) (USD Billion)
11.4.13.2 Australia Sports Devices Market Estimates and Forecasts, By Device (2020-2032) (USD Billion)
11.4.13.3 Australia Sports Devices Market Estimates and Forecasts, By Deployment (2020-2032) (USD Billion)
11.4.13.4 Australia Sports Devices Market Estimates and Forecasts, By Sport (2020-2032) (USD Billion)
11.4.14 Rest of Asia-Pacific
11.4.14.1 Rest of Asia-Pacific Sports Devices Market Estimates and Forecasts, By Component (2020-2032) (USD Billion)
11.4.14.2 Rest of Asia-Pacific Sports Devices Market Estimates and Forecasts, By Device (2020-2032) (USD Billion)
11.4.14.3 Rest of Asia-Pacific Sports Devices Market Estimates and Forecasts, By Deployment (2020-2032) (USD Billion)
11.4.14.4 Rest of Asia-Pacific Sports Devices Market Estimates and Forecasts, By Sport (2020-2032) (USD Billion)
11.5 Middle East and Africa
11.5.1 Middle East
11.5.1.1 Trends Analysis
11.5.1.2 Middle East Sports Devices Market Estimates and Forecasts, by Country (2020-2032) (USD Billion)
11.5.1.3 Middle East Sports Devices Market Estimates and Forecasts, By Component (2020-2032) (USD Billion)
11.5.1.4 Middle East Sports Devices Market Estimates and Forecasts, By Device (2020-2032) (USD Billion)
11.5.1.5 Middle East Sports Devices Market Estimates and Forecasts, By Deployment (2020-2032) (USD Billion)
11.5.1.6 Middle East Sports Devices Market Estimates and Forecasts, By Sport (2020-2032) (USD Billion)
11.5.1.7 UAE
11.5.1.7.1 UAE Sports Devices Market Estimates and Forecasts, By Component (2020-2032) (USD Billion)
11.5.1.7.2 UAE Sports Devices Market Estimates and Forecasts, By Device (2020-2032) (USD Billion)
11.5.1.7.3 UAE Sports Devices Market Estimates and Forecasts, By Deployment (2020-2032) (USD Billion)
11.5.1.7.4 UAE Sports Devices Market Estimates and Forecasts, By Sport (2020-2032) (USD Billion)
11.5.1.8 Egypt
11.5.1.8.1 Egypt Sports Devices Market Estimates and Forecasts, By Component (2020-2032) (USD Billion)
11.5.1.8.2 Egypt Sports Devices Market Estimates and Forecasts, By Device (2020-2032) (USD Billion)
11.5.1.8.3 Egypt Sports Devices Market Estimates and Forecasts, By Deployment (2020-2032) (USD Billion)
11.5.1.8.4 Egypt Sports Devices Market Estimates and Forecasts, By Sport (2020-2032) (USD Billion)
11.5.1.9 Saudi Arabia
11.5.1.9.1 Saudi Arabia Sports Devices Market Estimates and Forecasts, By Component (2020-2032) (USD Billion)
11.5.1.9.2 Saudi Arabia Sports Devices Market Estimates and Forecasts, By Device (2020-2032) (USD Billion)
11.5.1.9.3 Saudi Arabia Sports Devices Market Estimates and Forecasts, By Deployment (2020-2032) (USD Billion)
11.5.1.9.4 Saudi Arabia Sports Devices Market Estimates and Forecasts, By Sport (2020-2032) (USD Billion)
11.5.1.10 Qatar
11.5.1.10.1 Qatar Sports Devices Market Estimates and Forecasts, By Component (2020-2032) (USD Billion)
11.5.1.10.2 Qatar Sports Devices Market Estimates and Forecasts, By Device (2020-2032) (USD Billion)
11.5.1.10.3 Qatar Sports Devices Market Estimates and Forecasts, By Deployment (2020-2032) (USD Billion)
11.5.1.10.4 Qatar Sports Devices Market Estimates and Forecasts, By Sport (2020-2032) (USD Billion)
11.5.1.11 Rest of Middle East
11.5.1.11.1 Rest of Middle East Sports Devices Market Estimates and Forecasts, By Component (2020-2032) (USD Billion)
11.5.1.11.2 Rest of Middle East Sports Devices Market Estimates and Forecasts, By Device (2020-2032) (USD Billion)
11.5.1.11.3 Rest of Middle East Sports Devices Market Estimates and Forecasts, By Deployment (2020-2032) (USD Billion)
11.5.1.11.4 Rest of Middle East Sports Devices Market Estimates and Forecasts, By Sport (2020-2032) (USD Billion)
11.5.2 Africa
11.5.2.1 Trends Analysis
11.5.2.2 Africa Sports Devices Market Estimates and Forecasts, by Country (2020-2032) (USD Billion)
11.5.2.3 Africa Sports Devices Market Estimates and Forecasts, By Component (2020-2032) (USD Billion)
11.5.2.4 Africa Sports Devices Market Estimates and Forecasts, By Device (2020-2032) (USD Billion)
11.5.2.5 Africa Sports Devices Market Estimates and Forecasts, By Deployment (2020-2032) (USD Billion)
11.5.2.6 Africa Sports Devices Market Estimates and Forecasts, By Sport (2020-2032) (USD Billion)
11.5.2.7 South Africa
11.5.2.7.1 South Africa Sports Devices Market Estimates and Forecasts, By Component (2020-2032) (USD Billion)
11.5.2.7.2 South Africa Sports Devices Market Estimates and Forecasts, By Device (2020-2032) (USD Billion)
11.5.2.7.3 South Africa Sports Devices Market Estimates and Forecasts, By Deployment (2020-2032) (USD Billion)
11.5.2.7.4 South Africa Sports Devices Market Estimates and Forecasts, By Sport (2020-2032) (USD Billion)
11.5.2.8 Nigeria
11.5.2.8.1 Nigeria Sports Devices Market Estimates and Forecasts, By Component (2020-2032) (USD Billion)
11.5.2.8.2 Nigeria Sports Devices Market Estimates and Forecasts, By Device (2020-2032) (USD Billion)
11.5.2.8.3 Nigeria Sports Devices Market Estimates and Forecasts, By Deployment (2020-2032) (USD Billion)
11.5.2.8.4 Nigeria Sports Devices Market Estimates and Forecasts, By Sport (2020-2032) (USD Billion)
11.5.2.9 Rest of Africa
11.5.2.9.1 Rest of Africa Sports Devices Market Estimates and Forecasts, By Component (2020-2032) (USD Billion)
11.5.2.9.2 Rest of Africa Sports Devices Market Estimates and Forecasts, By Device (2020-2032) (USD Billion)
11.5.2.9.3 Rest of Africa Sports Devices Market Estimates and Forecasts, By Deployment (2020-2032) (USD Billion)
11.5.2.9.4 Rest of Africa Sports Devices Market Estimates and Forecasts, By Sport (2020-2032) (USD Billion)
11.6 Latin America
11.6.1 Trends Analysis
11.6.2 Latin America Sports Devices Market Estimates and Forecasts, by Country (2020-2032) (USD Billion)
11.6.3 Latin America Sports Devices Market Estimates and Forecasts, By Component (2020-2032) (USD Billion)
11.6.4 Latin America Sports Devices Market Estimates and Forecasts, By Device (2020-2032) (USD Billion)
11.6.5 Latin America Sports Devices Market Estimates and Forecasts, By Deployment (2020-2032) (USD Billion)
11.6.6 Latin America Sports Devices Market Estimates and Forecasts, By Sport (2020-2032) (USD Billion)
11.6.7 Brazil
11.6.7.1 Brazil Sports Devices Market Estimates and Forecasts, By Component (2020-2032) (USD Billion)
11.6.7.2 Brazil Sports Devices Market Estimates and Forecasts, By Device (2020-2032) (USD Billion)
11.6.7.3 Brazil Sports Devices Market Estimates and Forecasts, By Deployment (2020-2032) (USD Billion)
11.6.7.4 Brazil Sports Devices Market Estimates and Forecasts, By Sport (2020-2032) (USD Billion)
11.6.8 Argentina
11.6.8.1 Argentina Sports Devices Market Estimates and Forecasts, By Component (2020-2032) (USD Billion)
11.6.8.2 Argentina Sports Devices Market Estimates and Forecasts, By Device (2020-2032) (USD Billion)
11.6.8.3 Argentina Sports Devices Market Estimates and Forecasts, By Deployment (2020-2032) (USD Billion)
11.6.8.4 Argentina Sports Devices Market Estimates and Forecasts, By Sport (2020-2032) (USD Billion)
11.6.9 Colombia
11.6.9.1 Colombia Sports Devices Market Estimates and Forecasts, By Component (2020-2032) (USD Billion)
11.6.9.2 Colombia Sports Devices Market Estimates and Forecasts, By Device (2020-2032) (USD Billion)
11.6.9.3 Colombia Sports Devices Market Estimates and Forecasts, By Deployment (2020-2032) (USD Billion)
11.6.9.4 Colombia Sports Devices Market Estimates and Forecasts, By Sport (2020-2032) (USD Billion)
11.6.10 Rest of Latin America
11.6.10.1 Rest of Latin America Sports Devices Market Estimates and Forecasts, By Component (2020-2032) (USD Billion)
11.6.10.2 Rest of Latin America Sports Devices Market Estimates and Forecasts, By Device (2020-2032) (USD Billion)
11.6.10.3 Rest of Latin America Sports Devices Market Estimates and Forecasts, By Deployment (2020-2032) (USD Billion)
11.6.10.4 Rest of Latin America Sports Devices Market Estimates and Forecasts, By Sport (2020-2032) (USD Billion)
12. Company Profiles
12.1 Nike
12.1.1 Company Overview
12.1.2 Financial
12.1.3 Products/ Services Offered
12.1.4 SWOT Analysis
12.2 Adidas
12.2.1 Company Overview
12.2.2 Financial
12.2.3 Products/ Services Offered
12.2.4 SWOT Analysis
12.3 Amer Sports
12.3.1 Company Overview
12.3.2 Financial
12.3.3 Products/ Services Offered
12.3.4 SWOT Analysis
12.4 Puma
12.4.1 Company Overview
12.4.2 Financial
12.4.3 Products/ Services Offered
12.4.4 SWOT Analysis
12.5 Under Armour
12.5.1 Company Overview
12.5.2 Financial
12.5.3 Products/ Services Offered
12.5.4 SWOT Analysis
12.6 New Balance
12.6.1 Company Overview
12.6.2 Financial
12.6.3 Products/ Services Offered
12.6.4 SWOT Analysis
12.7 Lululemon Athletica
12.7.1 Company Overview
12.7.2 Financial
12.7.3 Products/ Services Offered
12.7.4 SWOT Analysis
12.8 Athleta
12.8.1 Company Overview
12.8.2 Financial
12.8.3 Products/ Services Offered
12.8.4 SWOT Analysis
12.9 Avery Dennison
12.9.1 Company Overview
12.9.2 Financial
12.9.3 Products/ Services Offered
12.9.4 SWOT Analysis
12.10 Asics
12.10.1 Company Overview
12.10.2 Financial
12.10.3 Products/ Services Offered
12.10.4 SWOT Analysis
13. Use Cases and Best Practices
14. Conclusion
An accurate research report requires proper strategizing as well as implementation. There are multiple factors involved in the completion of good and accurate research report and selecting the best methodology to compete the research is the toughest part. Since the research reports we provide play a crucial role in any company’s decision-making process, therefore we at SNS Insider always believe that we should choose the best method which gives us results closer to reality. This allows us to reach at a stage wherein we can provide our clients best and accurate investment to output ratio.
Each report that we prepare takes a timeframe of 350-400 business hours for production. Starting from the selection of titles through a couple of in-depth brain storming session to the final QC process before uploading our titles on our website we dedicate around 350 working hours. The titles are selected based on their current market cap and the foreseen CAGR and growth.
The 5 steps process:
Step 1: Secondary Research:
Secondary Research or Desk Research is as the name suggests is a research process wherein, we collect data through the readily available information. In this process we use various paid and unpaid databases which our team has access to and gather data through the same. This includes examining of listed companies’ annual reports, Journals, SEC filling etc. Apart from this our team has access to various associations across the globe across different industries. Lastly, we have exchange relationships with various university as well as individual libraries.

Step 2: Primary Research
When we talk about primary research, it is a type of study in which the researchers collect relevant data samples directly, rather than relying on previously collected data. This type of research is focused on gaining content specific facts that can be sued to solve specific problems. Since the collected data is fresh and first hand therefore it makes the study more accurate and genuine.
We at SNS Insider have divided Primary Research into 2 parts.
Part 1 wherein we interview the KOLs of major players as well as the upcoming ones across various geographic regions. This allows us to have their view over the market scenario and acts as an important tool to come closer to the accurate market numbers. As many as 45 paid and unpaid primary interviews are taken from both the demand and supply side of the industry to make sure we land at an accurate judgement and analysis of the market.
This step involves the triangulation of data wherein our team analyses the interview transcripts, online survey responses and observation of on filed participants. The below mentioned chart should give a better understanding of the part 1 of the primary interview.

Part 2: In this part of primary research the data collected via secondary research and the part 1 of the primary research is validated with the interviews from individual consultants and subject matter experts.
Consultants are those set of people who have at least 12 years of experience and expertise within the industry whereas Subject Matter Experts are those with at least 15 years of experience behind their back within the same space. The data with the help of two main processes i.e., FGDs (Focused Group Discussions) and IDs (Individual Discussions). This gives us a 3rd party nonbiased primary view of the market scenario making it a more dependable one while collation of the data pointers.
Step 3: Data Bank Validation
Once all the information is collected via primary and secondary sources, we run that information for data validation. At our intelligence centre our research heads track a lot of information related to the market which includes the quarterly reports, the daily stock prices, and other relevant information. Our data bank server gets updated every fortnight and that is how the information which we collected using our primary and secondary information is revalidated in real time.

Step 4: QA/QC Process
After all the data collection and validation our team does a final level of quality check and quality assurance to get rid of any unwanted or undesired mistakes. This might include but not limited to getting rid of the any typos, duplication of numbers or missing of any important information. The people involved in this process include technical content writers, research heads and graphics people. Once this process is completed the title gets uploader on our platform for our clients to read it.
Step 5: Final QC/QA Process:
This is the last process and comes when the client has ordered the study. In this process a final QA/QC is done before the study is emailed to the client. Since we believe in giving our clients a good experience of our research studies, therefore, to make sure that we do not lack at our end in any way humanly possible we do a final round of quality check and then dispatch the study to the client.
By Component
Hardware
Software
By Device
Wearables
Digital Signage
Camera
By Deployment
On-premise
Cloud
By Sport
Football
Cricket
Baseball
Basketball
Rugby
Others
Request for Segment Customization as per your Business Requirement: Segment Customization Request
Regional Coverage:
North America
US
Canada
Mexico
Europe
Eastern Europe
Poland
Romania
Hungary
Turkey
Rest of Eastern Europe
Western Europe
Germany
France
UK
Italy
Spain
Netherlands
Switzerland
Austria
Rest of Western Europe
Asia Pacific
China
India
Japan
South Korea
Vietnam
Singapore
Australia
Rest of Asia Pacific
Middle East & Africa
Middle East
UAE
Egypt
Saudi Arabia
Qatar
Rest of Middle East
Africa
Nigeria
South Africa
Rest of Africa
Latin America
Brazil
Argentina
Colombia
Rest of Latin America
Request for Country Level Research Report: Country Level Customization Request
Available Customization
With the given market data, SNS Insider offers customization as per the company’s specific needs. The following customization options are available for the report:
Detailed Volume Analysis
Criss-Cross segment analysis (e.g. Product X Application)
Competitive Product Benchmarking
Geographic Analysis
Additional countries in any of the regions
Customized Data Representation
Detailed analysis and profiling of additional market players
The Artificial Intelligence (AI) in Semiconductor Market Size was valued at USD 48.96 Billion in 2023 and is expected to grow at a CAGR of 15.2% From 2024-2032.
The Distributed Acoustic Sensing (DAS) Market was valued at USD 631.45 million in 2023 and is expected to grow at a CAGR of 10.37% by forecasts 2024-2032.
The Semiconductor Tubing Market Size was valued at USD 0.33 Billion in 2023 and is expected to reach USD 0.57 Billion by 2032 at 6.3% CAGR, During 2024-2032
The Capacitive Sensor market size was $ 30.62 Billion in 2023 & expects a good growth by reaching USD 49.06 billion till end of year2032 at CAGR about 5.43% during forecast period 2023-2032
The High-speed Camera Market Size was valued at USD 623.32 Million in 2023 and is expected to grow at a CAGR of 9.18% to reach USD 1373.8 Million by 2032.
The Micro Fulfillment Market was valued at USD 4.86 billion in 2023 and is expected to reach USD 69.59 billion by 2032, growing at a CAGR of 34.46% over the forecast period 2024-2032.

Hi! Click one of our member below to chat on Phone
© 2025 All Rights Reserved by SNS Insider Pvt Ltd


