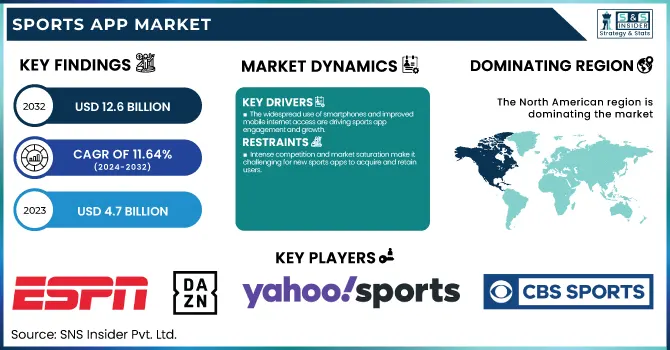
The Sports App Market was valued at USD 4.7 Billion in 2023 and is expected to reach USD 12.6 Billion by 2032, growing at a CAGR of 11.64% from 2024-2032.
To Get more information on Sports App Market - Request Free Sample Report
This report explores user engagement trends, revealing that live streaming and eSports apps have the highest retention rates. Subscription-based models are more prevalent in North America, while ad-supported revenues dominate in emerging markets. Mobile sports app downloads are increasing faster on Android than iOS, mainly due to accessibility in developing regions. AI-driven personalization is enhancing user retention, especially in fantasy sports and fitness apps. Additionally, the report highlights a growing shift toward hybrid monetization models and deeper AI integration to improve user experience.
Driver
The widespread use of smartphones and improved mobile internet access are driving sports app engagement and growth.
The number of smartphone users is growing and mobile internet connectivity is broadening rapidly, which are the two primary growth factors in the sports app market. As the streaming quality increases with improved latency on 5 G networks, users are doing more with live sports, fantasy leagues, and eSports platforms. The increasing access to smartphones with low-cost plans in developing economies has helped create a wider user base, further propelling the demand for sports apps. AI-powered personalization along with real-time updates only amplifies this user interaction experience. With sports leagues establishing a digital footprint through deals with mobile platforms and online streaming rights, apps are seeing a rise in downloads, and mobile platforms are now the top entry point for sports consumption.
Restraint
Intense competition and market saturation make it challenging for new sports apps to acquire and retain users.
Sports apps here come to face stiff competition from established brands and new entrants with the launch of mega brand products fighting for the attention of users. Current players like ESPN and DAZN and Yahoo Sports are still in command, new apps have a hard time to grow. App store cluttering compels firms to spend enormously on promotion and user acquisition, leading to increased expenses. User retention becomes a challenge, as consumers move in and out of different apps depending on content and subscription pricing. many areas have regulatory restrictions on sports betting apps, which crowds the ability to monetize these offerings. All such factors pose a challenge for the new player to retain long-term growth in the competitive sports app ecosystem.
Opportunity
AI-powered features like real-time insights and personalized recommendations are enhancing user engagement in sports apps.
AI, ML Effect on Sport App Development Trends As the adoption of AI and ML is rising high, the advent of sports application development gets a huge opportunity at the horizon. Real-time game insights, predictive analytics, and personalized recommendations drive user engagement and retention, among other AI-driven features. And apps are adopting AI to provide personalized content, including customized match highlights, fantasy sports recommendations, and predictions of player performance. Also, AI chatbots and voice assistants enhance user interaction, offering instant updates and stats. As immersive sports experiences based on AR/VR are accelerating, AI-driven fan engagement is in line to ramp up. Add to that the revenue generation via AI-powered personalized and niche segmentation advertisements and subscriptions for the sports apps.
Challenge
Sports apps face challenges in protecting user data and complying with stringent privacy regulations.
Especially with the use of AI, analytics, and user tracking increasing, data privacy and security has become one of the main challenges sports apps need to overcome. Due to the large amounts of user data that sports apps gather, such as their location, how many times the user has utilized the app, and their payment details, cybercriminals could be motivated to attack. Operational complexities are further compounded by data protection laws such as GDPR and CCPA mandating security measures in the app. Moreover, safe payment gateways and stopping access to high fee content remains a continual concern. In a world of increased privacy concern, trust needs to rely on clear-cut policies regarding data, emphasis on well-developed encryption, and use of multi-factor authentication for data protection.
By Marketplace
In 2023, the iOS store segment dominated the market and accounted for 49% of revenue share. This is due to the rise of high interaction-based interface-based apps required by their consumers based out in the U.S. and the UK. Moreover, market growth is driven by the growing 3D features, and on top of that, effortless connectivity with add-on security. This perfect combination of hardware, software, and an impressive user interface nurtured a vibrant ecosystem where a myriad of sports-focused applications could be developed and widely adopted.
The iOS Google Play Store segment is expected to register the fastest CAGR during the forecast period. The segment growth is propelled by the open ecosystem, the easy access of in-app purchase of customizable user interface of apps, and the advanced multitasking system. Tools for sports broadcasting video editing on the Android platform
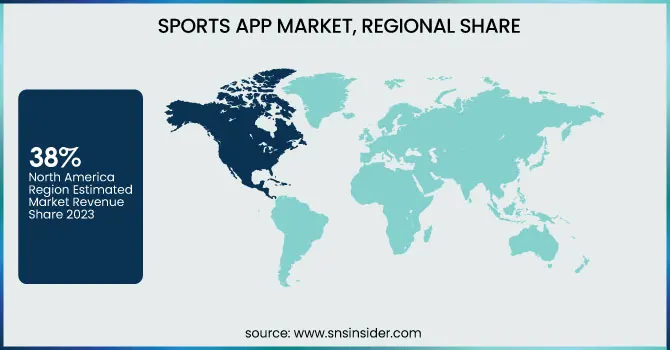
In 2023, North America dominated the market and accounted for 38% of revenue share, owing to the increasing demand for Wrestling AEW sports live streaming among the consumers in the U.S. and Canada. Market growth is being driven by an increasing trend in the U.S. favoring the use of technology-driven content management apps. Increasing demand for the AI-based, Standalone Streaming application is expected to increase the revenue share of the U.S.
The Asia Pacific segment is expected to register the fastest CAGR during the forecast period. It is due to the rising demand for cloud-based sports apps among consumers in China and India. And in China at least, there is a new trend toward the adoption of subscription-based apps. In addition, increasing digital payment service demand in China is expected to drive market growth. The increasing acceptance of sports applications that provide translation in a regional language is expected to further accelerate the growth in India during the forecast period.
Get Customized Report as per Your Business Requirement - Enquiry Now
The major key players along with their products are
ESPN – ESPN App
DAZN – DAZN Sports Streaming App
Yahoo Sports – Yahoo Sports App
Bleacher Report – B/R Live
CBS Sports – CBS Sports App
NBC Sports – NBC Sports App
FanDuel – FanDuel Fantasy Sports App
DraftKings – DraftKings Sportsbook App
SofaScore – SofaScore Live Sports App
365Scores – 365Scores Sports Live App
theScore – theScore Sports News & Scores App
OneFootball – OneFootball Live Soccer Scores App
Bet365 – Bet365 Sports Betting App
FIFA – FIFA+ App
UEFA – UEFA.tv App
February 2024: The National Hockey League (NHL) introduced an innovative "STEMcast" broadcast during a game between the Boston Bruins and Florida Panthers. This alternative broadcast combined animation with STEM education elements, aiming to engage younger audiences by integrating digitally enhanced features into the live sports viewing experience.
March 2024: Flutter Entertainment, the parent company of FanDuel, projected a 34% increase in core profit for 2025, following a 26% growth in 2024. This optimistic outlook is driven by the expanding U.S. gambling market and FanDuel's leading position within it.
May 2024: Circa Sports expanded its mobile sports betting app to Kentucky, partnering with the Cumberland Run horse track in Corbin. This move marked Circa's continued efforts to broaden its presence in the U.S. sports betting market.
October 2024: Diamond Sports Group announced a rebranding of its Bally Sports regional networks to the FanDuel Sports Network, reflecting a strategic partnership with FanDuel Group. This rebranding included updating the Bally Sports app to the new FanDuel Sports Network app, aiming to enhance user experience and integrate sports betting content.
|
Report Attributes |
Details |
|
Market Size in 2023 |
USD 4.7 Billion |
|
Market Size by 2032 |
USD 12.6 Billion |
|
CAGR |
CAGR of 11.64% From 2024 to 2032 |
|
Base Year |
2023 |
|
Forecast Period |
2024-2032 |
|
Historical Data |
2020-2022 |
|
Report Scope & Coverage |
Market Size, Segments Analysis, Competitive Landscape, Regional Analysis, DROC & SWOT Analysis, Forecast Outlook |
|
Key Segments |
• By Marketplace (Google Play Store, Apple iOS Store, Others) |
|
Regional Analysis/Coverage |
North America (US, Canada, Mexico), Europe (Eastern Europe [Poland, Romania, Hungary, Turkey, Rest of Eastern Europe] Western Europe] Germany, France, UK, Italy, Spain, Netherlands, Switzerland, Austria, Rest of Western Europe]), Asia Pacific (China, India, Japan, South Korea, Vietnam, Singapore, Australia, Rest of Asia Pacific), Middle East & Africa (Middle East [UAE, Egypt, Saudi Arabia, Qatar, Rest of Middle East], Africa [Nigeria, South Africa, Rest of Africa], Latin America (Brazil, Argentina, Colombia, Rest of Latin America) |
|
Company Profiles |
ESPN, DAZN, Yahoo Sports, Bleacher Report, CBS Sports, NBC Sports, FanDuel, DraftKings, SofaScore, 365Scores, theScore, OneFootball, Bet365, FIFA, UEFA |
Ans - The Sports App Market was valued at USD 4.7 Billion in 2023 and is expected to reach USD 12.6 Billion by 2032
Ans- The CAGR of the Sports App Market during the forecast period is 11.64% from 2024-2032.
Ans- Asia-Pacific is expected to register the fastest CAGR during the forecast period.
Ans- The widespread use of smartphones and improved mobile internet access are driving sports app engagement and growth.
Ans- Sports apps face challenges in protecting user data and complying with stringent privacy regulations.
Table of Content
1. Introduction
1.1 Market Definition
1.2 Scope (Inclusion and Exclusions)
1.3 Research Assumptions
2. Executive Summary
2.1 Market Overview
2.2 Regional Synopsis
2.3 Competitive Summary
3. Research Methodology
3.1 Top-Down Approach
3.2 Bottom-up Approach
3.3. Data Validation
3.4 Primary Interviews
4. Market Dynamics Impact Analysis
4.1 Market Driving Factors Analysis
4.1.1 Drivers
4.1.2 Restraints
4.1.3 Opportunities
4.1.4 Challenges
4.2 PESTLE Analysis
4.3 Porter’s Five Forces Model
5. Statistical Insights and Trends Reporting
5.1 User Engagement Trends, by App Category (Live Streaming, Fitness, Fantasy Sports, eSports)
5.2 Subscription-Based vs. Ad-Supported Revenue Model Share, by Region
5.3 Growth in Mobile Sports App Downloads, by Platform (iOS vs. Android)
5.4 Impact of AI & Personalization Features on User Retention, by App Type
6. Competitive Landscape
6.1 List of Major Companies, By Region
6.2 Market Share Analysis, By Region
6.3 Product Benchmarking
6.3.1 Product specifications and features
6.3.2 Pricing
6.4 Strategic Initiatives
6.4.1 Marketing and promotional activities
6.4.2 Distribution and supply chain strategies
6.4.3 Expansion plans and new product launches
6.4.4 Strategic partnerships and collaborations
6.5 Technological Advancements
6.6 Market Positioning and Branding
7. Sports App Market Segmentation, By Marketplace
7.1 Chapter Overview
7.2 Google Play Store
7.2.1 Google Play Store Market Trends Analysis (2020-2032)
7.2.2 Google Play Store Market Size Estimates and Forecasts to 2032 (USD Billion)
7.3 Apple iOS Store
7.3.1 Apple iOS Store Market Trends Analysis (2020-2032)
7.3.2 Apple iOS Store Market Size Estimates and Forecasts to 2032 (USD Billion)
7.4 Others
7.4.1 Others Market Trends Analysis (2020-2032)
7.4.2 Others Market Size Estimates and Forecasts to 2032 (USD Billion)
8. Regional Analysis
8.1 Chapter Overview
8.2 North America
8.2.1 Trends Analysis
8.2.2 North America Sports App Market Estimates and Forecasts, by Country (2020-2032) (USD Billion)
8.2.3 North America Sports App Market Estimates and Forecasts, by Marketplace (2020-2032) (USD Billion)
8.2.2 USA
8.2.2.1 USA Sports App Market Estimates and Forecasts, by Marketplace (2020-2032) (USD Billion)
8.2.3 Canada
8.2.3.1 Canada Sports App Market Estimates and Forecasts, by Marketplace (2020-2032) (USD Billion)
8.2.4 Mexico
8.2.4.1 Mexico Sports App Market Estimates and Forecasts, by Marketplace (2020-2032) (USD Billion)
8.3 Europe
8.3.1 Eastern Europe
8.3.1.1 Trends Analysis
8.3.1.2 Eastern Europe Sports App Market Estimates and Forecasts, by Country (2020-2032) (USD Billion)
8.3.1.3 Eastern Europe Sports App Market Estimates and Forecasts, by Marketplace (2020-2032) (USD Billion)
8.3.1.4 Poland
8.3.1.4.1 Poland Sports App Market Estimates and Forecasts, by Marketplace (2020-2032) (USD Billion)
8.3.1.5 Romania
8.3.1.5.1 Romania Sports App Market Estimates and Forecasts, by Marketplace (2020-2032) (USD Billion)
8.3.1.6 Hungary
10.3.1.8.1 Hungary Sports App Market Estimates and Forecasts, by Marketplace (2020-2032) (USD Billion)
8.3.1.7 Turkey
8.3.1.7.1 Turkey Sports App Market Estimates and Forecasts, by Marketplace (2020-2032) (USD Billion)
8.3.1.8 Rest of Eastern Europe
8.3.1.8.1 Rest of Eastern Europe Sports App Market Estimates and Forecasts, by Marketplace (2020-2032) (USD Billion)
8.3.2 Western Europe
8.3.2.1 Trends Analysis
8.3.2.2 Western Europe Sports App Market Estimates and Forecasts, by Country (2020-2032) (USD Billion)
8.3.2.3 Western Europe Sports App Market Estimates and Forecasts, by Marketplace (2020-2032) (USD Billion)
8.3.2.4 Germany
8.3.2.4.1 Germany Sports App Market Estimates and Forecasts, by Marketplace (2020-2032) (USD Billion)
8.3.2.5 France
8.3.2.5.1 France Sports App Market Estimates and Forecasts, by Marketplace (2020-2032) (USD Billion)
8.3.2.6 UK
8.3.2.6.1 UK Sports App Market Estimates and Forecasts, by Marketplace (2020-2032) (USD Billion)
8.3.2.7 Italy
8.3.2.7.1 Italy Sports App Market Estimates and Forecasts, by Marketplace (2020-2032) (USD Billion)
8.3.2.8 Spain
8.3.2.8.1 Spain Sports App Market Estimates and Forecasts, by Marketplace (2020-2032) (USD Billion)
8.3.2.9 Netherlands
8.3.2.9.1 Netherlands Sports App Market Estimates and Forecasts, by Marketplace (2020-2032) (USD Billion)
8.3.2.10 Switzerland
8.3.2.10.1 Switzerland Sports App Market Estimates and Forecasts, by Marketplace (2020-2032) (USD Billion)
8.3.2.11 Austria
8.3.2.11.1 Austria Sports App Market Estimates and Forecasts, by Marketplace (2020-2032) (USD Billion)
8.3.2.12 Rest of Western Europe
8.3.2.12.1 Rest of Western Europe Sports App Market Estimates and Forecasts, by Marketplace (2020-2032) (USD Billion)
8.4 Asia-Pacific
8.4.1 Trends Analysis
8.4.2 Asia-Pacific Sports App Market Estimates and Forecasts, by Country (2020-2032) (USD Billion)
8.4.3 Asia-Pacific Sports App Market Estimates and Forecasts, by Marketplace (2020-2032) (USD Billion)
8.4.4 China
8.4.4.1 China Sports App Market Estimates and Forecasts, by Marketplace (2020-2032) (USD Billion)
8.4.5 India
8.4.5.1 India Sports App Market Estimates and Forecasts, by Marketplace (2020-2032) (USD Billion)
8.4.6 Japan
8.4.6.1 Japan Sports App Market Estimates and Forecasts, by Marketplace (2020-2032) (USD Billion)
8.4.7 South Korea
8.4.7.1 South Korea Sports App Market Estimates and Forecasts, by Marketplace (2020-2032) (USD Billion)
8.4.8 Vietnam
8.4.8.1 Vietnam Sports App Market Estimates and Forecasts, by Marketplace (2020-2032) (USD Billion)
8.4.9 Singapore
8.4.9.1 Singapore Sports App Market Estimates and Forecasts, by Marketplace (2020-2032) (USD Billion)
8.4.10 Australia
8.4.10.1 Australia Sports App Market Estimates and Forecasts, by Marketplace (2020-2032) (USD Billion)
8.4.11 Rest of Asia-Pacific
8.4.11.1 Rest of Asia-Pacific Sports App Market Estimates and Forecasts, by Marketplace (2020-2032) (USD Billion)
8.5 Middle East and Africa
8.5.1 Middle East
8.5.1.1 Trends Analysis
8.5.1.2 Middle East Sports App Market Estimates and Forecasts, by Country (2020-2032) (USD Billion)
10.5.1.3 Middle East Sports App Market Estimates and Forecasts, by Marketplace (2020-2032) (USD Billion)
8.5.1.4 UAE
8.5.1.4.1 UAE Sports App Market Estimates and Forecasts, by Marketplace (2020-2032) (USD Billion)
8.5.1.5 Egypt
8.5.1.5.1 Egypt Sports App Market Estimates and Forecasts, by Marketplace (2020-2032) (USD Billion)
8.5.1.6 Saudi Arabia
8.5.1.6.1 Saudi Arabia Sports App Market Estimates and Forecasts, by Marketplace (2020-2032) (USD Billion)
8.5.1.7 Qatar
8.5.1.7.1 Qatar Sports App Market Estimates and Forecasts, by Marketplace (2020-2032) (USD Billion)
8.5.1.8 Rest of Middle East
8.5.1.8.1 Rest of Middle East Sports App Market Estimates and Forecasts, by Marketplace (2020-2032) (USD Billion)
8.5.2 Africa
8.5.2.1 Trends Analysis
8.5.2.2 Africa Sports App Market Estimates and Forecasts, by Country (2020-2032) (USD Billion)
8.5.2.3 Africa Sports App Market Estimates and Forecasts, by Marketplace (2020-2032) (USD Billion)
8.5.2.4 South Africa
8.5.2.4.1 South Africa Sports App Market Estimates and Forecasts, by Marketplace (2020-2032) (USD Billion)
8.5.2.5 Nigeria
8.5.2.5.1 Nigeria Sports App Market Estimates and Forecasts, by Marketplace (2020-2032) (USD Billion)
8.5.2.6 Rest of Africa
8.5.2.6.1 Rest of Africa Sports App Market Estimates and Forecasts, by Marketplace (2020-2032) (USD Billion)
8.6 Latin America
8.6.1 Trends Analysis
8.6.2 Latin America Sports App Market Estimates and Forecasts, by Country (2020-2032) (USD Billion)
8.6.3 Latin America Sports App Market Estimates and Forecasts, by Marketplace (2020-2032) (USD Billion)
8.6.4 Brazil
8.6.4.1 Brazil Sports App Market Estimates and Forecasts, by Marketplace (2020-2032) (USD Billion)
8.6.5 Argentina
8.6.5.1 Argentina Sports App Market Estimates and Forecasts, by Marketplace (2020-2032) (USD Billion)
8.6.6 Colombia
8.6.6.1 Colombia Sports App Market Estimates and Forecasts, by Marketplace (2020-2032) (USD Billion)
8.6.7 Rest of Latin America
8.6.7.1 Rest of Latin America Sports App Market Estimates and Forecasts, by Marketplace (2020-2032) (USD Billion)
9. Company Profiles
9.1 ESPN
9.1.1 Company Overview
9.1.2 Financial
9.1.3 Products/ Services Offered
9.1.4 SWOT Analysis
9.2 DAZN
9.2.1 Company Overview
9.2.2 Financial
9.2.3 Products/ Services Offered
9.2.4 SWOT Analysis
9.3 Yahoo Sports
9.3.1 Company Overview
9.3.2 Financial
9.3.3 Products/ Services Offered
9.3.4 SWOT Analysis
9.4 Bleacher Report
9.4.1 Company Overview
9.4.2 Financial
9.4.3 Products/ Services Offered
9.4.4 SWOT Analysis
9.5 CBS Sports
9.5.1 Company Overview
9.5.2 Financial
9.5.3 Products/ Services Offered
9.5.4 SWOT Analysis
9.6 NBC Sports
9.6.1 Company Overview
9.6.2 Financial
9.6.3 Products/ Services Offered
9.6.4 SWOT Analysis
9.7 FanDuel
9.7.1 Company Overview
9.7.2 Financial
9.7.3 Products/ Services Offered
9.7.4 SWOT Analysis
9.8 DraftKings
9.8.1 Company Overview
9.8.2 Financial
9.8.3 Products/ Services Offered
9.8.4 SWOT Analysis
9.9 SofaScore
9.9.1 Company Overview
9.9.2 Financial
9.9.3 Products/ Services Offered
9.9.4 SWOT Analysis
9.10 365Scores
9.10.1 Company Overview
9.10.2 Financial
9.10.3 Products/ Services Offered
9.10.4 SWOT Analysis
10. Use Cases and Best Practices
11. Conclusion
An accurate research report requires proper strategizing as well as implementation. There are multiple factors involved in the completion of good and accurate research report and selecting the best methodology to compete the research is the toughest part. Since the research reports we provide play a crucial role in any company’s decision-making process, therefore we at SNS Insider always believe that we should choose the best method which gives us results closer to reality. This allows us to reach at a stage wherein we can provide our clients best and accurate investment to output ratio.
Each report that we prepare takes a timeframe of 350-400 business hours for production. Starting from the selection of titles through a couple of in-depth brain storming session to the final QC process before uploading our titles on our website we dedicate around 350 working hours. The titles are selected based on their current market cap and the foreseen CAGR and growth.
The 5 steps process:
Step 1: Secondary Research:
Secondary Research or Desk Research is as the name suggests is a research process wherein, we collect data through the readily available information. In this process we use various paid and unpaid databases which our team has access to and gather data through the same. This includes examining of listed companies’ annual reports, Journals, SEC filling etc. Apart from this our team has access to various associations across the globe across different industries. Lastly, we have exchange relationships with various university as well as individual libraries.

Step 2: Primary Research
When we talk about primary research, it is a type of study in which the researchers collect relevant data samples directly, rather than relying on previously collected data. This type of research is focused on gaining content specific facts that can be sued to solve specific problems. Since the collected data is fresh and first hand therefore it makes the study more accurate and genuine.
We at SNS Insider have divided Primary Research into 2 parts.
Part 1 wherein we interview the KOLs of major players as well as the upcoming ones across various geographic regions. This allows us to have their view over the market scenario and acts as an important tool to come closer to the accurate market numbers. As many as 45 paid and unpaid primary interviews are taken from both the demand and supply side of the industry to make sure we land at an accurate judgement and analysis of the market.
This step involves the triangulation of data wherein our team analyses the interview transcripts, online survey responses and observation of on filed participants. The below mentioned chart should give a better understanding of the part 1 of the primary interview.

Part 2: In this part of primary research the data collected via secondary research and the part 1 of the primary research is validated with the interviews from individual consultants and subject matter experts.
Consultants are those set of people who have at least 12 years of experience and expertise within the industry whereas Subject Matter Experts are those with at least 15 years of experience behind their back within the same space. The data with the help of two main processes i.e., FGDs (Focused Group Discussions) and IDs (Individual Discussions). This gives us a 3rd party nonbiased primary view of the market scenario making it a more dependable one while collation of the data pointers.
Step 3: Data Bank Validation
Once all the information is collected via primary and secondary sources, we run that information for data validation. At our intelligence centre our research heads track a lot of information related to the market which includes the quarterly reports, the daily stock prices, and other relevant information. Our data bank server gets updated every fortnight and that is how the information which we collected using our primary and secondary information is revalidated in real time.

Step 4: QA/QC Process
After all the data collection and validation our team does a final level of quality check and quality assurance to get rid of any unwanted or undesired mistakes. This might include but not limited to getting rid of the any typos, duplication of numbers or missing of any important information. The people involved in this process include technical content writers, research heads and graphics people. Once this process is completed the title gets uploader on our platform for our clients to read it.
Step 5: Final QC/QA Process:
This is the last process and comes when the client has ordered the study. In this process a final QA/QC is done before the study is emailed to the client. Since we believe in giving our clients a good experience of our research studies, therefore, to make sure that we do not lack at our end in any way humanly possible we do a final round of quality check and then dispatch the study to the client.
Key Segmentation:
By Marketplace
Google Play Store
Apple iOS Store
Others
Request for Segment Customization as per your Business Requirement: Segment Customization Request
Regional Coverage:
North America
US
Canada
Mexico
Europe
Eastern Europe
Poland
Romania
Hungary
Turkey
Rest of Eastern Europe
Western Europe
Germany
France
UK
Italy
Spain
Netherlands
Switzerland
Austria
Rest of Western Europe
Asia Pacific
China
India
Japan
South Korea
Vietnam
Singapore
Australia
Rest of Asia Pacific
Middle East & Africa
Middle East
UAE
Egypt
Saudi Arabia
Qatar
Rest of Middle East
Africa
Nigeria
South Africa
Rest of Africa
Latin America
Brazil
Argentina
Colombia
Rest of Latin America
Request for Country Level Research Report: Country Level Customization Request
Available Customization
With the given market data, SNS Insider offers customization as per the company’s specific needs. The following customization options are available for the report:
Detailed Volume Analysis
Criss-Cross segment analysis (e.g. Product X Application)
Competitive Product Benchmarking
Geographic Analysis
Additional countries in any of the regions
Customized Data Representation
Detailed analysis and profiling of additional market players
The Content Analytics Market was valued at USD 8.2 Billion in 2023 and will reach USD 38.0 Billion by 2032, growing at a CAGR of 18.69% by 2032.
The Robotic Process Automation in BFSI Market Size was valued at USD 1.12 Billion in 2023 and will reach USD 20.48 Billion by 2032 and CAGR of 38.2% by 2032.
Harbor Management Software Market was valued at USD 1.32 billion in 2023 and is expected to reach USD 3.14 billion by 2032, growing at a CAGR of 10.19% from 2024-2032.
The Infrastructure as Code (IaC) market was valued at USD 917.3 million in 2023 and is expected to reach USD 5869.3 million by 2032, growing at a CAGR of 22.92% from 2024-2032.
The Banking As a Service Market size was USD 21.27 billion in 2023 and is expected to Reach USD 85.73 billion by 2032 and grow at a CAGR of 16.76% over the forecast period of 2024-2032.
The Generative AI Chipset Market Size was valued at USD 37.29 Billion in 2023 and will reach USD 454.50 Billion by 2032 and grow at a CAGR of 32.2% by 2032.

Hi! Click one of our member below to chat on Phone
© 2025 All Rights Reserved by SNS Insider Pvt Ltd


