image

Spintronics Market Size & Overview:

Spintronics Market Revenue Analysis

Get More Information on Spintronics Market - Request Sample Report

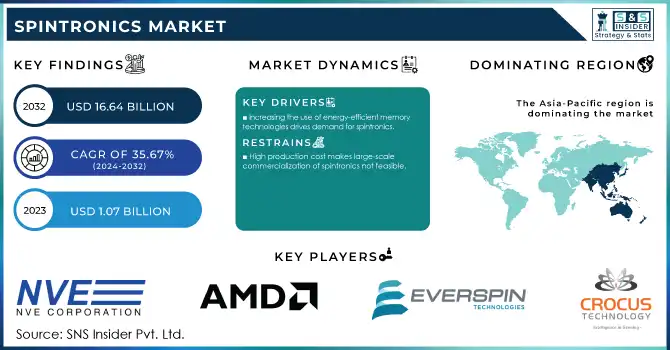
The Spintronics Market Size was valued at USD 1.07 Billion in 2023 and is expected to reach USD 16.64 Billion by 2032 and grow at a CAGR of 35.67% over the forecast period 2024-2032.

The Spintronics Market, blending quantum mechanics and electronics, is swiftly progressing worldwide. Spintronics, an abbreviation for spin transport electronics, utilizes the quantum characteristic of electron spin alongside charge, facilitating ground-breaking advancements in data storage, sensing, and processing. Main countries fuelling this expansion feature the U.S., Japan, China, Germany, France, and India, all of which are emphasizing semiconductor advancement. For example, the U.S. government has significantly invested in spintronics research as part of its quantum technology initiatives, and Japan has also established industry-academic collaborations to commercialize advanced spintronic devices. Likewise, China's Ministry of Science and Technology has also allocated a huge amount in 2023 to enhance spintronic development in its semiconductor industry.

Technological breakthroughs remain the epitome of the growth potential in this market. Advances in MRAM and extra-sensitive magnetic sensors are truly changing energy efficiency and high-performance benchmarks for industries such as aerospace and automotive systems. Leading firms in 2023 developed advanced German and French versions of their MRAM, which supports the emerging requirements for memory-intensive, power-efficient memory for AI-intensive applications, while India has been encouraged by such government initiatives in building cost-competitive and scalable technologies along these lines.

The recent launches, which include such things as the next generations of magnetic sensors for implementation in autonomous vehicles, advance precision in both navigation systems and safety mechanisms. Furthermore, spintronics outside of automotive continues to expand into healthcare and consumer electronics with compact efficient memory solution applications.

Future applications have the potential for exponential expansion in quantum computing, robotics, and edge computing-based applications. For instance, integrating MRAM in data centers is likely to save up to 30% in terms of energy consumption-a major goal of sustainability on the global level. Other initiatives are government policies within the Europe, Asia-Pacific and U.S. encouraging the R&D in the domain of spintronics. Technological innovation with strategic investments is thus creating a transformative trajectory for the market of spintronics. As a result, this becomes the pivot area of interest among various industries and governments globally.

Spintronics Market Dynamics

KEY DRIVERS: 

  • Increasing the use of energy-efficient memory technologies drives demand for spintronics.

As energy efficiency is taken up as a global objective, solutions based on spintronics, such as MRAM, are gradually becoming popular. Traditional memory devices, such as DRAM and SRAM, consume considerable amounts of energy, especially in data centers. MRAM, based on principles of spintronics, ensures ultra-low power consumption along with greater durability. The U.S. Department of Energy emphasizes a 30% possible decrease in energy consumption for data centers through the use of MRAM.

Moreover, industry sources indicate that MRAM's writing endurance surpasses 10^12 cycles, greatly exceeding that of conventional flash memory. This change corresponds with global sustainability objectives, as nations such as Germany and Japan promote environmentally friendly technologies. The scalability and performance of MRAM render it essential for cloud computing, IoT devices, and edge computing, speeding up its integration into various sectors.

  • Increased safety and automation requirements drive spintronic sensor implementation in vehicles.

Advanced driver assistance systems and autonomous driving in the automotive sector are highly dependent on precise magnetic sensors, a fundamental application of spintronics. These sensors guarantee correct rotational and positional information to be detected, which are essential for safety features such as anti-lock braking systems and navigation. Industry reports claim that magnetic sensors have increased the efficiency by 25% as compared to Hall effect sensors.

The governments in China and India are supporting electric vehicles, offering them subsidies and tax incentives. These will indirectly enhance the components of spintronics. In Japan, car manufacturers are using spintronic sensors to enhance their performance and meet strict environmental regulations. With innovation the core focus of the automotive industry, spintronic sensors will surely transform vehicle systems.

RESTRAIN:

  • High production cost makes large-scale commercialization of spintronics not feasible.

Though it has many advantages, the market for spintronics faces major obstacles in the high cost of raw materials and complicated manufacturing process. Spintronic devices need fabrication technologies like molecular beam epitaxy, which is quite expensive and needs highly specialized equipment and human expertise. Industry sources have reported that the cost of manufacturing spintronic components is 40% higher than the semiconductor counterparts. Furthermore, even rare earth magnets, like the ones in spintronic sensors, have raw materials whose price fluctuation inflates cost.

There have been reports from countries, such as the U.S. and China, who have documented this hurdle as a constraint, hence their investment in R&D into making it easier for manufacturing. Until there are serious breakthroughs in more efficient and cheap production, spintronics technology cannot be adopted widely. This restraint requires collective efforts by academia, industries, and governments to develop scalable production techniques.

Spintronics Market Segmentation Analysis

BY PRODUCT TYPE

Sensors segment dominated in 2023 with a 38% market share as these are widely applied in automotive, healthcare, and industrial automation applications. Magnetic sensors, capitalizing on spintronic technology, are unmatched for sensitivity and reliability and represent a crucial element of ADAS, safety-critical systems.

Memory segment is projected to grow with the CAGR of 36.28% during the 2024-2032 forecast period due to transformative potential in data storage, for example, MRAM combines non-volatility with high-speed performance to meet emerging energy-efficient memory requirements in both data centers and consumer electronics. Recent technological advancements and government policies supporting semiconductor innovation have significantly accelerated the development and deployment of these product types. The increasing integration of spintronic products into emerging technologies positions this market segment for robust growth.

BY APPLICATION

The Magnetic Sensors segment led in 2023 with 32% market share, which reflects the critical role of magnetic sensors in enhancing automotive safety and industrial automation systems. Magnetic sensors are used to detect magnetic fields with high precision, making them indispensable in applications such as navigation and medical imaging.

The MRAM segment is expected to grow with the fastest CAGR of 36.73% during the forecast period of 2024-2032. This growth is due to the growing energy-efficient memory demand in data centers and IoT devices. Governments of regions like Europe and Asia-Pacific are actually funding R&D projects on spintronic applications. This would further expedite the growth of these technologies. The application of this technology in quantum computing and advanced robotics is also seen to open up newer prospects.

Spintronics Market Regional Overview

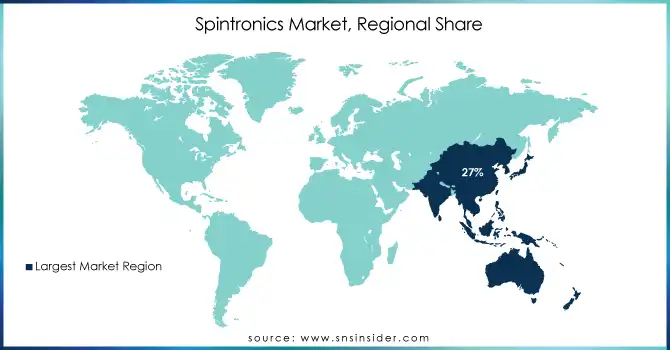
The region leading in 2023 with 27% share in the market is the Asia-Pacific region, stimulated by strong semiconductor manufacturing in nations like China, Japan, and South Korea. Various government initiatives, as demonstrated by China's "Made in China 2025" program, with domestic semiconductor innovation, boost spintronics R&D.

Europe is expected to be the fastest-growing market with a CAGR of 36.98% in the forecast period 2024-2032. This growth is supported by significant investments in quantum technology and sustainability-focused projects. Germany and France are leaders in this regard, where spintronics are used for energy-efficient solutions in industrial and automotive applications. Governments and private sectors worldwide are making collaborative efforts to create a dynamic and competitive landscape for the spintronics market.

Spintronics-Market-Regional-Share

Get Customized Report as per Your Business Requirement - Enquiry Now

KEY PLAYERS 

Some of the major players in the Spintronics Market are  

  • NVE Corporation (MRAM chips, GMR sensors)

  • Advanced Micro Devices (AMD) (MRAM solutions, magnetic memory)

  • Crocus Technology (magnetic sensors, TMR memory)

  • Everspin Technologies (MRAM products, spintronic memory)

  • Avalanche Technology (MRAM memory, aerospace solutions)

  • Intel Corporation (MRAM storage, spintronic sensors)

  • Samsung Electronics (STT-MRAM, memory modules)

  • IBM Corporation (quantum spintronic research, MRAM devices)

  • Hitachi Metals (magnetic materials, spintronic sensors)

  • Toshiba Corporation (MRAM storage, memory technologies)

  • Fujitsu Limited (magnetic sensors, spintronic R&D)

  • Micron Technology (spintronic memory, MRAM systems)

  • Seagate Technology (hard disk drives, spintronic sensors)

  • Western Digital Corporation (hard disks, MRAM memory)

  • Sony Corporation (spintronic sensors, advanced memory)

  • Applied Materials (spintronic manufacturing tools, MRAM systems)

  • GlobalFoundries (STT-MRAM, semiconductor solutions)

  • TSMC (Taiwan Semiconductor Manufacturing Company) (spintronic wafer production, MRAM chips)

  • Infineon Technologies (automotive sensors, spintronic components)

  • Qualcomm Technologies (low-power memory, spintronic R&D).

MAJOR SUPPLIERS (Components, Technologies)

  • AMG Advanced Metallurgical Group (specialty metals, rare earth materials)

  • Hitachi Metals (magnetic materials, ferrite cores)

  • Shin-Etsu Chemical (semiconductor-grade silicon, magnetic materials)

  • TDK Corporation (magnetic components, ferrite cores)

  • Materion Corporation (beryllium alloys, rare earth magnets)

  • Sumitomo Metal Mining Co. (rare earth elements, cobalt materials)

  • Nichia Corporation (magnetic materials, phosphors)

  • Daido Steel Co. (alloy materials, specialty steel)

  • Showa Denko K.K. (hard disk substrates, magnetic materials)

  • Heraeus Group (precious metals, conductive materials).

MAJOR CLIENTS

  • Tesla Inc.

  • Apple Inc.

  • Google LLC

  • Amazon Web Services (AWS)

  • General Electric

  • Toyota Motor Corporation

  • Intel Corporation

  • Samsung Electronics

  • IBM Corporation

  • Siemens AG

RECENT TRENDS

  • June 2024: USD 400,000 award went to NVE Corp., of Eden Prairie from Minnesota Department of Employment and Economic Development, commonly referred to as DEED. Awards provide financing through the Minnesota Investment Fund (MIF), which helps in the addition of new workers and the retaining of high-quality jobs toward industrial, manufacturing and technology-based industries.

  • August 2023: Allegro MicroSystems announced that it has entered into a definitive agreement to acquire Crocus Technology, a developer of magnetic sensors based on tunnel-magnetoresistance (TMR) technology. The transaction is valued at USD 420 million and will be paid in cash.

Spintronics Market Report Scope:

Report Attributes Details
Market Size in 2023 USD 1.07 Billion
Market Size by 2032 USD 16.64 Billion
CAGR CAGR of 35.67 % From 2024 to 2032
Base Year 2023
Forecast Period 2024-2032
Historical Data 2020-2022
Report Scope & Coverage Market Size, Segments Analysis, Competitive  Landscape, Regional Analysis, DROC & SWOT Analysis, Forecast Outlook
Key Segments • By Device Type (Semiconductor Based Spintronics, Metallic Based Spintronics, Alloy Based Spintronics),
• By Product Type (Sensors, Memory, Others)
• By Application (Magnetic Sensors, Spintronic Couplers, MRAM, Hard Disks, Microwave Devices)
Regional Analysis/Coverage North America (US, Canada, Mexico), Europe (Eastern Europe [Poland, Romania, Hungary, Turkey, Rest of Eastern Europe] Western Europe] Germany, France, UK, Italy, Spain, Netherlands, Switzerland, Austria, Rest of Western Europe]), Asia Pacific (China, India, Japan, South Korea, Vietnam, Singapore, Australia, Rest of Asia Pacific), Middle East & Africa (Middle East [UAE, Egypt, Saudi Arabia, Qatar, Rest of Middle East], Africa [Nigeria, South Africa, Rest of Africa], Latin America (Brazil, Argentina, Colombia, Rest of Latin America)
Company Profiles NVE Corporation, Advanced Micro Devices, Crocus Technology, Everspin Technologies, Avalanche Technology, Intel Corporation, Samsung Electronics, IBM Corporation, Hitachi Metals, Toshiba Corporation, Fujitsu Limited, Micron Technology, Seagate Technology, Western Digital Corporation, Sony Corporation, Applied Materials, GlobalFoundries, TSMC, Infineon Technologies, Qualcomm Technologies.
Key Drivers • Increasing the use of energy-efficient memory technologies drives demand for spintronics.
• Increased safety and automation requirements drive spintronic sensor implementation in vehicles.
Restraints • High production cost makes large-scale commercialization of spintronics not feasible.

Frequently Asked Questions

Ans: The Spintronics Market is expected to grow at a CAGR of 35.67% during 2024-2032.

Ans: Asia Pacific dominated the Spintronics Market in 2023.

Ans: The Sensor segment dominated the Spintronics Market.

Ans: The major growth factors of the Spintronics Market is Increasing use of energy-efficient memory technologies. 

Ans: Spintronics Market size was USD 1.07 Billion in 2023 and is expected to Reach USD 16.64 Billion by 2032.

TABLE OF CONTENT

1. Introduction

1.1 Market Definition

1.2 Scope (Inclusion and Exclusions)

1.3 Research Assumptions

2. Executive Summary

2.1 Market Overview

2.2 Regional Synopsis

2.3 Competitive Summary

3. Research Methodology

3.1 Top-Down Approach

3.2 Bottom-up Approach

3.3. Data Validation

3.4 Primary Interviews

4. Market Dynamics Impact Analysis

4.1 Market Driving Factors Analysis

4.1.1 Drivers

4.1.2 Restraints

4.2 PESTLE Analysis

4.3 Porter’s Five Forces Model

5. Statistical Insights and Trends Reporting

5.1 Key Vendors and Feature Analysis, 2023

5.2 Performance Benchmarks, 2023

5.3 Integration Capabilities, by Software

5.4 Usage Statistics, 2023

6. Competitive Landscape

6.1 List of Major Companies, By Region

6.2 Market Share Analysis, By Region

6.3 Product Benchmarking

6.3.1 Product specifications and features

6.3.2 Pricing

6.4 Strategic Initiatives

6.4.1 Marketing and promotional activities

6.4.2 Distribution and Supply Chain Strategies

6.4.3 Expansion plans and new product launches

6.4.4 Strategic partnerships and collaborations

6.5 Technological Advancements

6.6 Market Positioning and Branding

7. Spintronics Market Segmentation, By Device Type

7.1 Chapter Overview

7.2 Semiconductor Based Spintronics

7.2.1 Semiconductor Based Spintronics Market Trends Analysis (2020-2032)

7.2.2 Semiconductor Based Spintronics Market Size Estimates and Forecasts to 2032 (USD Billion)

7.3 Metallic Based Spintronics

7.3.1 Metallic Based Spintronics Market Trends Analysis (2020-2032)

7.3.2 Metallic Based Spintronics Market Size Estimates and Forecasts to 2032 (USD Billion)

7.4 Alloy Based Spintronics

7.4.1 Alloy Based Spintronics Market Trends Analysis (2020-2032)

7.4.2 Alloy Based Spintronics Market Size Estimates and Forecasts to 2032 (USD Billion)

8. Spintronics Market Segmentation, By Product Type

     8.1 Chapter Overview

8.2 Sensors

8.2.1 Sensors Market Trends Analysis (2020-2032)

8.2.2 Sensors Market Size Estimates and Forecasts to 2032 (USD Billion)

8.3 Memory

8.3.1 Memory Market Trends Analysis (2020-2032)

8.3.2 Memory Market Size Estimates and Forecasts to 2032 (USD Billion)

8.4 Others

8.4.1 Others Market Trends Analysis (2020-2032)

8.4.2 Others Market Size Estimates and Forecasts to 2032 (USD Billion)

9. Spintronics Market Segmentation, By Application

     9.1 Chapter Overview

9.2 Magnetic Sensors

9.2.1 Magnetic Sensors Market Trends Analysis (2020-2032)

9.2.2 Magnetic Sensors Market Size Estimates and Forecasts to 2032 (USD Billion)

9.3 Spintronic Couplers

9.3.1 Spintronic Couplers Market Trends Analysis (2020-2032)

9.3.2 Spintronic Couplers Market Size Estimates and Forecasts to 2032 (USD Billion)

9.4 MRAM

9.4.1 MRAM Market Trends Analysis (2020-2032)

9.4.2 MRAM Market Size Estimates and Forecasts to 2032 (USD Billion)

9.5 Hard Disks

9.5.1 Hard Disks Market Trends Analysis (2020-2032)

9.5.2 Hard Disks Market Size Estimates and Forecasts to 2032 (USD Billion)

9.6 Microwave Devices

9.6.1 Microwave Devices Market Trends Analysis (2020-2032)

9.6.2 Microwave Devices Market Size Estimates and Forecasts to 2032 (USD Billion)

10. Regional Analysis

10.1 Chapter Overview

10.2 North America

10.2.1 Trends Analysis

10.2.2 North America Spintronics Market Estimates and Forecasts, by Country (2020-2032) (USD Billion)

10.2.3 North America Spintronics Market Estimates and Forecasts, By Application (2020-2032) (USD Billion)  

10.2.4 North America Spintronics Market Estimates and Forecasts, By Device Type (2020-2032) (USD Billion)

10.2.5 North America Spintronics Market Estimates and Forecasts, By Product Type (2020-2032) (USD Billion)

10.2.6 USA

10.2.6.1 USA Spintronics Market Estimates and Forecasts, By Application (2020-2032) (USD Billion)

10.2.6.2 USA Spintronics Market Estimates and Forecasts, By Device Type (2020-2032) (USD Billion)

10.2.6.3 USA Spintronics Market Estimates and Forecasts, By Product Type (2020-2032) (USD Billion)

10.2.7 Canada

10.2.7.1 Canada Spintronics Market Estimates and Forecasts, By Application (2020-2032) (USD Billion)

10.2.7.2 Canada Spintronics Market Estimates and Forecasts, By Device Type (2020-2032) (USD Billion)

10.2.7.3 Canada Spintronics Market Estimates and Forecasts, By Product Type (2020-2032) (USD Billion)

10.2.8 Mexico

10.2.8.1 Mexico Spintronics Market Estimates and Forecasts, By Application (2020-2032) (USD Billion)

10.2.8.2 Mexico Spintronics Market Estimates and Forecasts, By Device Type (2020-2032) (USD Billion)

10.2.8.3 Mexico Spintronics Market Estimates and Forecasts, By Product Type (2020-2032) (USD Billion)

10.3 Europe

10.3.1 Eastern Europe

10.3.1.1 Trends Analysis

10.3.1.2 Eastern Europe Spintronics Market Estimates and Forecasts, by Country (2020-2032) (USD Billion)

10.3.1.3 Eastern Europe Spintronics Market Estimates and Forecasts, By Application (2020-2032) (USD Billion)  

10.3.1.4 Eastern Europe Spintronics Market Estimates and Forecasts, By Device Type (2020-2032) (USD Billion)

10.3.1.5 Eastern Europe Spintronics Market Estimates and Forecasts, By Product Type (2020-2032) (USD Billion)

10.3.1.6 Poland

10.3.1.6.1 Poland Spintronics Market Estimates and Forecasts, By Application (2020-2032) (USD Billion)

10.3.1.6.2 Poland Spintronics Market Estimates and Forecasts, By Device Type (2020-2032) (USD Billion)

10.3.1.6.3 Poland Spintronics Market Estimates and Forecasts, By Product Type (2020-2032) (USD Billion)

10.3.1.7 Romania

10.3.1.7.1 Romania Spintronics Market Estimates and Forecasts, By Application (2020-2032) (USD Billion)

10.3.1.7.2 Romania Spintronics Market Estimates and Forecasts, By Device Type (2020-2032) (USD Billion)

10.3.1.7.3 Romania Spintronics Market Estimates and Forecasts, By Product Type (2020-2032) (USD Billion)

10.3.1.8 Hungary

10.3.1.8.1 Hungary Spintronics Market Estimates and Forecasts, By Application (2020-2032) (USD Billion)

10.3.1.8.2 Hungary Spintronics Market Estimates and Forecasts, By Device Type (2020-2032) (USD Billion)

10.3.1.8.3 Hungary Spintronics Market Estimates and Forecasts, By Product Type (2020-2032) (USD Billion)

10.3.1.9 Turkey

10.3.1.9.1 Turkey Spintronics Market Estimates and Forecasts, By Application (2020-2032) (USD Billion)

10.3.1.9.2 Turkey Spintronics Market Estimates and Forecasts, By Device Type (2020-2032) (USD Billion)

10.3.1.9.3 Turkey Spintronics Market Estimates and Forecasts, By Product Type (2020-2032) (USD Billion)

10.3.1.10 Rest of Eastern Europe

10.3.1.10.1 Rest of Eastern Europe Spintronics Market Estimates and Forecasts, By Application (2020-2032) (USD Billion)

10.3.1.10.2 Rest of Eastern Europe Spintronics Market Estimates and Forecasts, By Device Type (2020-2032) (USD Billion)

10.3.1.10.3 Rest of Eastern Europe Spintronics Market Estimates and Forecasts, By Product Type (2020-2032) (USD Billion)

10.3.2 Western Europe

10.3.2.1 Trends Analysis

10.3.2.2 Western Europe Spintronics Market Estimates and Forecasts, by Country (2020-2032) (USD Billion)

10.3.2.3 Western Europe Spintronics Market Estimates and Forecasts, By Application (2020-2032) (USD Billion)  

10.3.2.4 Western Europe Spintronics Market Estimates and Forecasts, By Device Type (2020-2032) (USD Billion)

10.3.2.5 Western Europe Spintronics Market Estimates and Forecasts, By Product Type (2020-2032) (USD Billion)

10.3.2.6 Germany

10.3.2.6.1 Germany Spintronics Market Estimates and Forecasts, By Application (2020-2032) (USD Billion)

10.3.2.6.2 Germany Spintronics Market Estimates and Forecasts, By Device Type (2020-2032) (USD Billion)

10.3.2.6.3 Germany Spintronics Market Estimates and Forecasts, By Product Type (2020-2032) (USD Billion)

10.3.2.7 France

10.3.2.7.1 France Spintronics Market Estimates and Forecasts, By Application (2020-2032) (USD Billion)

10.3.2.7.2 France Spintronics Market Estimates and Forecasts, By Device Type (2020-2032) (USD Billion)

10.3.2.7.3 France Spintronics Market Estimates and Forecasts, By Product Type (2020-2032) (USD Billion)

10.3.2.8 UK

10.3.2.8.1 UK Spintronics Market Estimates and Forecasts, By Application (2020-2032) (USD Billion)

10.3.2.8.2 UK Spintronics Market Estimates and Forecasts, By Device Type (2020-2032) (USD Billion)

10.3.2.8.3 UK Spintronics Market Estimates and Forecasts, By Product Type (2020-2032) (USD Billion)

10.3.2.9 Italy

10.3.2.9.1 Italy Spintronics Market Estimates and Forecasts, By Application (2020-2032) (USD Billion)

10.3.2.9.2 Italy Spintronics Market Estimates and Forecasts, By Device Type (2020-2032) (USD Billion)

10.3.2.9.3 Italy Spintronics Market Estimates and Forecasts, By Product Type (2020-2032) (USD Billion)

10.3.2.10 Spain

10.3.2.10.1 Spain Spintronics Market Estimates and Forecasts, By Application (2020-2032) (USD Billion)

10.3.2.10.2 Spain Spintronics Market Estimates and Forecasts, By Device Type (2020-2032) (USD Billion)

10.3.2.10.3 Spain Spintronics Market Estimates and Forecasts, By Product Type (2020-2032) (USD Billion)

10.3.2.11 Netherlands

10.3.2.11.1 Netherlands Spintronics Market Estimates and Forecasts, By Application (2020-2032) (USD Billion)

10.3.2.11.2 Netherlands Spintronics Market Estimates and Forecasts, By Device Type (2020-2032) (USD Billion)

10.3.2.11.3 Netherlands Spintronics Market Estimates and Forecasts, By Product Type (2020-2032) (USD Billion)

10.3.2.12 Switzerland

10.3.2.12.1 Switzerland Spintronics Market Estimates and Forecasts, By Application (2020-2032) (USD Billion)

10.3.2.12.2 Switzerland Spintronics Market Estimates and Forecasts, By Device Type (2020-2032) (USD Billion)

10.3.2.12.3 Switzerland Spintronics Market Estimates and Forecasts, By Product Type (2020-2032) (USD Billion)

10.3.2.13 Austria

10.3.2.13.1 Austria Spintronics Market Estimates and Forecasts, By Application (2020-2032) (USD Billion)

10.3.2.13.2 Austria Spintronics Market Estimates and Forecasts, By Device Type (2020-2032) (USD Billion)

10.3.2.13.3 Austria Spintronics Market Estimates and Forecasts, By Product Type (2020-2032) (USD Billion)

10.3.2.14 Rest of Western Europe

10.3.2.14.1 Rest of Western Europe Spintronics Market Estimates and Forecasts, By Application (2020-2032) (USD Billion)

10.3.2.14.2 Rest of Western Europe Spintronics Market Estimates and Forecasts, By Device Type (2020-2032) (USD Billion)

10.3.2.14.3 Rest of Western Europe Spintronics Market Estimates and Forecasts, By Product Type (2020-2032) (USD Billion)

10.4 Asia Pacific

10.4.1 Trends Analysis

10.4.2 Asia Pacific Spintronics Market Estimates and Forecasts, by Country (2020-2032) (USD Billion)

10.4.3 Asia Pacific Spintronics Market Estimates and Forecasts, By Application (2020-2032) (USD Billion)  

10.4.4 Asia Pacific Spintronics Market Estimates and Forecasts, By Device Type (2020-2032) (USD Billion)

10.4.5 Asia Pacific Spintronics Market Estimates and Forecasts, By Product Type (2020-2032) (USD Billion)

10.4.6 China

10.4.6.1 China Spintronics Market Estimates and Forecasts, By Application (2020-2032) (USD Billion)

10.4.6.2 China Spintronics Market Estimates and Forecasts, By Device Type (2020-2032) (USD Billion)

10.4.6.3 China Spintronics Market Estimates and Forecasts, By Product Type (2020-2032) (USD Billion)

10.4.7 India

10.4.7.1 India Spintronics Market Estimates and Forecasts, By Application (2020-2032) (USD Billion)

10.4.7.2 India Spintronics Market Estimates and Forecasts, By Device Type (2020-2032) (USD Billion)

10.4.7.3 India Spintronics Market Estimates and Forecasts, By Product Type (2020-2032) (USD Billion)

10.4.8 Japan

10.4.8.1 Japan Spintronics Market Estimates and Forecasts, By Application (2020-2032) (USD Billion)

10.4.8.2 Japan Spintronics Market Estimates and Forecasts, By Device Type (2020-2032) (USD Billion)

10.4.8.3 Japan Spintronics Market Estimates and Forecasts, By Product Type (2020-2032) (USD Billion)

10.4.9 South Korea

10.4.9.1 South Korea Spintronics Market Estimates and Forecasts, By Application (2020-2032) (USD Billion)

10.4.9.2 South Korea Spintronics Market Estimates and Forecasts, By Device Type (2020-2032) (USD Billion)

10.4.9.3 South Korea Spintronics Market Estimates and Forecasts, By Product Type (2020-2032) (USD Billion)

10.4.10 Vietnam

10.4.10.1 Vietnam Spintronics Market Estimates and Forecasts, By Application (2020-2032) (USD Billion)

10.4.10.2 Vietnam Spintronics Market Estimates and Forecasts, By Device Type (2020-2032) (USD Billion)

10.4.10.3 Vietnam Spintronics Market Estimates and Forecasts, By Product Type (2020-2032) (USD Billion)

10.4.11 Singapore

10.4.11.1 Singapore Spintronics Market Estimates and Forecasts, By Application (2020-2032) (USD Billion)

10.4.11.2 Singapore Spintronics Market Estimates and Forecasts, By Device Type (2020-2032) (USD Billion)

10.4.11.3 Singapore Spintronics Market Estimates and Forecasts, By Product Type (2020-2032) (USD Billion)

10.4.12 Australia

10.4.12.1 Australia Spintronics Market Estimates and Forecasts, By Application (2020-2032) (USD Billion)

10.4.12.2 Australia Spintronics Market Estimates and Forecasts, By Device Type (2020-2032) (USD Billion)

10.4.12.3 Australia Spintronics Market Estimates and Forecasts, By Product Type (2020-2032) (USD Billion)

10.4.13 Rest of Asia Pacific

10.4.13.1 Rest of Asia Pacific Spintronics Market Estimates and Forecasts, By Application (2020-2032) (USD Billion)

10.4.13.2 Rest of Asia Pacific Spintronics Market Estimates and Forecasts, By Device Type (2020-2032) (USD Billion)

10.4.13.3 Rest of Asia Pacific Spintronics Market Estimates and Forecasts, By Product Type (2020-2032) (USD Billion)

10.5 Middle East and Africa

10.5.1 Middle East

10.5.1.1 Trends Analysis

10.5.1.2 Middle East Spintronics Market Estimates and Forecasts, by Country (2020-2032) (USD Billion)

10.5.1.3 Middle East Spintronics Market Estimates and Forecasts, By Application (2020-2032) (USD Billion)  

10.5.1.4 Middle East Spintronics Market Estimates and Forecasts, By Device Type (2020-2032) (USD Billion)

10.5.1.5 Middle East Spintronics Market Estimates and Forecasts, By Product Type (2020-2032) (USD Billion)

10.5.1.6 UAE

10.5.1.6.1 UAE Spintronics Market Estimates and Forecasts, By Application (2020-2032) (USD Billion)

10.5.1.6.2 UAE Spintronics Market Estimates and Forecasts, By Device Type (2020-2032) (USD Billion)

10.5.1.6.3 UAE Spintronics Market Estimates and Forecasts, By Product Type (2020-2032) (USD Billion)

10.5.1.7 Egypt

10.5.1.7.1 Egypt Spintronics Market Estimates and Forecasts, By Application (2020-2032) (USD Billion)

10.5.1.7.2 Egypt Spintronics Market Estimates and Forecasts, By Device Type (2020-2032) (USD Billion)

10.5.1.7.3 Egypt Spintronics Market Estimates and Forecasts, By Product Type (2020-2032) (USD Billion)

10.5.1.8 Saudi Arabia

10.5.1.8.1 Saudi Arabia Spintronics Market Estimates and Forecasts, By Application (2020-2032) (USD Billion)

10.5.1.8.2 Saudi Arabia Spintronics Market Estimates and Forecasts, By Device Type (2020-2032) (USD Billion)

10.5.1.8.3 Saudi Arabia Spintronics Market Estimates and Forecasts, By Product Type (2020-2032) (USD Billion)

10.5.1.9 Qatar

10.5.1.9.1 Qatar Spintronics Market Estimates and Forecasts, By Application (2020-2032) (USD Billion)

10.5.1.9.2 Qatar Spintronics Market Estimates and Forecasts, By Device Type (2020-2032) (USD Billion)

10.5.1.9.3 Qatar Spintronics Market Estimates and Forecasts, By Product Type (2020-2032) (USD Billion)

10.5.1.10 Rest of Middle East

10.5.1.10.1 Rest of Middle East Spintronics Market Estimates and Forecasts, By Application (2020-2032) (USD Billion)

10.5.1.10.2 Rest of Middle East Spintronics Market Estimates and Forecasts, By Device Type (2020-2032) (USD Billion)

10.5.1.10.3 Rest of Middle East Spintronics Market Estimates and Forecasts, By Product Type (2020-2032) (USD Billion)

10.5.2 Africa

10.5.2.1 Trends Analysis

10.5.2.2 Africa Spintronics Market Estimates and Forecasts, by Country (2020-2032) (USD Billion)

10.5.2.3 Africa Spintronics Market Estimates and Forecasts, By Application (2020-2032) (USD Billion)  

10.5.2.4 Africa Spintronics Market Estimates and Forecasts, By Device Type (2020-2032) (USD Billion)

10.5.2.5 Africa Spintronics Market Estimates and Forecasts, By Product Type (2020-2032) (USD Billion)

10.5.2.6 South Africa

10.5.2.6.1 South Africa Spintronics Market Estimates and Forecasts, By Application (2020-2032) (USD Billion)

10.5.2.6.2 South Africa Spintronics Market Estimates and Forecasts, By Device Type (2020-2032) (USD Billion)

10.5.2.6.3 South Africa Spintronics Market Estimates and Forecasts, By Product Type (2020-2032) (USD Billion)

10.5.2.7 Nigeria

10.5.2.7.1 Nigeria Spintronics Market Estimates and Forecasts, By Application (2020-2032) (USD Billion)

10.5.2.7.2 Nigeria Spintronics Market Estimates and Forecasts, By Device Type (2020-2032) (USD Billion)

10.5.2.7.3 Nigeria Spintronics Market Estimates and Forecasts, By Product Type (2020-2032) (USD Billion)

10.5.2.8 Rest of Africa

10.5.2.8.1 Rest of Africa Spintronics Market Estimates and Forecasts, By Application (2020-2032) (USD Billion)

10.5.2.8.2 Rest of Africa Spintronics Market Estimates and Forecasts, By Device Type (2020-2032) (USD Billion)

10.5.2.8.3 Rest of Africa Spintronics Market Estimates and Forecasts, By Product Type (2020-2032) (USD Billion)

10.6 Latin America

10.6.1 Trends Analysis

10.6.2 Latin America Spintronics Market Estimates and Forecasts, by Country (2020-2032) (USD Billion)

10.6.3 Latin America Spintronics Market Estimates and Forecasts, By Application (2020-2032) (USD Billion)  

10.6.4 Latin America Spintronics Market Estimates and Forecasts, By Device Type (2020-2032) (USD Billion)

10.6.5 Latin America Spintronics Market Estimates and Forecasts, By Product Type (2020-2032) (USD Billion)

10.6.6 Brazil

10.6.6.1 Brazil Spintronics Market Estimates and Forecasts, By Application (2020-2032) (USD Billion)

10.6.6.2 Brazil Spintronics Market Estimates and Forecasts, By Device Type (2020-2032) (USD Billion)

10.6.6.3 Brazil Spintronics Market Estimates and Forecasts, By Product Type (2020-2032) (USD Billion)

10.6.7 Argentina

10.6.7.1 Argentina Spintronics Market Estimates and Forecasts, By Application (2020-2032) (USD Billion)

10.6.7.2 Argentina Spintronics Market Estimates and Forecasts, By Device Type (2020-2032) (USD Billion)

10.6.7.3 Argentina Spintronics Market Estimates and Forecasts, By Product Type (2020-2032) (USD Billion)

10.6.8 Colombia

10.6.8.1 Colombia Spintronics Market Estimates and Forecasts, By Application (2020-2032) (USD Billion)

10.6.8.2 Colombia Spintronics Market Estimates and Forecasts, By Device Type (2020-2032) (USD Billion)

10.6.8.3 Colombia Spintronics Market Estimates and Forecasts, By Product Type (2020-2032) (USD Billion)

10.6.9 Rest of Latin America

10.6.9.1 Rest of Latin America Spintronics Market Estimates and Forecasts, By Application (2020-2032) (USD Billion)

10.6.9.2 Rest of Latin America Spintronics Market Estimates and Forecasts, By Device Type (2020-2032) (USD Billion)

10.6.9.3 Rest of Latin America Spintronics Market Estimates and Forecasts, By Product Type (2020-2032) (USD Billion)

11. Company Profiles

11.1 NVE Corporation

11.1.1 Company Overview

11.1.2 Financial

11.1.3 Products/ Services Offered

11.1.4 SWOT Analysis

11.2 Advanced Micro Devices

11.2.1 Company Overview

11.2.2 Financial

11.2.3 Products/ Services Offered

11.2.4 SWOT Analysis

11.3 Crocus Technology

11.3.1 Company Overview

11.3.2 Financial

11.3.3 Products/ Services Offered

11.3.4 SWOT Analysis

11.4 Everspin Technologies

11.4.1 Company Overview

11.4.2 Financial

11.4.3 Products/ Services Offered

11.4.4 SWOT Analysis

11.5 Avalanche Technology

11.5.1 Company Overview

11.5.2 Financial

11.5.3 Products/ Services Offered

11.5.4 SWOT Analysis

11.6 Intel Corporation

11.6.1 Company Overview

11.6.2 Financial

11.6.3 Products/ Services Offered

11.6.4 SWOT Analysis

11.7 Samsung Electronics

11.7.1 Company Overview

11.7.2 Financial

11.7.3 Products/ Services Offered

11.7.4 SWOT Analysis

11.8 IBM Corporation

11.8.1 Company Overview

11.8.2 Financial

11.8.3 Products/ Services Offered

11.8.4 SWOT Analysis

11.9 Hitachi Metals

11.9.1 Company Overview

11.9.2 Financial

11.9.3 Products/ Services Offered

11.9.4 SWOT Analysis

11.10 Toshiba Corporation

11.10.1 Company Overview

11.10.2 Financial

11.10.3 Products/ Services Offered

11.10.4 SWOT Analysis

12. Use Cases and Best Practices

13. Conclusion

An accurate research report requires proper strategizing as well as implementation. There are multiple factors involved in the completion of good and accurate research report and selecting the best methodology to compete the research is the toughest part. Since the research reports we provide play a crucial role in any company’s decision-making process, therefore we at SNS Insider always believe that we should choose the best method which gives us results closer to reality. This allows us to reach at a stage wherein we can provide our clients best and accurate investment to output ratio.

Each report that we prepare takes a timeframe of 350-400 business hours for production. Starting from the selection of titles through a couple of in-depth brain storming session to the final QC process before uploading our titles on our website we dedicate around 350 working hours. The titles are selected based on their current market cap and the foreseen CAGR and growth.


The 5 steps process:

Step 1: Secondary Research:

Secondary Research or Desk Research is as the name suggests is a research process wherein, we collect data through the readily available information. In this process we use various paid and unpaid databases which our team has access to and gather data through the same. This includes examining of listed companies’ annual reports, Journals, SEC filling etc. Apart from this our team has access to various associations across the globe across different industries. Lastly, we have exchange relationships with various university as well as individual libraries.

Secondary Research

Step 2: Primary Research

When we talk about primary research, it is a type of study in which the researchers collect relevant data samples directly, rather than relying on previously collected data.  This type of research is focused on gaining content specific facts that can be sued to solve specific problems. Since the collected data is fresh and first hand therefore it makes the study more accurate and genuine.

We at SNS Insider have divided Primary Research into 2 parts.

Part 1 wherein we interview the KOLs of major players as well as the upcoming ones across various geographic regions. This allows us to have their view over the market scenario and acts as an important tool to come closer to the accurate market numbers. As many as 45 paid and unpaid primary interviews are taken from both the demand and supply side of the industry to make sure we land at an accurate judgement and analysis of the market.

This step involves the triangulation of data wherein our team analyses the interview transcripts, online survey responses and observation of on filed participants. The below mentioned chart should give a better understanding of the part 1 of the primary interview.

Primary Research

Part 2: In this part of primary research the data collected via secondary research and the part 1 of the primary research is validated with the interviews from individual consultants and subject matter experts.

Consultants are those set of people who have at least 12 years of experience and expertise within the industry whereas Subject Matter Experts are those with at least 15 years of experience behind their back within the same space. The data with the help of two main processes i.e., FGDs (Focused Group Discussions) and IDs (Individual Discussions). This gives us a 3rd party nonbiased primary view of the market scenario making it a more dependable one while collation of the data pointers.

Step 3: Data Bank Validation

Once all the information is collected via primary and secondary sources, we run that information for data validation. At our intelligence centre our research heads track a lot of information related to the market which includes the quarterly reports, the daily stock prices, and other relevant information. Our data bank server gets updated every fortnight and that is how the information which we collected using our primary and secondary information is revalidated in real time.

Data Bank Validation

Step 4: QA/QC Process

After all the data collection and validation our team does a final level of quality check and quality assurance to get rid of any unwanted or undesired mistakes. This might include but not limited to getting rid of the any typos, duplication of numbers or missing of any important information. The people involved in this process include technical content writers, research heads and graphics people. Once this process is completed the title gets uploader on our platform for our clients to read it.

Step 5: Final QC/QA Process:

This is the last process and comes when the client has ordered the study. In this process a final QA/QC is done before the study is emailed to the client. Since we believe in giving our clients a good experience of our research studies, therefore, to make sure that we do not lack at our end in any way humanly possible we do a final round of quality check and then dispatch the study to the client.

MARKET SEGMENTATION

BY DEVICE TYPE

  • Semiconductor-Based Spintronics

  • Metallic-Based Spintronics

  • Alloy-Based Spintronics

BY PRODUCT TYPE

  • Sensors

  • Memory

  • Others

BY APPLICATION

  • Magnetic Sensors

  • Spintronic Couplers

  • MRAM

  • Hard Disks

  • Microwave Devices

BY MATERIAL TYPE

  • Copper Lead Frames

  • Copper Alloy Lead Frames

  • Lead Frames

  • Iron-Nickel Lead Frames

  • Others

BY PACKAGING TYPE

  • Dual Inline Pin Package

  • Small Outline Package

  • Small Outline Transistor

  • Quad Flat Pack

  • Dual Flat No-Leads

  • Quad Flat No-Leads

  • Flip Chip

  • Others

BY INDUSTRY VERTICAL

  • Consumer Electronics

  • Automotive Electronics

  • Industrial Electronics

  • Telecommunication

  • Others

Request for Segment Customization as per your Business Requirement: Segment Customization Request

REGIONAL COVERAGE

North America

  • US

  • Canada

  • Mexico

Europe

  • Eastern Europe

    • Poland

    • Romania

    • Hungary

    • Turkey

    • Rest of Eastern Europe

  • Western Europe

    • Germany

    • France

    • UK

    • Italy

    • Spain

    • Netherlands

    • Switzerland

    • Austria

    • Rest of Western Europe

Asia Pacific

  • China

  • India

  • Japan

  • South Korea

  • Vietnam

  • Singapore

  • Australia

  • Rest of Asia Pacific

Middle East & Africa

  • Middle East

    • UAE

    • Egypt

    • Saudi Arabia

    • Qatar

    • Rest of the Middle East

  • Africa

    • Nigeria

    • South Africa

    • Rest of Africa

Latin America

  • Brazil

  • Argentina

  • Colombia

  • Rest of Latin America

Request for Country Level Research Report: Country Level Customization Request

Available Customization

With the given market data, SNS Insider offers customization as per the company’s specific needs. The following customization options are available for the report:

  • Product Analysis

  • Criss-Cross segment analysis (e.g. Product X Application)

  • Product Matrix which gives a detailed comparison of product portfolio of each company

  • Geographic Analysis

  • Additional countries in any of the regions

  • Company Information

  • Detailed analysis and profiling of additional market players (Up to five)


  •            5000 (33% Discount)


  •            8950 (40% Discount)


  •            3050 (23% Discount)

Start a Conversation

Hi! Click one of our member below to chat on Phone