image

Speed Sensor Market Key Insights

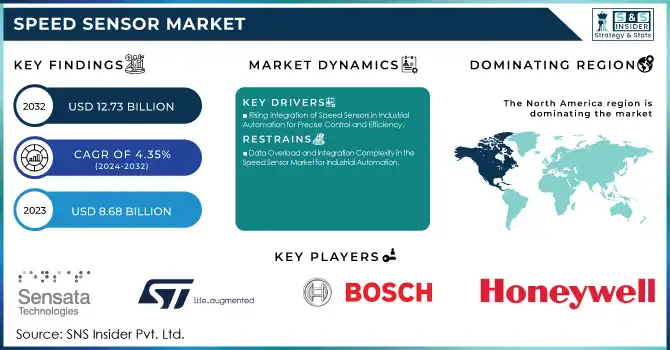
The Speed Sensor Market Size was valued at USD 8.68 Billion in 2023 and is expected to reach USD 12.73 Billion by 2032 and grow at a CAGR of 4.35% over the forecast period 2024-2032.

Speed Sensor Market Revenue Analysis

Get more information on Speed Sensor Market - Request Sample Report

The Speed Sensor Market is experiencing significant growth, driven by the rising demand for fuel efficiency across the automotive and transportation sectors. Global automotive manufacturers are increasingly focusing on enhancing vehicle performance and optimizing fuel consumption. This trend is especially prominent with the rise of electric vehicles (EVs) and autonomous vehicles, which require precise speed measurement technologies. As these markets grow, the need for speed sensors, particularly Hall-effect sensors, has skyrocketed. These sensors play a crucial role in ensuring accurate speed measurement, which directly contributes to fuel optimization and carbon emission reduction, aligning with global sustainability goals.

The transportation industry is undergoing a transformation, with a shift toward fuel-efficient logistics and smarter trucking technologies. This shift has been driven by regulatory pressures and increasing fuel costs, making the adoption of fuel efficiency sensors, including speed sensors, crucial for optimizing fuel usage. Reports indicate that reducing vehicle speed can lead to a 27% improvement in fuel efficiency. Trucks traveling at 60-65 mph (the sweet spot for fuel economy) consume significantly less fuel compared to those traveling at higher speeds. Additionally, fleet operators can improve fuel economy by up to 25% by optimizing driver behavior, as shown in studies comparing the worst and best drivers.

In North America, the trucking industry faces stricter fuel economy standards aiming to reduce fuel consumption, with Class 8 trucks projected to represent 26% of all transportation fuel consumption. This makes speed sensors a key component in meeting regulatory requirements and improving the overall efficiency of heavy-duty vehicles. Furthermore, the growing demand for precision in aerospace and industrial automation applications is also contributing to the increased adoption of speed sensors across diverse industries.

Speed Sensor Market Dynamics

Drivers

  • Rising Integration of Speed Sensors in Industrial Automation for Precise Control and Efficiency

The growing adoption of industrial automation is a significant driver for the speed sensor market, as these sensors play a critical role in enhancing the precision, efficiency, and safety of industrial machinery and equipment. As industries shift towards automated systems to increase production efficiency and reduce operational costs, the demand for high-precision sensors like speed sensors is surging. In manufacturing plants, motion control and automated machinery rely heavily on speed sensors to ensure the accurate and optimal functioning of motors, conveyor belts, and robotic arms. by providing real-time data on rotational speed, these sensors help prevent equipment malfunctions, reduce downtime, and maintain consistent production quality. The use of speed sensors in automated material handling systems and robotic operations helps to streamline processes, improving throughput and reducing human error. Smart factories, which are becoming more prevalent in the industrial sector, leverage sensor technology for advanced predictive maintenance and process optimization. This reduces the need for manual intervention, enhancing both the reliability and longevity of industrial equipment. The digitalization of industrial processes, as highlighted by leaders like Sandvik and EPIQ Machinery, has further accelerated the demand for sophisticated sensors. As industrial automation continues to expand, the ability to monitor and control speed will become even more essential, making speed sensors an integral part of the industrial IoT ecosystem. This growing integration of sensors in automated systems is expected to drive the market for speed sensors, further fueling innovation and technological advancements in the field.

Restraints

  • Data Overload and Integration Complexity in the Speed Sensor Market for Industrial Automation

The rapid adoption of IoT devices in industrial automation has led to a surge in data generation from speed sensors and other monitoring systems. As sensors provide real-time feedback on machine performance, vibration, and motion, the sheer volume of data can overwhelm organizations without the necessary data analytics capabilities. This data overload poses a significant challenge in efficiently processing and analyzing sensor data to derive actionable insights, particularly for companies with limited IT infrastructure or expertise. Integrating these vast data streams from multiple sensors across different systems can lead to integration complexity, hindering smooth data flow and decision-making processes. As companies continue to scale automation, the ability to manage, store, and analyze massive datasets becomes increasingly critical, but the technical and financial costs of data integration remain high. The need for sensor fusion combining data from different sensor types to enhance data accuracy and perception is one method to address this challenge. However, integrating multi-sensor data often requires advanced data processing algorithms and edge computing capabilities, which may not be readily available for all industrial players. The complexity of ensuring data interoperability across multiple platforms and devices increases the risk of system errors or data inconsistencies. As industries strive for smart factories, overcoming the barriers of data overload and integration complexity remains a major hurdle, potentially slowing the widespread adoption of speed sensors in industrial automation.

Speed Sensor Market Segment Overview

by Type

In 2023, the Magnetoresistive (MR) segment is dominating the speed sensor market, accounting for approximately 54% of the total market share. Magnetoresistive sensors are preferred for their high accuracy, sensitivity, and robust performance in detecting speed and motion, especially in harsh industrial environments. These sensors utilize the principle of magnetoresistance, where the resistance of the sensor changes in response to the magnetic field, making them ideal for precise speed measurement. MR sensors offer advantages over traditional technologies, including low power consumption, compact size, and resilience to temperature fluctuations, which makes them highly effective in applications such as automotive, robotics, and industrial machinery. Their ability to operate in diverse environments and deliver reliable data continues to drive the growth of this segment in the speed sensor market.

by Application

In 2023, the automotive segment is leading the speed sensor market, capturing around 49% of the total market share. The widespread adoption of speed sensors in the automotive industry is driven by the increasing demand for advanced driver-assistance systems (ADAS), vehicle safety features, and autonomous driving technologies. Speed sensors play a crucial role in monitoring vehicle speed, wheel rotation, and transmission systems, enhancing vehicle performance, fuel efficiency, and safety. Their integration into anti-lock braking systems (ABS), traction control systems (TCS), and electronic stability control (ESC) further supports their dominance. Additionally, the growth in electric vehicles (EVs) and connected vehicles contributes to the rising demand for speed sensors in the automotive sector.

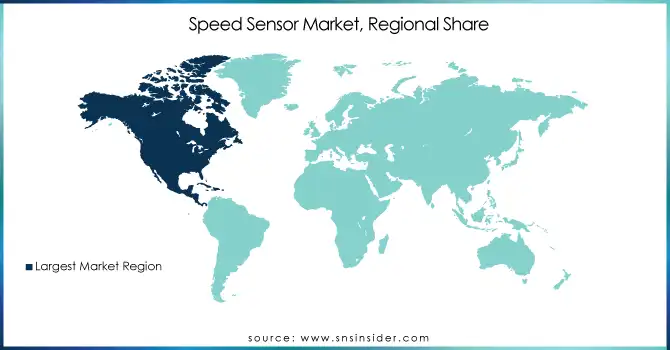
Speed Sensor Market Regional Analysis

North America is set to be the fastest-growing region in the speed sensor market from 2024 to 2032. The growth is driven by strong demand from the automotive industry, particularly with the rise of electric vehicles (EVs), autonomous vehicles, and advanced driver-assistance systems (ADAS), which rely heavily on precise speed sensors. Additionally, the region's focus on automation in industrial applications, such as manufacturing and robotics, is further propelling the market. The presence of key players in the United States and Canada, along with government initiatives supporting smart cities and IoT development, also contributes to the market's expansion. With technological advancements and increased investments in R&D, North America is expected to maintain its rapid growth in the coming years.

Speed-Sensor-Market-Regional-Share

Get Customized Report as per your Business Requirement - Request For Customized Report

Key Players

Some of the major key Players in Speed sensor Market with their product:

  • Honeywell International Inc. (Speed Sensors for automotive, industrial, and aerospace applications)

  • Robert Bosch GmbH (Wheel Speed Sensors, Engine Speed Sensors)

  • STMicroelectronics (Speed Sensors for automotive and industrial applications)

  • Sensata Technologies, Inc. (Magnetic Speed Sensors, Hall Effect Sensors)

  • DENSO Corporation (Automotive Speed Sensors)

  • Continental AG (Wheel Speed Sensors, Engine Speed Sensors)

  • Texas Instruments (Magnetic Speed Sensors, Automotive Sensors)

  • Analog Devices, Inc. (High-precision Speed Sensors for automotive and industrial)

  • Bourns, Inc. (Rotary Speed Sensors, Linear Speed Sensors)

  • Delphi Technologies (Automotive Speed Sensors)

  • Renesas Electronics Corporation (Speed Sensors for automotive and industrial applications)

  • Aptiv PLC (Automotive Speed Sensors, Electric Vehicle Speed Sensors)

  • TE Connectivity (Magnetic Speed Sensors, Industrial Speed Sensors)

  • Honeywell Sensing and Control (Speed Sensors for Industrial Applications)

  • Infineon Technologies AG (Magnetic and Hall Effect Speed Sensors for automotive applications)

  • NXP Semiconductors (Automotive Speed Sensors, Hall Effect Sensors)

  • Microchip Technology Inc. (Speed Sensors for automotive and industrial applications)

  • Toshiba Corporation (Speed Sensors for automotive, industrial, and consumer electronics)

  • Vishay Intertechnology Inc. (Hall Effect Speed Sensors, Automotive Sensors)

  • Broadcom Inc. (Magnetic Speed Sensors, Automotive Speed Sensors)

List of 20 key suppliers for raw materials and components used in the manufacturing of speed sensors:

  • 3M Company

  • Honeywell International Inc.

  • Ametek, Inc.

  • Littelfuse, Inc.

  • Vishay Intertechnology Inc.

  • TDK Corporation

  • Murata Manufacturing Co., Ltd.

  • NXP Semiconductors

  • STMicroelectronics

  • Infineon Technologies AG

  • Texas Instruments

  • Maxim Integrated

  • Analog Devices, Inc.

  • Vero Technologies

  • Yageo Corporation

  • Schneider Electric

  • TE Connectivity

  • Aptiv PLC

  • Broadcom Inc.

  • Rohm Semiconductor

Recent Development

  • April 29, 2024: Honeywell has been selected by Lilium to supply innovative propulsion unit position sensors for the Lilium Jet, the world’s first eVTOL jet. These resolvers are designed to accurately sense the engine’s position, ensuring precise takeoff and safe flight operations for the jet.

  • January 11, 2024: The Big Sky Camera System utilizes an 18K STMicroelectronics sensor to deliver exceptional image detail and fidelity for the Sphere Experience, featuring a 316-megapixel sensor crucial for the Sphere’s massive display quality.

  • December 13, 2024: Continental will showcase its "Intelligent Vehicle Experience Car" at CES 2025, featuring biometric solutions for seamless vehicle access. This innovation aligns with speed sensor technology, which ensures precise speed monitoring and enhances the vehicle's smart, secure, and efficient interaction with users.

Speed Sensor Market Report Scope:

Report Attributes Details
Market Size in 2023 USD 8.68 Billion
Market Size by 2032 USD 12.73 Billion
CAGR CAGR of 4.35% From 2024 to 2032
Base Year 2023
Forecast Period 2024-2032
Historical Data 2020-2022
Report Scope & Coverage Market Size, Segments Analysis, Competitive  Landscape, Regional Analysis, DROC & SWOT Analysis, Forecast Outlook
Key Segments • By Type (Hall Effect, Magneto Resistive, Variable Reluctance)
• By Application (Automotive, Industrial, Aerospace & Defense, Consumer Electronics)
Regional Analysis/Coverage North America (US, Canada, Mexico), Europe (Eastern Europe [Poland, Romania, Hungary, Turkey, Rest of Eastern Europe] Western Europe] Germany, France, UK, Italy, Spain, Netherlands, Switzerland, Austria, Rest of Western Europe]), Asia Pacific (China, India, Japan, South Korea, Vietnam, Singapore, Australia, Rest of Asia Pacific), Middle East & Africa (Middle East [UAE, Egypt, Saudi Arabia, Qatar, Rest of Middle East], Africa [Nigeria, South Africa, Rest of Africa], Latin America (Brazil, Argentina, Colombia, Rest of Latin America)
Company Profiles Honeywell International Inc., Robert Bosch GmbH, STMicroelectronics, Sensata Technologies, Inc., DENSO Corporation, Continental AG, Texas Instruments, Analog Devices, Inc., Bourns, Inc., Delphi Technologies, Renesas Electronics Corporation, Aptiv PLC, TE Connectivity, Honeywell Sensing and Control, Infineon Technologies AG, NXP Semiconductors, Microchip Technology Inc., Toshiba Corporation, Vishay Intertechnology Inc., Broadcom Inc.
Key Drivers • Rising Integration of Speed Sensors in Industrial Automation for Precise Control and Efficiency.
Restraints • Data Overload and Integration Complexity in the Speed Sensor Market for Industrial Automation.

Frequently Asked Questions

Ans: Increasing demand for advanced sensors in automotive applications, particularly for electric and autonomous vehicles.

Ans: The Speed Sensor Market was valued at USD 8.68 billion in 2023.

Ans: The expected CAGR of the Speed Sensor Market during the forecast period is 4.35%.

Ans: The Automotive Application had the largest share in the global market.

Ans: The Asia-Pacific region with the biggest market share in 2023.

Table of Content

1. Introduction

1.1 Market Definition

1.2 Scope (Inclusion and Exclusions)

1.3 Research Assumptions

2. Executive Summary

2.1 Market Overview

2.2 Regional Synopsis

2.3 Competitive Summary

3. Research Methodology

3.1 Top-Down Approach

3.2 Bottom-up Approach

3.3. Data Validation

3.4 Primary Interviews

4. Market Dynamics Impact Analysis

4.1 Market Driving Factors Analysis

4.1.2 Drivers

4.1.2 Restraints

4.1.3 Opportunities

4.1.4 Challenges

4.2 PESTLE Analysis

4.3 Porter’s Five Forces Model

5. Statistical Insights and Trends Reporting

5.1 Production and Supply Chain Data

5.2 OEM vs Aftermarket Distribution

5.3 Failure Rates and Reliability Data

5.4 Regulatory Impact

6. Competitive Landscape

6.1 List of Major Companies, by Region

6.2 Market Share Analysis, by Region

6.3 Product Benchmarking

6.3.1 Product specifications and features

6.3.2 Pricing

6.4 Strategic Initiatives

6.4.1 Marketing and promotional activities

6.4.2 Distribution and supply chain strategies

6.4.3 Expansion plans and new product launches

6.4.4 Strategic partnerships and collaborations

6.5 Technological Advancements

6.6 Market Positioning and Branding

7. Speed Sensor Market Segmentation, by Type

7.1 Chapter Overview

7.2 Hall effect

7.2.1 Hall effect Market Trends Analysis (2020-2032)

7.2.2 Hall effect Market Size Estimates and Forecasts to 2032 (USD Billion)

7.3 Magneto resistive

7.3.1 Magneto resistive Market Trends Analysis (2020-2032)

7.3.2 Magneto resistive Market Size Estimates and Forecasts to 2032 (USD Billion)

7.3 Variable reluctance (VR)

7.3.1 Variable reluctance (VR) Market Trends Analysis (2020-2032)

7.3.2 Variable reluctance (VR) Market Size Estimates and Forecasts to 2032 (USD Billion)

7.3 Others

7.3.1 Others Market Trends Analysis (2020-2032)

7.3.2 Others Market Size Estimates and Forecasts to 2032 (USD Billion)

8. Speed Sensor Market Segmentation, by Application

8.1 Chapter Overview

8.2 Automotive

8.2.1 Automotive Market Trends Analysis (2020-2032)

8.2.2 Automotive Market Size Estimates and Forecasts to 2032 (USD Billion)

8.3 Industrial

8.3.1 Industrial Market Trends Analysis (2020-2032)

8.3.2 Industrial Market Size Estimates and Forecasts to 2032 (USD Billion)

8.4 Aerospace & defense

8.4.1Aerospace & defense Market Trends Analysis (2020-2032)

8.4.2 Aerospace & defense Market Size Estimates and Forecasts to 2032 (USD Billion)

8.5 Consumer electronics

8.5.1Consumer electronics Market Trends Analysis (2020-2032)

8.5.2 Consumer electronics Market Size Estimates and Forecasts to 2032 (USD Billion)

8.5 Others

8.5.1Others Market Trends Analysis (2020-2032)

8.5.2 Others Market Size Estimates and Forecasts to 2032 (USD Billion)

9. Regional Analysis

9.1 Chapter Overview

9.2 North America

9.2.1 Trends Analysis

9.2.2 North America Speed Sensor Market Estimates and Forecasts, by Country (2020-2032) (USD Billion)

9.2.3 North America Speed Sensor Market Estimates and Forecasts, by Type (2020-2032) (USD Billion)  

9.2.4 North America Speed Sensor Market Estimates and Forecasts, by Application (2020-2032) (USD Billion)

9.2.5 USA

9.2.5.1 USA Speed Sensor Market Estimates and Forecasts, by Type (2020-2032) (USD Billion)

9.2.5.2 USA Speed Sensor Market Estimates and Forecasts, by Application (2020-2032) (USD Billion)

9.2.6 Canada

9.2.6.1 Canada Speed Sensor Market Estimates and Forecasts, by Type (2020-2032) (USD Billion)

9.2.6.2 Canada Speed Sensor Market Estimates and Forecasts, by Application (2020-2032) (USD Billion)

9.2.7 Mexico

9.2.7.1 Mexico Speed Sensor Market Estimates and Forecasts, by Type (2020-2032) (USD Billion)

9.2.7.2 Mexico Speed Sensor Market Estimates and Forecasts, by Application (2020-2032) (USD Billion)

9.3 Europe

9.3.1 Eastern Europe

9.3.1.1 Trends Analysis

9.3.1.2 Eastern Europe Speed Sensor Market Estimates and Forecasts, by Country (2020-2032) (USD Billion)

9.3.1.3 Eastern Europe Speed Sensor Market Estimates and Forecasts, by Type (2020-2032) (USD Billion)  

9.3.1.4 Eastern Europe Speed Sensor Market Estimates and Forecasts, by Application (2020-2032) (USD Billion)

9.3.1.5 Poland

9.3.1.5.1 Poland Speed Sensor Market Estimates and Forecasts, by Type (2020-2032) (USD Billion)

9.3.1.5.2 Poland Speed Sensor Market Estimates and Forecasts, by Application (2020-2032) (USD Billion)

9.3.1.6 Romania

9.3.1.6.1 Romania Speed Sensor Market Estimates and Forecasts, by Type (2020-2032) (USD Billion)

9.3.1.6.2 Romania Speed Sensor Market Estimates and Forecasts, by Application (2020-2032) (USD Billion)

9.3.1.7 Hungary

9.3.1.7.1 Hungary Speed Sensor Market Estimates and Forecasts, by Type (2020-2032) (USD Billion)

9.3.1.7.2 Hungary Speed Sensor Market Estimates and Forecasts, by Application (2020-2032) (USD Billion)

9.3.1.8 Turkey

9.3.1.8.1 Turkey Speed Sensor Market Estimates and Forecasts, by Type (2020-2032) (USD Billion)

9.3.1.8.2 Turkey Speed Sensor Market Estimates and Forecasts, by Application (2020-2032) (USD Billion)

9.3.1.9 Rest of Eastern Europe

9.3.1.9.1 Rest of Eastern Europe Speed Sensor Market Estimates and Forecasts, by Type (2020-2032) (USD Billion)

9.3.1.9.2 Rest of Eastern Europe Speed Sensor Market Estimates and Forecasts, by Application (2020-2032) (USD Billion)

9.3.2 Western Europe

9.3.2.1 Trends Analysis

9.3.2.2 Western Europe Speed Sensor Market Estimates and Forecasts, by Country (2020-2032) (USD Billion)

9.3.2.3 Western Europe Speed Sensor Market Estimates and Forecasts, by Type (2020-2032) (USD Billion)  

9.3.2.4 Western Europe Speed Sensor Market Estimates and Forecasts, by Application (2020-2032) (USD Billion)

9.3.2.5 Germany

9.3.2.5.1 Germany Speed Sensor Market Estimates and Forecasts, by Type (2020-2032) (USD Billion)

9.3.2.5.2 Germany Speed Sensor Market Estimates and Forecasts, by Application (2020-2032) (USD Billion)

9.3.2.6 France

9.3.2.6.1 France Speed Sensor Market Estimates and Forecasts, by Type (2020-2032) (USD Billion)

9.3.2.6.2 France Speed Sensor Market Estimates and Forecasts, by Application (2020-2032) (USD Billion)

9.3.2.7 UK

9.3.2.7.1 UK Speed Sensor Market Estimates and Forecasts, by Type (2020-2032) (USD Billion)

9.3.2.7.2 UK Speed Sensor Market Estimates and Forecasts, by Application (2020-2032) (USD Billion)

9.3.2.8 Italy

9.3.2.8.1 Italy Speed Sensor Market Estimates and Forecasts, by Type (2020-2032) (USD Billion)

9.3.2.8.2 Italy Speed Sensor Market Estimates and Forecasts, by Application (2020-2032) (USD Billion)

9.3.2.9 Spain

9.3.2.9.1 Spain Speed Sensor Market Estimates and Forecasts, by Type (2020-2032) (USD Billion)

9.3.2.9.2 Spain Speed Sensor Market Estimates and Forecasts, by Application (2020-2032) (USD Billion)

9.3.2.10 Netherlands

9.3.2.10.1 Netherlands Speed Sensor Market Estimates and Forecasts, by Type (2020-2032) (USD Billion)

9.3.2.10.2 Netherlands Speed Sensor Market Estimates and Forecasts, by Application (2020-2032) (USD Billion)

9.3.2.11 Switzerland

9.3.2.11.1 Switzerland Speed Sensor Market Estimates and Forecasts, by Type (2020-2032) (USD Billion)

9.3.2.11.2 Switzerland Speed Sensor Market Estimates and Forecasts, by Application (2020-2032) (USD Billion)

9.3.2.12 Austria

9.3.2.12.1 Austria Speed Sensor Market Estimates and Forecasts, by Type (2020-2032) (USD Billion)

9.3.2.12.2 Austria Speed Sensor Market Estimates and Forecasts, by Application (2020-2032) (USD Billion)

9.3.2.13 Rest of Western Europe

9.3.2.13.1 Rest of Western Europe Speed Sensor Market Estimates and Forecasts, by Type (2020-2032) (USD Billion)

9.3.2.13.2 Rest of Western Europe Speed Sensor Market Estimates and Forecasts, by Application (2020-2032) (USD Billion)

9.4 Asia-Pacific

9.4.1 Trends Analysis

9.4.2 Asia-Pacific Speed Sensor Market Estimates and Forecasts, by Country (2020-2032) (USD Billion)

9.4.3 Asia-Pacific Speed Sensor Market Estimates and Forecasts, by Type (2020-2032) (USD Billion)  

9.4.4 Asia-Pacific Speed Sensor Market Estimates and Forecasts, by Application (2020-2032) (USD Billion)

9.4.5 China

9.4.5.1 China Speed Sensor Market Estimates and Forecasts, by Type (2020-2032) (USD Billion)

9.4.5.2 China Speed Sensor Market Estimates and Forecasts, by Application (2020-2032) (USD Billion)

9.4.6 India

9.4.5.1 India Speed Sensor Market Estimates and Forecasts, by Type (2020-2032) (USD Billion)

9.4.5.2 India Speed Sensor Market Estimates and Forecasts, by Application (2020-2032) (USD Billion)

9.4.5 Japan

9.4.5.1 Japan Speed Sensor Market Estimates and Forecasts, by Type (2020-2032) (USD Billion)

9.4.5.2 Japan Speed Sensor Market Estimates and Forecasts, by Application (2020-2032) (USD Billion)

9.4.6 South Korea

9.4.6.1 South Korea Speed Sensor Market Estimates and Forecasts, by Type (2020-2032) (USD Billion)

9.4.6.2 South Korea Speed Sensor Market Estimates and Forecasts, by Application (2020-2032) (USD Billion)

9.4.7 Vietnam

9.4.7.1 Vietnam Speed Sensor Market Estimates and Forecasts, by Type (2020-2032) (USD Billion)

9.2.7.2 Vietnam Speed Sensor Market Estimates and Forecasts, by Application (2020-2032) (USD Billion)

9.4.8 Singapore

9.4.8.1 Singapore Speed Sensor Market Estimates and Forecasts, by Type (2020-2032) (USD Billion)

9.4.8.2 Singapore Speed Sensor Market Estimates and Forecasts, by Application (2020-2032) (USD Billion)

9.4.9 Australia

9.4.9.1 Australia Speed Sensor Market Estimates and Forecasts, by Type (2020-2032) (USD Billion)

9.4.9.2 Australia Speed Sensor Market Estimates and Forecasts, by Application (2020-2032) (USD Billion)

9.4.10 Rest of Asia-Pacific

9.4.10.1 Rest of Asia-Pacific Speed Sensor Market Estimates and Forecasts, by Type (2020-2032) (USD Billion)

9.4.10.2 Rest of Asia-Pacific Speed Sensor Market Estimates and Forecasts, by Application (2020-2032) (USD Billion)

9.5 Middle East and Africa

9.5.1 Middle East

9.5.1.1 Trends Analysis

9.5.1.2 Middle East Speed Sensor Market Estimates and Forecasts, by Country (2020-2032) (USD Billion)

9.5.1.3 Middle East Speed Sensor Market Estimates and Forecasts, by Type (2020-2032) (USD Billion)  

9.5.1.4 Middle East Speed Sensor Market Estimates and Forecasts, by Application (2020-2032) (USD Billion)

9.5.1.5 UAE

9.5.1.5.1 UAE Speed Sensor Market Estimates and Forecasts, by Type (2020-2032) (USD Billion)

9.5.1.5.2 UAE Speed Sensor Market Estimates and Forecasts, by Application (2020-2032) (USD Billion)

9.5.1.6 Egypt

9.5.1.6.1 Egypt Speed Sensor Market Estimates and Forecasts, by Type (2020-2032) (USD Billion)

9.5.1.6.2 Egypt Speed Sensor Market Estimates and Forecasts, by Application (2020-2032) (USD Billion)

9.5.1.7 Saudi Arabia

9.5.1.7.1 Saudi Arabia Speed Sensor Market Estimates and Forecasts, by Type (2020-2032) (USD Billion)

9.5.1.7.2 Saudi Arabia Speed Sensor Market Estimates and Forecasts, by Application (2020-2032) (USD Billion)

9.5.1.8 Qatar

9.5.1.8.1 Qatar Speed Sensor Market Estimates and Forecasts, by Type (2020-2032) (USD Billion)

9.5.1.8.2 Qatar Speed Sensor Market Estimates and Forecasts, by Application (2020-2032) (USD Billion)

9.5.1.9 Rest of Middle East

9.5.1.9.1 Rest of Middle East Speed Sensor Market Estimates and Forecasts, by Type (2020-2032) (USD Billion)

9.5.1.9.2 Rest of Middle East Speed Sensor Market Estimates and Forecasts, by Application (2020-2032) (USD Billion)

9.5.2 Africa

9.5.2.1 Trends Analysis

9.5.2.2 Africa Speed Sensor Market Estimates and Forecasts, by Country (2020-2032) (USD Billion)

9.5.2.3 Africa Speed Sensor Market Estimates and Forecasts, by Type (2020-2032) (USD Billion)  

9.5.2.4 Africa Speed Sensor Market Estimates and Forecasts, by Application (2020-2032) (USD Billion)

9.5.2.5 South Africa

9.5.2.5.1 South Africa Speed Sensor Market Estimates and Forecasts, by Type (2020-2032) (USD Billion)

9.5.2.5.2 South Africa Speed Sensor Market Estimates and Forecasts, by Application (2020-2032) (USD Billion)

9.5.2.6 Nigeria

9.5.2.6.1 Nigeria Speed Sensor Market Estimates and Forecasts, by Type (2020-2032) (USD Billion)

9.5.2.6.2 Nigeria Speed Sensor Market Estimates and Forecasts, by Application (2020-2032) (USD Billion)

9.5.2.7 Rest of Africa

9.5.2.7.1 Rest of Africa Speed Sensor Market Estimates and Forecasts, by Type (2020-2032) (USD Billion)

9.5.2.7.2 Rest of Africa Speed Sensor Market Estimates and Forecasts, by Application (2020-2032) (USD Billion)

9.6 Latin America

9.6.1 Trends Analysis

9.6.2 Latin America Speed Sensor Market Estimates and Forecasts, by Country (2020-2032) (USD Billion)

9.6.3 Latin America Speed Sensor Market Estimates and Forecasts, by Type (2020-2032) (USD Billion)  

9.6.4 Latin America Speed Sensor Market Estimates and Forecasts, by Application (2020-2032) (USD Billion)

9.6.5 Brazil

9.6.5.1 Brazil Speed Sensor Market Estimates and Forecasts, by Type (2020-2032) (USD Billion)

9.6.5.2 Brazil Speed Sensor Market Estimates and Forecasts, by Application (2020-2032) (USD Billion)

9.6.6 Argentina

9.6.6.1 Argentina Speed Sensor Market Estimates and Forecasts, by Type (2020-2032) (USD Billion)

9.6.6.2 Argentina Speed Sensor Market Estimates and Forecasts, by Application (2020-2032) (USD Billion)

9.6.7 Colombia

9.6.7.1 Colombia Speed Sensor Market Estimates and Forecasts, by Type (2020-2032) (USD Billion)

9.6.7.2 Colombia Speed Sensor Market Estimates and Forecasts, by Application (2020-2032) (USD Billion)

9.6.8 Rest of Latin America

9.6.8.1 Rest of Latin America Speed Sensor Market Estimates and Forecasts, by Type (2020-2032) (USD Billion)

9.6.8.2 Rest of Latin America Speed Sensor Market Estimates and Forecasts, by Application (2020-2032) (USD Billion)

10. Company Profiles

10.1 Honeywell International Inc.

 10.1.1 Company Overview

10.1.2 Financial

10.1.3 Products/ Services Offered

110.1.4 SWOT Analysis

10.2 Robert Bosch GmbH

10.2.1 Company Overview

10.2.2 Financial

10.2.3 Products/ Services Offered

10.2.4 SWOT Analysis

10.3 STMicroelectronics

10.3.1 Company Overview

10.3.2 Financial

10.3.3 Products/ Services Offered

10.3.4 SWOT Analysis

10.4 Sensata Technologies, Inc.

10.4.1 Company Overview

10.4.2 Financial

10.4.3 Products/ Services Offered

10.4.4 SWOT Analysis

10.5 DENSO Corporation

10.5.1 Company Overview

10.5.2 Financial

10.5.3 Products/ Services Offered

10.5.4 SWOT Analysis

10.6 Continental AG

10.6.1 Company Overview

10.6.2 Financial

10.6.3 Products/ Services Offered

10.6.4 SWOT Analysis

10.7 Texas Instruments

 10.7.1 Company Overview

10.7.2 Financial

10.7.3 Products/ Services Offered

10.7.4 SWOT Analysis

10.8 Analog Devices, Inc.

10.8.1 Company Overview

10.8.2 Financial

10.8.3 Products/ Services Offered

10.8.4 SWOT Analysis

10.9 Bourns, Inc.

10.9.1 Company Overview

10.9.2 Financial

10.9.3 Products/ Services Offered

10.9.4 SWOT Analysis

10.10 Delphi Technologies

 10.10.1 Company Overview

10.10.2 Financial

10.10.3 Products/ Services Offered

10.10.4 SWOT Analysis

11. Use Cases and Best Practices

12. Conclusion

An accurate research report requires proper strategizing as well as implementation. There are multiple factors involved in the completion of good and accurate research report and selecting the best methodology to compete the research is the toughest part. Since the research reports we provide play a crucial role in any company’s decision-making process, therefore we at SNS Insider always believe that we should choose the best method which gives us results closer to reality. This allows us to reach at a stage wherein we can provide our clients best and accurate investment to output ratio.

Each report that we prepare takes a timeframe of 350-400 business hours for production. Starting from the selection of titles through a couple of in-depth brain storming session to the final QC process before uploading our titles on our website we dedicate around 350 working hours. The titles are selected based on their current market cap and the foreseen CAGR and growth.


The 5 steps process:

Step 1: Secondary Research:

Secondary Research or Desk Research is as the name suggests is a research process wherein, we collect data through the readily available information. In this process we use various paid and unpaid databases which our team has access to and gather data through the same. This includes examining of listed companies’ annual reports, Journals, SEC filling etc. Apart from this our team has access to various associations across the globe across different industries. Lastly, we have exchange relationships with various university as well as individual libraries.

Secondary Research

Step 2: Primary Research

When we talk about primary research, it is a type of study in which the researchers collect relevant data samples directly, rather than relying on previously collected data.  This type of research is focused on gaining content specific facts that can be sued to solve specific problems. Since the collected data is fresh and first hand therefore it makes the study more accurate and genuine.

We at SNS Insider have divided Primary Research into 2 parts.

Part 1 wherein we interview the KOLs of major players as well as the upcoming ones across various geographic regions. This allows us to have their view over the market scenario and acts as an important tool to come closer to the accurate market numbers. As many as 45 paid and unpaid primary interviews are taken from both the demand and supply side of the industry to make sure we land at an accurate judgement and analysis of the market.

This step involves the triangulation of data wherein our team analyses the interview transcripts, online survey responses and observation of on filed participants. The below mentioned chart should give a better understanding of the part 1 of the primary interview.

Primary Research

Part 2: In this part of primary research the data collected via secondary research and the part 1 of the primary research is validated with the interviews from individual consultants and subject matter experts.

Consultants are those set of people who have at least 12 years of experience and expertise within the industry whereas Subject Matter Experts are those with at least 15 years of experience behind their back within the same space. The data with the help of two main processes i.e., FGDs (Focused Group Discussions) and IDs (Individual Discussions). This gives us a 3rd party nonbiased primary view of the market scenario making it a more dependable one while collation of the data pointers.

Step 3: Data Bank Validation

Once all the information is collected via primary and secondary sources, we run that information for data validation. At our intelligence centre our research heads track a lot of information related to the market which includes the quarterly reports, the daily stock prices, and other relevant information. Our data bank server gets updated every fortnight and that is how the information which we collected using our primary and secondary information is revalidated in real time.

Data Bank Validation

Step 4: QA/QC Process

After all the data collection and validation our team does a final level of quality check and quality assurance to get rid of any unwanted or undesired mistakes. This might include but not limited to getting rid of the any typos, duplication of numbers or missing of any important information. The people involved in this process include technical content writers, research heads and graphics people. Once this process is completed the title gets uploader on our platform for our clients to read it.

Step 5: Final QC/QA Process:

This is the last process and comes when the client has ordered the study. In this process a final QA/QC is done before the study is emailed to the client. Since we believe in giving our clients a good experience of our research studies, therefore, to make sure that we do not lack at our end in any way humanly possible we do a final round of quality check and then dispatch the study to the client.

Key Segments:

By Type

  • Hall effect

  • Magneto resistive

  • Variable reluctance (VR)

  • Others

By Application

  • Automotive

  • Industrial

  • Aerospace & defense

  • Consumer electronics

  • Others

Request for Segment Customization as per your Business Requirement: Segment Customization Request

REGIONAL COVERAGE:

North America

  • US

  • Canada

  • Mexico

Europe

  • Eastern Europe

    • Poland

    • Romania

    • Hungary

    • Turkey

    • Rest of Eastern Europe

  • Western Europe

    • Germany

    • France

    • UK

    • Italy

    • Spain

    • Netherlands

    • Switzerland

    • Austria

    • Rest of Western Europe

Asia-Pacific

  • China

  • India

  • Japan

  • South Korea

  • Vietnam

  • Singapore

  • Australia

  • Rest of Asia Pacific

Middle East & Africa

  • Middle East

    • UAE

    • Egypt

    • Saudi Arabia

    • Qatar

    • Rest of the Middle East

  • Africa

    • Nigeria

    • South Africa

    • Rest of Africa

Latin America

  • Brazil

  • Argentina

  • Colombia

  • Rest of Latin America

Request for Country Level Research Report: Country Level Customization Request

Available Customization

With the given market data, SNS Insider offers customization as per the company’s specific needs. The following customization options are available for the report:

  • Product Analysis

  • Criss-Cross segment analysis (e.g. Product X Application)

  • Product Matrix which gives a detailed comparison of the product portfolio of each company

  • Geographic Analysis

  • Additional countries in any of the regions

  • Company Information

  • Detailed analysis and profiling of additional market players (Up to five)


  •            5000 (33% Discount)


  •            8950 (40% Discount)


  •            3050 (23% Discount)

Start a Conversation

Hi! Click one of our member below to chat on Phone