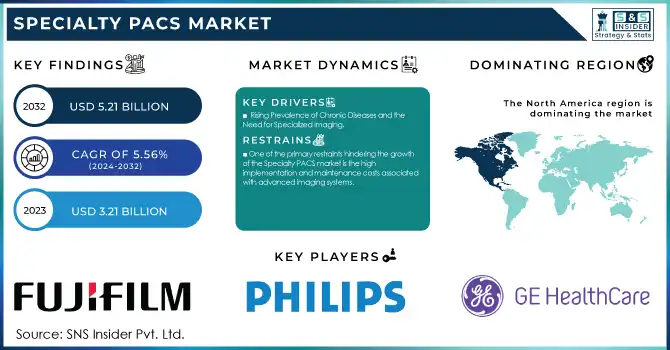
The Specialty PACS Market was valued at USD 3.21 billion in 2023 and is expected to reach USD 5.21 billion by 2032, growing at a CAGR of 5.56% over the forecast period 2024-2032.
Get more information on Specialty PACS Market - Request Sample Report
The Specialty PACS market is evolving rapidly, driven by technological advancements and the growing demand for specialized imaging solutions. A significant factor fueling this growth is integrating artificial intelligence into radiology workflows. Studies indicate that AI can improve diagnostic accuracy by 25–30% and reduce radiologists’ workload by up to 40%, as reported by the Journal of Digital Imaging. For instance, AI tools like Zebra Medical Vision’s breast cancer detection algorithms have demonstrated sensitivity rates exceeding 90%, comparable to experienced radiologists.
AI integration is particularly impactful in neuroradiology. Automated tools for brain tumor segmentation and radiomic feature extraction, like those included in PACS platforms developed by Novarad, have reduced analysis time by over 40% and improved detection precision. A study published found that AI-assisted PACS systems enhance the detection of neurological anomalies by 35%, underscoring their transformative role in specialized imaging.
The shift toward personalized and precision medicine also drives the adoption of specialty PACS. According to a report by the National Institutes of Health, tailored treatment approaches, particularly in cardiology and oncology, have surged by 50% over the last decade. Specialty PACS has facilitated this growth by enabling seamless integration of imaging data, such as echocardiograms and CT scans, with clinical decision-making tools. In cardiology-specific applications, PACS systems have reduced diagnostic delays by 30%, improving patient outcomes significantly.
Additionally, the need for specialized training in AI and PACS systems is evident. A survey conducted by the American College of Radiology revealed that 67% of radiologists are undergoing AI-related training, and 80% of radiology departments are planning to incorporate AI within the next two years. These training initiatives are supported by programs like ACR’s AI-Lab, which helps radiologists and healthcare professionals integrate AI tools into their workflows efficiently.
Drivers
Rising Prevalence of Chronic Diseases and the Need for Specialized Imaging
The increasing prevalence of chronic diseases, including cardiovascular disorders, cancer, and neurological conditions, is a significant driver for the Specialty PACS market. According to the World Health Organization, chronic diseases account for nearly 70% of global deaths, creating a pressing need for advanced imaging systems to support early detection and targeted treatment. Specialty PACS solutions, tailored to specific medical domains, enable precise diagnostics by integrating modalities such as CT, MRI, and PET scans. For instance, oncology-specific PACS systems help oncologists track tumor progression and evaluate treatment efficacy, contributing to better patient outcomes.
Adoption of Cloud-Based PACS for Enhanced Efficiency and Accessibility
The growing preference for cloud-based PACS solutions is transforming how imaging data is stored, accessed, and shared. Offering scalability, cost efficiency, and remote accessibility, cloud PACS allows healthcare providers to streamline workflows and improve collaboration among multidisciplinary teams. A report by the Journal of Cloud Computing highlights that cloud PACS adoption is increasing by over 35% annually. These solutions are particularly beneficial in rural or underserved areas, where radiologists can remotely interpret images, providing timely and accurate diagnoses.
Technological Advancements and Interoperability Enhancements
Advances in imaging technologies, including 3D imaging, artificial intelligence, and teleradiology, are significantly boosting the specialty PACS market. These innovations enhance diagnostic accuracy and enable real-time consultations across locations, improving patient care. Moreover, the rising demand for interoperability ensures seamless integration of PACS with electronic health records and other hospital systems, promoting efficient data exchange. This capability is critical for multidisciplinary teams managing complex cases, as it facilitates better-coordinated and informed decision-making.
Restraints
One of the primary restraints hindering the growth of the Specialty PACS market is the high implementation and maintenance costs associated with advanced imaging systems.
Deploying specialty PACS involves significant expenses for hardware, software, and infrastructure upgrades, which can be challenging for smaller healthcare facilities or those in low-resource settings. Additionally, cloud-based PACS solutions, while offering scalability and remote accessibility, raise concerns over data security and compliance with stringent regulations such as HIPAA and GDPR. The potential risks of data breaches and unauthorized access to sensitive patient information deter some organizations from adopting these technologies. Furthermore, integrating PACS with existing healthcare IT systems, such as EHRs and HIS, can be complex and require significant customization efforts, adding to the overall cost and time required for deployment. These challenges underscore the need for affordable and secure solutions to drive wider adoption across diverse healthcare settings.
By Type
Radiology PACS led the Specialty PACS market in 2023, accounting for 42.3% of the overall market share. This dominance is attributed to the broad utilization of radiology imaging in healthcare, as it is essential for diagnosing and monitoring a wide range of medical conditions, including cardiovascular diseases and cancer. The extensive use of imaging modalities such as X-rays, CT scans, and MRIs in hospitals and diagnostic centers contributes to the strong demand for radiology PACS. Technological advancements like AI integration to automate image analysis and improve diagnostic accuracy have further solidified radiology PACS' leadership in the market.
Ophthalmology PACS is anticipated to emerge as one of the fastest-growing segments within the Specialty PACS market by type. This growth is driven by the increasing prevalence of eye-related disorders, particularly age-related conditions like cataracts, glaucoma, and diabetic retinopathy, which require advanced imaging for diagnosis and treatment planning. The adoption of ophthalmology PACS is also facilitated by advancements in optical imaging technologies, such as Optical Coherence Tomography (OCT), fundus photography, and retinal imaging, which have become vital in detecting and monitoring eye diseases.
By Component
The software segment held the largest share in the Specialty PACS market in 2023, representing nearly 43.8% of the total market. PACS software plays a crucial role in managing, storing, and facilitating the sharing of medical imaging data efficiently across healthcare systems. The integration of advanced features like AI-based image processing, automated reporting, and data analytics has further driven the demand for PACS software. Additionally, software updates to comply with evolving healthcare regulations and interoperability standards continue to fuel its prominence in the market.
The services segment emerged as the fastest-growing area within the Specialty PACS market by component, with increasing demand for implementation, maintenance, and integration services. Healthcare providers are increasingly turning to specialized services to ensure smooth integration of PACS with existing systems such as EHRs and HIS. The adoption of cloud-based PACS models also boosts the demand for services related to data storage, security, and system management. The growing need for tailored solutions, especially in complex healthcare environments, is contributing to the rapid growth of the services segment.
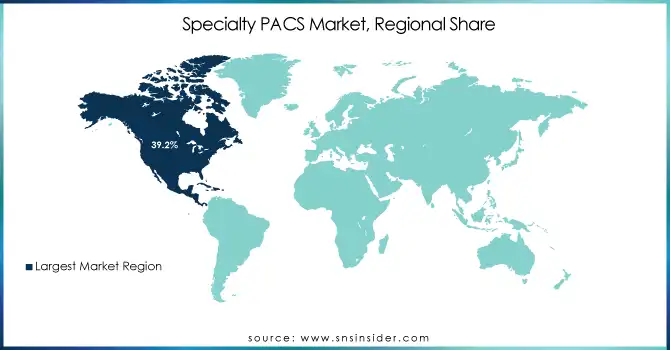
Specialty PACS Market Regional Outlook
In 2023, North America dominated the Specialty PACS market, accounting for a 39.2% share due to advanced healthcare infrastructure, high adoption rates of digital health solutions, and the presence of key market players. The United States, in particular, has a well-established healthcare system with significant investments in medical imaging technology and cloud-based solutions. This has contributed to the widespread adoption of specialty PACS across various medical fields such as radiology, oncology, and ophthalmology. Moreover, the ongoing trend of integrating AI and machine learning in imaging systems has fueled the region’s market growth.
Europe also held a prominent share, driven by the increasing demand for advanced imaging technologies, the presence of leading healthcare providers, and rising investments in healthcare digitalization. Countries like Germany, the UK, and France are witnessing a surge in the adoption of specialized PACS for various medical disciplines, including cardiology, dermatology, and pathology. Additionally, the European Union's healthcare policies encouraging digital health adoption are further supporting market growth.
The Asia Pacific region is expected to exhibit rapid growth, driven by rising healthcare expenditure, growing aging populations, and the increasing prevalence of chronic diseases. Countries like China and India are seeing substantial investments in healthcare infrastructure and are adopting digital solutions to improve medical imaging capabilities. The rising demand for telemedicine and remote diagnostics in these regions is also propelling the growth of PACS systems, particularly in ophthalmology and dermatology.
Need any customization research on Specialty PACS Market - Enquiry Now
IBM Corporation (Merge Healthcare Incorporated) - Merge PACS, Merge Eye Care PACS, Merge Oncology PACS
GE HealthCare - Centricity PACS, Centricity Universal Viewer, Centricity Imaging
Koninklijke Philips NV - IntelliSpace PACS, Philips Digital Pathology Solution, Philips Ophthalmology PACS
FUJIFILM Corporation - Synapse PACS, Synapse 3D, Synapse Mobility
Siemens AG - syngo PACS, syngo.via, syngo.plaza
Intelerad - IntelePACS, InteleRad RIS, InteleViewer
RamSoft - PowerPACS, PowerServer PACS, PowerWeb
eRAD - eRAD PACS, eRAD Cloud PACS, eRAD RIS
Oracle - Oracle PACS Solutions, Oracle Healthcare Imaging Suite
Sectra AB - Sectra PACS, Sectra Enterprise Imaging, Sectra Breast Imaging PACS
McKesson Corporation - McKesson Radiology PACS, McKesson Cardiology PACS
Agfa Healthcare - Enterprise Imaging PACS, Agfa Xero PACS
Carestream Health - Carestream Vue PACS, Carestream Radiology PACS
Novarad - NovaPACS, NovaCloud PACS
INFINITT North America - INFINITT PACS, INFINITT Cloud PACS
Topcon Corporation - Topcon 3D OCT-1 PACS, Topcon Eye Imaging Solutions
Sonomed Escalon - Sonomed PACS, Sonomed Retina Imaging Solutions
Canon USA, Inc. - Canon Digital Radiography PACS, Canon Ophthalmology Imaging PACS
Visbion - Visbion PACS, Visbion Diagnostic Imaging Solutions
EyePACS, LLC - EyePACS Diabetic Retinopathy PACS, EyePACS Telemedicine Solutions
In Sept 2024, FUJIFILM Irvine Scientific expanded its product portfolio and services by aligning its commercial operations with FUJIFILM Wako Chemicals U.S.A., effective October 1, 2024. The collaboration will involve promoting products from FUJIFILM Wako Chemicals' Lab Automation, Lab Chemicals, and LAL Group divisions directly to customers in the U.S. and Europe.
In June 2024, Skyway Capital Markets, LLC advised Aqua ChemPacs, LLC on its acquisition by Solenis, a global leader in specialty chemicals. This strategic sale enhances Solenis' portfolio in the specialty chemicals sector.
| Report Attributes | Details |
|---|---|
| Market Size in 2023 | USD 3.21 Billion |
| Market Size by 2032 | USD 5.21 Billion |
| CAGR | CAGR of 5.56% From 2024 to 2032 |
| Base Year | 2023 |
| Forecast Period | 2024-2032 |
| Historical Data | 2020-2022 |
| Report Scope & Coverage | Market Size, Segments Analysis, Competitive Landscape, Regional Analysis, DROC & SWOT Analysis, Forecast Outlook |
| Key Segments | • By Type (Radiology PACS, Cardiology PACS, Pathology PACS, Ophthalmology PACS, Orthopedics PACS, Oncology PACS, Dermatology PACS, Neurology PACS, Endoscopy PACS, Women’s Health PACS, Other specialty PACS) • By Component (Hardware, Software, Services) • By Deployment Model (On-premise specialty PACS, Web/Cloud-based specialty PACS) • By End-User (Hospitals, Ambulatory Surgery Centers & Clinics, Diagnostic Imaging Centers, Other End Users) |
| Regional Analysis/Coverage | North America (US, Canada, Mexico), Europe (Eastern Europe [Poland, Romania, Hungary, Turkey, Rest of Eastern Europe] Western Europe] Germany, France, UK, Italy, Spain, Netherlands, Switzerland, Austria, Rest of Western Europe]), Asia Pacific (China, India, Japan, South Korea, Vietnam, Singapore, Australia, Rest of Asia Pacific), Middle East & Africa (Middle East [UAE, Egypt, Saudi Arabia, Qatar, Rest of Middle East], Africa [Nigeria, South Africa, Rest of Africa], Latin America (Brazil, Argentina, Colombia, Rest of Latin America) |
| Company Profiles | IBM Corporation (Merge Healthcare Incorporated), GE HealthCare, Koninklijke Philips NV, FUJIFILM Corporation, Siemens AG, Intelerad, RamSoft, eRAD, Oracle, Sectra AB, McKesson Corporation, Agfa Healthcare, Carestream Health, Novarad, INFINITT North America, Topcon Corporation, Sonomed Escalon, Canon USA, Inc., Visbion, EyePACS, LLC. |
| Key Drivers | • Rising Prevalence of Chronic Diseases and the Need for Specialized Imaging • Adoption of Cloud-Based PACS for Enhanced Efficiency and Accessibility • Technological Advancements and Interoperability Enhancements |
| Restraints | • One of the primary restraints hindering the growth of the Specialty PACS market is the high implementation and maintenance costs associated with advanced imaging systems. |
Ans: The market is expected to reach USD 5.21 billion by 2032.
Ans: The market is grown at a CAGR of 5.56% From 2024 to 2032.
Technological Advancements
The increasing adoption of cloud-based PACS offers advantages like scalability and affordability, potentially expanding the market reach
Ans: The major players are Canon Inc., Siemens Healthineers, McKesson Corporation, INC Escalon Medical Corp., Intelerad Medical Systems, Eye PACS, LLC, IBM Corporation, Sectra AB, INFINITT Healthcare Co. Ltd., Topcon Corporation, Novarad, Onex Corporation (Carestream Health), Philips Healthcare, Agfa Healthcare, Visbion.
Ans: The forecast period of the Specialty PACS Market is 2024-2032.
Table of Contents
1. Introduction
1.1 Market Definition
1.2 Scope (Inclusion and Exclusions)
1.3 Research Assumptions
2. Executive Summary
2.1 Market Overview
2.2 Regional Synopsis
2.3 Competitive Summary
3. Research Methodology
3.1 Top-Down Approach
3.2 Bottom-up Approach
3.3. Data Validation
3.4 Primary Interviews
4. Market Dynamics Impact Analysis
4.1 Market Driving Factors Analysis
4.1.1 Drivers
4.1.2 Restraints
4.1.3 Opportunities
4.1.4 Challenges
4.2 PESTLE Analysis
4.3 Porter’s Five Forces Model
5. Statistical Insights and Trends Reporting
5.1 Market Adoption Rates by Specialty (2023)
5.2 Technological Integration Trends (2023)
5.3 Regulatory and Compliance Trends (2023)
5.4 User Satisfaction and Performance Metrics (2023)
6. Competitive Landscape
6.1 List of Major Companies, By Region
6.2 Market Share Analysis, By Region
6.3 Product Benchmarking
6.3.1 Product specifications and features
6.3.2 Pricing
6.4 Strategic Initiatives
6.4.1 Marketing and Promotional Activities
6.4.2 Distribution and Supply Chain Strategies
6.4.3 Expansion plans and new product launches
6.4.4 Strategic partnerships and collaborations
6.5 Technological Advancements
6.6 Market Positioning and Branding
7. Specialty PACS Market Segmentation, by Type
7.1 Chapter Overview
7.2 Radiology PACS
7.2.1 Radiology PACS Market Trends Analysis (2020-2032)
7.2.2 Radiology PACS Market Size Estimates and Forecasts to 2032 (USD Billion)
7.3 Cardiology PACS
7.3.1 Cardiology PACS Market Trends Analysis (2020-2032)
7.3.2 Cardiology PACS Market Size Estimates and Forecasts to 2032 (USD Billion)
7.4 Pathology PACS
7.4.1 Pathology PACS Market Trends Analysis (2020-2032)
7.4.2 Pathology PACS Market Size Estimates and Forecasts to 2032 (USD Billion)
7.5 Ophthalmology PACS
7.5.1 Ophthalmology PACS Market Trends Analysis (2020-2032)
7.5.2 Ophthalmology PACS Market Size Estimates and Forecasts to 2032 (USD Billion)
7.6 Orthopedics PACS
7.6.1 Orthopedics PACS Market Trends Analysis (2020-2032)
7.6.2 Orthopedics PACS Market Size Estimates and Forecasts to 2032 (USD Billion)
7.7 Oncology PACS
7.7.1 Oncology PACS Market Trends Analysis (2020-2032)
7.7.2 Oncology PACS Market Size Estimates and Forecasts to 2032 (USD Billion)
7.8 Dermatology PACS
7.8.1 Dermatology PACS Market Trends Analysis (2020-2032)
7.8.2 Dermatology PACS Market Size Estimates and Forecasts to 2032 (USD Billion)
7.9 Neurology PACS
7.9.1 Neurology PACS Market Trends Analysis (2020-2032)
7.9.2 Neurology PACS Market Size Estimates and Forecasts to 2032 (USD Billion)
7.10 Endoscopy PACS
7.10.1 Endoscopy PACS Market Trends Analysis (2020-2032)
7.10.2 Endoscopy PACS Market Size Estimates and Forecasts to 2032 (USD Billion)
7.11 Women’s Health PACS
7.11.1 Women’s Health PACS Market Trends Analysis (2020-2032)
7.11.2 Women’s Health PACS Market Size Estimates and Forecasts to 2032 (USD Billion)
7.12 Other Specialty PACS
7.12.1 Other Specialty PACS Market Trends Analysis (2020-2032)
7.12.2 Other Specialty PACS Market Size Estimates and Forecasts to 2032 (USD Billion)
8. Specialty PACS Market Segmentation, By Component
8.1 Chapter Overview
8.2 Hardware
8.2.1 Hardware Market Trends Analysis (2020-2032)
8.2.2 Hardware Market Size Estimates and Forecasts to 2032 (USD Billion)
8.3 Software
8.3.1 Software Market Trends Analysis (2020-2032)
8.3.2 Software Market Size Estimates And Forecasts To 2032 (USD Billion)
8.4 Services
8.4.1 Services Market Trends Analysis (2020-2032)
8.4.2 Services Market Size Estimates And Forecasts To 2032 (USD Billion)
9. Specialty PACS Market Segmentation, by Deployment Model
9.1 Chapter Overview
9.2 On-premise specialty PACS
9.2.1 On-premise Specialty PACS Market Trends Analysis (2020-2032)
9.2.2 On-premise Specialty PACS Market Size Estimates and Forecasts to 2032 (USD Billion)
9.3 Web/Cloud-based specialty PACS
9.3.1 Web/Cloud-based specialty PACS Market Trends Analysis (2020-2032)
9.3.2 Web/Cloud-based specialty PACS Market Size Estimates and Forecasts to 2032 (USD Billion)
10. Specialty PACS Market Segmentation, By End User
10.1 Chapter Overview
10.2 Hospitals
10.2.1 Hospitals Market Trends Analysis (2020-2032)
10.2.2 Hospitals Market Size Estimates and Forecasts to 2032 (USD Billion)
10.3 Ambulatory Surgery Centers & Clinics
10.3.1 Ambulatory Surgery Centers & Clinics Market Trends Analysis (2020-2032)
10.3.2 Ambulatory Surgery Centers & Clinics Market Size Estimates and Forecasts to 2032 (USD Billion)
10.4 Diagnostic Imaging Centers
10.4.1 Diagnostic Imaging Centers Market Trends Analysis (2020-2032)
10.4.2 Diagnostic Imaging Centers Market Size Estimates and Forecasts to 2032 (USD Billion)
10.5 Other End Users
10.5.1 Other End Users Market Trends Analysis (2020-2032)
10.5.2 Other End Users Market Size Estimates and Forecasts to 2032 (USD Billion)
11. Regional Analysis
11.1 Chapter Overview
11.2 North America
11.2.1 Trends Analysis
11.2.2 North America Specialty PACS Market Estimates and Forecasts, by Country (2020-2032) (USD Billion)
11.2.3 North America Specialty PACS Market Estimates and Forecasts, by Type (2020-2032) (USD Billion)
11.2.4 North America Specialty PACS Market Estimates and Forecasts, By Component (2020-2032) (USD Billion)
11.2.5 North America Specialty PACS Market Estimates and Forecasts, by Deployment Model (2020-2032) (USD Billion)
11.2.6 North America Specialty PACS Market Estimates and Forecasts, By End User (2020-2032) (USD Billion)
11.2.7 USA
11.2.7.1 USA Specialty PACS Market Estimates and Forecasts, by Type (2020-2032) (USD Billion)
11.2.7.2 USA Specialty PACS Market Estimates and Forecasts, By Component (2020-2032) (USD Billion)
11.2.7.3 USA Specialty PACS Market Estimates and Forecasts, by Deployment Model (2020-2032) (USD Billion)
11.2.7.4 USA Specialty PACS Market Estimates and Forecasts, By End User (2020-2032) (USD Billion)
11.2.8 Canada
11.2.8.1 Canada Specialty PACS Market Estimates and Forecasts, by Type (2020-2032) (USD Billion)
11.2.8.2 Canada Specialty PACS Market Estimates and Forecasts, By Component (2020-2032) (USD Billion)
11.2.8.3 Canada Specialty PACS Market Estimates and Forecasts, by Deployment Model (2020-2032) (USD Billion)
11.2.8.4 Canada Specialty PACS Market Estimates and Forecasts, By End User (2020-2032) (USD Billion)
11.2.9 Mexico
11.2.9.1 Mexico Specialty PACS Market Estimates and Forecasts, by Type (2020-2032) (USD Billion)
11.2.9.2 Mexico Specialty PACS Market Estimates and Forecasts, By Component (2020-2032) (USD Billion)
11.2.9.3 Mexico Specialty PACS Market Estimates and Forecasts, by Deployment Model (2020-2032) (USD Billion)
11.2.9.4 Mexico Specialty PACS Market Estimates and Forecasts, By End User (2020-2032) (USD Billion
11.3 Europe
11.3.1 Eastern Europe
11.3.1.1 Trends Analysis
11.3.1.2 Eastern Europe Specialty PACS Market Estimates and Forecasts, by Country (2020-2032) (USD Billion)
11.3.1.3 Eastern Europe Specialty PACS Market Estimates and Forecasts, by Type (2020-2032) (USD Billion)
11.3.1.4 Eastern Europe Specialty PACS Market Estimates and Forecasts, By Component (2020-2032) (USD Billion)
11.3.1.5 Eastern Europe Specialty PACS Market Estimates and Forecasts, by Deployment Model (2020-2032) (USD Billion)
11.3.1.6 Eastern Europe Specialty PACS Market Estimates and Forecasts, By End User (2020-2032) (USD Billion)
11.3.1.7 Poland
11.3.1.7.1 Poland Specialty PACS Market Estimates and Forecasts, by Type (2020-2032) (USD Billion)
11.3.1.7.2 Poland Specialty PACS Market Estimates and Forecasts, By Component (2020-2032) (USD Billion)
11.3.1.7.3 Poland Specialty PACS Market Estimates and Forecasts, by Deployment Model (2020-2032) (USD Billion)
11.3.1.7.4 Poland Specialty PACS Market Estimates and Forecasts, By End User (2020-2032) (USD Billion)
11.3.1.8 Romania
11.3.1.8.1 Romania Specialty PACS Market Estimates and Forecasts, by Type (2020-2032) (USD Billion)
11.3.1.8.2 Romania Specialty PACS Market Estimates and Forecasts, By Component (2020-2032) (USD Billion)
11.3.1.8.3 Romania Specialty PACS Market Estimates and Forecasts, by Deployment Model (2020-2032) (USD Billion)
11.3.1.8.4 Romania Specialty PACS Market Estimates and Forecasts, By End User (2020-2032) (USD Billion)
11.3.1.9 Hungary
11.3.1.9.1 Hungary Specialty PACS Market Estimates and Forecasts, by Type (2020-2032) (USD Billion)
11.3.1.9.2 Hungary Specialty PACS Market Estimates and Forecasts, By Component (2020-2032) (USD Billion)
11.3.1.9.3 Hungary Specialty PACS Market Estimates and Forecasts, by Deployment Model (2020-2032) (USD Billion)
11.3.1.9.4 Hungary Specialty PACS Market Estimates and Forecasts, By End User (2020-2032) (USD Billion)
11.3.1.10 Turkey
11.3.1.10.1 Turkey Specialty PACS Market Estimates and Forecasts, by Type (2020-2032) (USD Billion)
11.3.1.10.2 Turkey Specialty PACS Market Estimates and Forecasts, By Component (2020-2032) (USD Billion)
11.3.1.10.3 Turkey Specialty PACS Market Estimates and Forecasts, by Deployment Model (2020-2032) (USD Billion)
11.3.1.10.4 Turkey Specialty PACS Market Estimates and Forecasts, By End User (2020-2032) (USD Billion)
11.3.1.11 Rest of Eastern Europe
11.3.1.11.1 Rest of Eastern Europe Specialty PACS Market Estimates and Forecasts, by Type (2020-2032) (USD Billion)
11.3.1.11.2 Rest of Eastern Europe Specialty PACS Market Estimates and Forecasts, By Component (2020-2032) (USD Billion)
11.3.1.11.3 Rest of Eastern Europe Specialty PACS Market Estimates and Forecasts, by Deployment Model (2020-2032) (USD Billion)
11.3.1.11.4 Rest of Eastern Europe Specialty PACS Market Estimates and Forecasts, By End User (2020-2032) (USD Billion)
11.3.2 Western Europe
11.3.2.1 Trends Analysis
11.3.2.2 Western Europe Specialty PACS Market Estimates and Forecasts, by Country (2020-2032) (USD Billion)
11.3.2.3 Western Europe Specialty PACS Market Estimates and Forecasts, by Type (2020-2032) (USD Billion)
11.3.2.4 Western Europe Specialty PACS Market Estimates and Forecasts, By Component (2020-2032) (USD Billion)
11.3.2.5 Western Europe Specialty PACS Market Estimates and Forecasts, by Deployment Model (2020-2032) (USD Billion)
11.3.2.6 Western Europe Specialty PACS Market Estimates and Forecasts, By End User (2020-2032) (USD Billion)
11.3.2.7 Germany
11.3.2.7.1 Germany Specialty PACS Market Estimates and Forecasts, by Type (2020-2032) (USD Billion)
11.3.2.7.2 Germany Specialty PACS Market Estimates and Forecasts, By Component (2020-2032) (USD Billion)
11.3.2.7.3 Germany Specialty PACS Market Estimates and Forecasts, by Deployment Model (2020-2032) (USD Billion)
11.3.2.7.4 Germany Specialty PACS Market Estimates and Forecasts, By End User (2020-2032) (USD Billion)
11.3.2.8 France
11.3.2.8.1 France Specialty PACS Market Estimates and Forecasts, by Type (2020-2032) (USD Billion)
11.3.2.8.2 France Specialty PACS Market Estimates and Forecasts, By Component (2020-2032) (USD Billion)
11.3.2.8.3 France Specialty PACS Market Estimates and Forecasts, by Deployment Model (2020-2032) (USD Billion)
11.3.2.8.4 France Specialty PACS Market Estimates and Forecasts, By End User (2020-2032) (USD Billion)
11.3.2.9 UK
11.3.2.9.1 UK Specialty PACS Market Estimates and Forecasts, by Type (2020-2032) (USD Billion)
11.3.2.9.2 UK Specialty PACS Market Estimates and Forecasts, By Component (2020-2032) (USD Billion)
11.3.2.9.3 UK Specialty PACS Market Estimates and Forecasts, by Deployment Model (2020-2032) (USD Billion)
11.3.2.9.4 UK Specialty PACS Market Estimates and Forecasts, By End User (2020-2032) (USD Billion)
11.3.2.10 Italy
11.3.2.10.1 Italy Specialty PACS Market Estimates and Forecasts, by Type (2020-2032) (USD Billion)
11.3.2.10.2 Italy Specialty PACS Market Estimates and Forecasts, By Component (2020-2032) (USD Billion)
11.3.2.10.3 Italy Specialty PACS Market Estimates and Forecasts, by Deployment Model (2020-2032) (USD Billion)
11.3.2.10.4 Italy Specialty PACS Market Estimates and Forecasts, By End User (2020-2032) (USD Billion)
11.3.2.11 Spain
11.3.2.11.1 Spain Specialty PACS Market Estimates and Forecasts, by Type (2020-2032) (USD Billion)
11.3.2.11.2 Spain Specialty PACS Market Estimates and Forecasts, By Component (2020-2032) (USD Billion)
11.3.2.11.3 Spain Specialty PACS Market Estimates and Forecasts, by Deployment Model (2020-2032) (USD Billion)
11.3.2.11.4 Spain Specialty PACS Market Estimates and Forecasts, By End User (2020-2032) (USD Billion)
11.3.2.12 Netherlands
11.3.2.12.1 Netherlands Specialty PACS Market Estimates and Forecasts, by Type (2020-2032) (USD Billion)
11.3.2.12.2 Netherlands Specialty PACS Market Estimates and Forecasts, By Component (2020-2032) (USD Billion)
11.3.2.12.3 Netherlands Specialty PACS Market Estimates and Forecasts, by Deployment Model (2020-2032) (USD Billion)
11.3.2.12.4 Netherlands Specialty PACS Market Estimates and Forecasts, By End User (2020-2032) (USD Billion)
11.3.2.13 Switzerland
11.3.2.13.1 Switzerland Specialty PACS Market Estimates and Forecasts, by Type (2020-2032) (USD Billion)
11.3.2.13.2 Switzerland Specialty PACS Market Estimates and Forecasts, By Component (2020-2032) (USD Billion)
11.3.2.13.3 Switzerland Specialty PACS Market Estimates and Forecasts, by Deployment Model (2020-2032) (USD Billion)
11.3.2.13.4 Switzerland Specialty PACS Market Estimates and Forecasts, By End User (2020-2032) (USD Billion)
11.3.2.14 Austria
11.3.2.14.1 Austria Specialty PACS Market Estimates and Forecasts, by Type (2020-2032) (USD Billion)
11.3.2.14.2 Austria Specialty PACS Market Estimates and Forecasts, By Component (2020-2032) (USD Billion)
11.3.2.14.3 Austria Specialty PACS Market Estimates and Forecasts, by Deployment Model (2020-2032) (USD Billion)
11.3.2.14.4 Austria Specialty PACS Market Estimates and Forecasts, By End User (2020-2032) (USD Billion)
11.3.2.15 Rest of Western Europe
11.3.2.15.1 Rest of Western Europe Specialty PACS Market Estimates and Forecasts, by Type (2020-2032) (USD Billion)
11.3.2.15.2 Rest of Western Europe Specialty PACS Market Estimates and Forecasts, By Component (2020-2032) (USD Billion)
11.3.2.15.3 Rest of Western Europe Specialty PACS Market Estimates and Forecasts, by Deployment Model (2020-2032) (USD Billion)
11.3.2.15.4 Rest of Western Europe Specialty PACS Market Estimates and Forecasts, By End User (2020-2032) (USD Billion)
11.4 Asia Pacific
11.4.1 Trends Analysis
11.4.2 Asia Pacific Specialty PACS Market Estimates and Forecasts, by Country (2020-2032) (USD Billion)
11.4.3 Asia Pacific Specialty PACS Market Estimates and Forecasts, by Type (2020-2032) (USD Billion)
11.4.4 Asia Pacific Specialty PACS Market Estimates and Forecasts, By Component (2020-2032) (USD Billion)
11.4.5 Asia Pacific Specialty PACS Market Estimates and Forecasts, by Deployment Model (2020-2032) (USD Billion)
11.4.6 Asia Pacific Specialty PACS Market Estimates and Forecasts, By End User (2020-2032) (USD Billion)
11.4.7 China
11.4.7.1 China Specialty PACS Market Estimates and Forecasts, by Type (2020-2032) (USD Billion)
11.4.7.2 China Specialty PACS Market Estimates and Forecasts, By Component (2020-2032) (USD Billion)
11.4.7.3 China Specialty PACS Market Estimates and Forecasts, by Deployment Model (2020-2032) (USD Billion)
11.4.7.4 China Specialty PACS Market Estimates and Forecasts, By End User (2020-2032) (USD Billion)
11.4.8 India
11.4.8.1 India Specialty PACS Market Estimates and Forecasts, by Type (2020-2032) (USD Billion)
11.4.8.2 India Specialty PACS Market Estimates and Forecasts, By Component (2020-2032) (USD Billion)
11.4.8.3 India Specialty PACS Market Estimates and Forecasts, by Deployment Model (2020-2032) (USD Billion)
11.4.8.4 India Specialty PACS Market Estimates and Forecasts, By End User (2020-2032) (USD Billion)
11.4.9 Japan
11.4.9.1 Japan Specialty PACS Market Estimates and Forecasts, by Type (2020-2032) (USD Billion)
11.4.9.2 Japan Specialty PACS Market Estimates and Forecasts, By Component (2020-2032) (USD Billion)
11.4.9.3 Japan Specialty PACS Market Estimates and Forecasts, by Deployment Model (2020-2032) (USD Billion)
11.4.9.4 Japan Specialty PACS Market Estimates and Forecasts, By End User (2020-2032) (USD Billion)
11.4.10 South Korea
11.4.10.1 South Korea Specialty PACS Market Estimates and Forecasts, by Type (2020-2032) (USD Billion)
11.4.10.2 South Korea Specialty PACS Market Estimates and Forecasts, By Component (2020-2032) (USD Billion)
11.4.10.3 South Korea Specialty PACS Market Estimates and Forecasts, by Deployment Model(2020-2032) (USD Billion)
11.4.10.4 South Korea Specialty PACS Market Estimates and Forecasts, By End User (2020-2032) (USD Billion)
11.4.11 Vietnam
11.4.11.1 Vietnam Specialty PACS Market Estimates and Forecasts, by Type (2020-2032) (USD Billion)
11.4.11.2 Vietnam Specialty PACS Market Estimates and Forecasts, By Component (2020-2032) (USD Billion)
11.4.11.3 Vietnam Specialty PACS Market Estimates and Forecasts, by Deployment Model (2020-2032) (USD Billion)
11.4.11.4 Vietnam Specialty PACS Market Estimates and Forecasts, By End User (2020-2032) (USD Billion)
11.4.12 Singapore
11.4.12.1 Singapore Specialty PACS Market Estimates and Forecasts, by Type (2020-2032) (USD Billion)
11.4.12.2 Singapore Specialty PACS Market Estimates and Forecasts, By Component (2020-2032) (USD Billion)
11.4.12.3 Singapore Specialty PACS Market Estimates and Forecasts, by Deployment Model (2020-2032) (USD Billion)
11.4.12.4 Singapore Specialty PACS Market Estimates and Forecasts, By End User (2020-2032) (USD Billion)
11.4.13 Australia
11.4.13.1 Australia Specialty PACS Market Estimates and Forecasts, by Type (2020-2032) (USD Billion)
11.4.13.2 Australia Specialty PACS Market Estimates and Forecasts, By Component (2020-2032) (USD Billion)
11.4.13.3 Australia Specialty PACS Market Estimates and Forecasts, by Deployment Model (2020-2032) (USD Billion)
11.4.13.4 Australia Specialty PACS Market Estimates and Forecasts, By End User (2020-2032) (USD Billion)
11.4.14 Rest of Asia Pacific
11.4.14.1 Rest of Asia Pacific Specialty PACS Market Estimates and Forecasts, by Type (2020-2032) (USD Billion)
11.4.14.2 Rest of Asia Pacific Specialty PACS Market Estimates and Forecasts, By Component (2020-2032) (USD Billion)
11.4.14.3 Rest of Asia Pacific Specialty PACS Market Estimates and Forecasts, by Deployment Model (2020-2032) (USD Billion)
11.4.14.4 Rest of Asia Pacific Specialty PACS Market Estimates and Forecasts, By End User (2020-2032) (USD Billion)
11.5 Middle East and Africa
11.5.1 Middle East
11.5.1.1 Trends Analysis
11.5.1.2 Middle East Specialty PACS Market Estimates and Forecasts, by Country (2020-2032) (USD Billion)
11.5.1.3 Middle East Specialty PACS Market Estimates and Forecasts, by Type (2020-2032) (USD Billion)
11.5.1.4 Middle East Specialty PACS Market Estimates and Forecasts, By Component (2020-2032) (USD Billion)
11.5.1.5 Middle East Specialty PACS Market Estimates and Forecasts, by Deployment Model (2020-2032) (USD Billion)
11.5.1.6 Middle East Specialty PACS Market Estimates and Forecasts, By End User (2020-2032) (USD Billion)
11.5.1.7 UAE
11.5.1.7.1 UAE Specialty PACS Market Estimates and Forecasts, by Type (2020-2032) (USD Billion)
11.5.1.7.2 UAE Specialty PACS Market Estimates and Forecasts, By Component (2020-2032) (USD Billion)
11.5.1.7.3 UAE Specialty PACS Market Estimates and Forecasts, by Deployment Model (2020-2032) (USD Billion)
11.5.1.7.4 UAE Specialty PACS Market Estimates and Forecasts, By End User (2020-2032) (USD Billion)
11.5.1.8 Egypt
11.5.1.8.1 Egypt Specialty PACS Market Estimates and Forecasts, by Type (2020-2032) (USD Billion)
11.5.1.8.2 Egypt Specialty PACS Market Estimates and Forecasts, By Component (2020-2032) (USD Billion)
11.5.1.8.3 Egypt Specialty PACS Market Estimates and Forecasts, by Deployment Model (2020-2032) (USD Billion)
11.5.1.8.4 Egypt Specialty PACS Market Estimates and Forecasts, By End User (2020-2032) (USD Billion)
11.5.1.9 Saudi Arabia
11.5.1.9.1 Saudi Arabia Specialty PACS Market Estimates and Forecasts, by Type (2020-2032) (USD Billion)
11.5.1.9.2 Saudi Arabia Specialty PACS Market Estimates and Forecasts, By Component (2020-2032) (USD Billion)
11.5.1.9.3 Saudi Arabia Specialty PACS Market Estimates and Forecasts, by Deployment Model (2020-2032) (USD Billion)
11.5.1.9.4 Saudi Arabia Specialty PACS Market Estimates and Forecasts, By End User (2020-2032) (USD Billion)
11.5.1.10 Qatar
11.5.1.10.1 Qatar Specialty PACS Market Estimates and Forecasts, by Type (2020-2032) (USD Billion)
11.5.1.10.2 Qatar Specialty PACS Market Estimates and Forecasts, By Component (2020-2032) (USD Billion)
11.5.1.10.3 Qatar Specialty PACS Market Estimates and Forecasts, by Deployment Model (2020-2032) (USD Billion)
11.5.1.10.4 Qatar Specialty PACS Market Estimates and Forecasts, By End User (2020-2032) (USD Billion)
11.5.1.11 Rest of Middle East
11.5.1.11.1 Rest of Middle East Specialty PACS Market Estimates and Forecasts, by Type (2020-2032) (USD Billion)
11.5.1.11.2 Rest of Middle East Specialty PACS Market Estimates and Forecasts, By Component (2020-2032) (USD Billion)
11.5.1.11.3 Rest of Middle East Specialty PACS Market Estimates and Forecasts, by Deployment Model (2020-2032) (USD Billion)
11.5.1.11.4 Rest of Middle East Specialty PACS Market Estimates and Forecasts, By End User (2020-2032) (USD Billion)
11.5.2 Africa
11.5.2.1 Trends Analysis
11.5.2.2 Africa Specialty PACS Market Estimates and Forecasts, by Country (2020-2032) (USD Billion)
11.5.2.3 Africa Specialty PACS Market Estimates and Forecasts, by Type (2020-2032) (USD Billion)
11.5.2.4 Africa Specialty PACS Market Estimates and Forecasts, By Component (2020-2032) (USD Billion)
11.5.2.5 Africa Specialty PACS Market Estimates and Forecasts, by Deployment Model (2020-2032) (USD Billion)
11.5.2.6 Africa Specialty PACS Market Estimates and Forecasts, By End User (2020-2032) (USD Billion)
11.5.2.7 South Africa
11.5.2.7.1 South Africa Specialty PACS Market Estimates and Forecasts, by Type (2020-2032) (USD Billion)
11.5.2.7.2 South Africa Specialty PACS Market Estimates and Forecasts, By Component (2020-2032) (USD Billion)
11.5.2.7.3 South Africa Specialty PACS Market Estimates and Forecasts, by Deployment Model (2020-2032) (USD Billion)
11.5.2.7.4 South Africa Specialty PACS Market Estimates and Forecasts, By End User (2020-2032) (USD Billion)
11.5.2.8 Nigeria
11.5.2.8.1 Nigeria Specialty PACS Market Estimates and Forecasts, by Type (2020-2032) (USD Billion)
11.5.2.8.2 Nigeria Specialty PACS Market Estimates and Forecasts, By Component (2020-2032) (USD Billion)
11.5.2.8.3 Nigeria Specialty PACS Market Estimates and Forecasts, by Deployment Model (2020-2032) (USD Billion)
11.5.2.8.4 Nigeria Specialty PACS Market Estimates and Forecasts, By End User (2020-2032) (USD Billion)
11.5.2.9 Rest of Africa
11.5.2.9.1 Rest of Africa Specialty PACS Market Estimates and Forecasts, by Type (2020-2032) (USD Billion)
11.5.2.9.2 Rest of Africa Specialty PACS Market Estimates and Forecasts, By Component (2020-2032) (USD Billion)
11.5.2.9.3 Rest of Africa Specialty PACS Market Estimates and Forecasts, by Deployment Model (2020-2032) (USD Billion)
11.5.2.9.4 Rest of Africa Specialty PACS Market Estimates and Forecasts, By End User (2020-2032) (USD Billion)
11.6 Latin America
11.6.1 Trends Analysis
11.6.2 Latin America Specialty PACS Market Estimates and Forecasts, by Country (2020-2032) (USD Billion)
11.6.3 Latin America Specialty PACS Market Estimates and Forecasts, by Type (2020-2032) (USD Billion)
11.6.4 Latin America Specialty PACS Market Estimates and Forecasts, By Component (2020-2032) (USD Billion)
11.6.5 Latin America Specialty PACS Market Estimates and Forecasts, by Deployment Model (2020-2032) (USD Billion)
11.6.6 Latin America Specialty PACS Market Estimates and Forecasts, By End User (2020-2032) (USD Billion)
11.6.7 Brazil
11.6.7.1 Brazil Specialty PACS Market Estimates and Forecasts, by Type (2020-2032) (USD Billion)
11.6.7.2 Brazil Specialty PACS Market Estimates and Forecasts, By Component (2020-2032) (USD Billion)
11.6.7.3 Brazil Specialty PACS Market Estimates and Forecasts, by Deployment Model (2020-2032) (USD Billion)
11.6.7.4 Brazil Specialty PACS Market Estimates and Forecasts, By End User (2020-2032) (USD Billion)
11.6.8 Argentina
11.6.8.1 Argentina Specialty PACS Market Estimates and Forecasts, by Type (2020-2032) (USD Billion)
11.6.8.2 Argentina Specialty PACS Market Estimates and Forecasts, By Component (2020-2032) (USD Billion)
11.6.8.3 Argentina Specialty PACS Market Estimates and Forecasts, by Deployment Model (2020-2032) (USD Billion)
11.6.8.4 Argentina Specialty PACS Market Estimates and Forecasts, By End User (2020-2032) (USD Billion)
11.6.9 Colombia
11.6.9.1 Colombia Specialty PACS Market Estimates and Forecasts, by Type (2020-2032) (USD Billion)
11.6.9.2 Colombia Specialty PACS Market Estimates and Forecasts, By Component (2020-2032) (USD Billion)
11.6.9.3 Colombia Specialty PACS Market Estimates and Forecasts, by Deployment Model (2020-2032) (USD Billion)
11.6.9.4 Colombia Specialty PACS Market Estimates and Forecasts, By End User (2020-2032) (USD Billion)
11.6.10 Rest of Latin America
11.6.10.1 Rest of Latin America Specialty PACS Market Estimates and Forecasts, by Type (2020-2032) (USD Billion)
11.6.10.2 Rest of Latin America Specialty PACS Market Estimates and Forecasts, By Component (2020-2032) (USD Billion)
11.6.10.3 Rest of Latin America Specialty PACS Market Estimates and Forecasts, by Deployment Model (2020-2032) (USD Billion)
11.6.10.4 Rest of Latin America Specialty PACS Market Estimates and Forecasts, By End User (2020-2032) (USD Billion)
12. Company Profiles
12.1 IBM Corporation (Merge Healthcare Incorporated)
12.1.1 Company Overview
12.1.2 Financial
12.1.3 Product / Services Offered
12.1.4 SWOT Analysis
12.2 GE HealthCare
12.2.1 Company Overview
12.2.2 Financial
12.2.3 Product / Services Offered
12.2.4 SWOT Analysis
12.3 Koninklijke Philips NV
12.3.1 Company Overview
12.3.2 Financial
12.3.3 Product / Services Offered
12.3.4 SWOT Analysis
12.4 FUJIFILM Corporation
12.4.1 Company Overview
12.4.2 Financial
12.4.3 Product / Services Offered
12.4.4 SWOT Analysis
12.5 Siemens AG
12.5.1 Company Overview
12.5.2 Financial
12.5.3 Product / Services Offered
12.5.4 SWOT Analysis
12.6 Intelerad
12.6.1 Company Overview
12.6.2 Financial
12.6.3 Product / Services Offered
12.6.4 SWOT Analysis
12.7 RamSoft
12.7.1 Company Overview
12.7.2 Financial
12.7.3 Product / Services Offered
12.7.4 SWOT Analysis
12.8 McKesson Corporation
12.8.1 Company Overview
12.8.2 Financial
12.8.3 Product / Services Offered
12.8.4 SWOT Analysis
12.9 Agfa Healthcare
12.9.1 Company Overview
12.9.2 Financial
12.9.3 Product / Services Offered
12.9.4 SWOT Analysis
12.10 Carestream Health
12.10.1 Company Overview
12.10.2 Financial
12.10.3 Product / Services Offered
12.10.4 SWOT Analysis
13. Use Cases and Best Practices
14. Conclusion
An accurate research report requires proper strategizing as well as implementation. There are multiple factors involved in the completion of good and accurate research report and selecting the best methodology to compete the research is the toughest part. Since the research reports we provide play a crucial role in any company’s decision-making process, therefore we at SNS Insider always believe that we should choose the best method which gives us results closer to reality. This allows us to reach at a stage wherein we can provide our clients best and accurate investment to output ratio.
Each report that we prepare takes a timeframe of 350-400 business hours for production. Starting from the selection of titles through a couple of in-depth brain storming session to the final QC process before uploading our titles on our website we dedicate around 350 working hours. The titles are selected based on their current market cap and the foreseen CAGR and growth.
The 5 steps process:
Step 1: Secondary Research:
Secondary Research or Desk Research is as the name suggests is a research process wherein, we collect data through the readily available information. In this process we use various paid and unpaid databases which our team has access to and gather data through the same. This includes examining of listed companies’ annual reports, Journals, SEC filling etc. Apart from this our team has access to various associations across the globe across different industries. Lastly, we have exchange relationships with various university as well as individual libraries.

Step 2: Primary Research
When we talk about primary research, it is a type of study in which the researchers collect relevant data samples directly, rather than relying on previously collected data. This type of research is focused on gaining content specific facts that can be sued to solve specific problems. Since the collected data is fresh and first hand therefore it makes the study more accurate and genuine.
We at SNS Insider have divided Primary Research into 2 parts.
Part 1 wherein we interview the KOLs of major players as well as the upcoming ones across various geographic regions. This allows us to have their view over the market scenario and acts as an important tool to come closer to the accurate market numbers. As many as 45 paid and unpaid primary interviews are taken from both the demand and supply side of the industry to make sure we land at an accurate judgement and analysis of the market.
This step involves the triangulation of data wherein our team analyses the interview transcripts, online survey responses and observation of on filed participants. The below mentioned chart should give a better understanding of the part 1 of the primary interview.

Part 2: In this part of primary research the data collected via secondary research and the part 1 of the primary research is validated with the interviews from individual consultants and subject matter experts.
Consultants are those set of people who have at least 12 years of experience and expertise within the industry whereas Subject Matter Experts are those with at least 15 years of experience behind their back within the same space. The data with the help of two main processes i.e., FGDs (Focused Group Discussions) and IDs (Individual Discussions). This gives us a 3rd party nonbiased primary view of the market scenario making it a more dependable one while collation of the data pointers.
Step 3: Data Bank Validation
Once all the information is collected via primary and secondary sources, we run that information for data validation. At our intelligence centre our research heads track a lot of information related to the market which includes the quarterly reports, the daily stock prices, and other relevant information. Our data bank server gets updated every fortnight and that is how the information which we collected using our primary and secondary information is revalidated in real time.

Step 4: QA/QC Process
After all the data collection and validation our team does a final level of quality check and quality assurance to get rid of any unwanted or undesired mistakes. This might include but not limited to getting rid of the any typos, duplication of numbers or missing of any important information. The people involved in this process include technical content writers, research heads and graphics people. Once this process is completed the title gets uploader on our platform for our clients to read it.
Step 5: Final QC/QA Process:
This is the last process and comes when the client has ordered the study. In this process a final QA/QC is done before the study is emailed to the client. Since we believe in giving our clients a good experience of our research studies, therefore, to make sure that we do not lack at our end in any way humanly possible we do a final round of quality check and then dispatch the study to the client.
By Type
Radiology PACS
Cardiology PACS
Pathology PACS
Ophthalmology PACS
Orthopedics PACS
Oncology PACS
Dermatology PACS
Neurology PACS
Endoscopy PACS
Women’s Health PACS
Other specialty PACS
By Component
Hardware
Software
Services
By Deployment Model
On-premise specialty PACS
Web/Cloud-based specialty PACS
By End-User
Hospitals
Ambulatory Surgery Centers & Clinics
Diagnostic Imaging Centers
Other End Users
Request for Segment Customization as per your Business Requirement: Segment Customization Request
Regional Coverage:
North America
US
Canada
Mexico
Europe
Eastern Europe
Poland
Romania
Hungary
Turkey
Rest of Eastern Europe
Western Europe
Germany
France
UK
Italy
Spain
Netherlands
Switzerland
Austria
Rest of Western Europe
Asia Pacific
China
India
Japan
South Korea
Vietnam
Singapore
Australia
Rest of Asia Pacific
Middle East & Africa
Middle East
UAE
Egypt
Saudi Arabia
Qatar
Rest of the Middle East
Africa
Nigeria
South Africa
Rest of Africa
Latin America
Brazil
Argentina
Colombia
Rest of Latin America
Request for Country Level Research Report: Country Level Customization Request
Available Customization
With the given market data, SNS Insider offers customization to meet the company’s specific needs. The following customization options are available for the report:
Product Analysis
Criss-Cross segment analysis (e.g. Product X Application)
Product Matrix which gives a detailed comparison of the product portfolio of each company
Geographic Analysis
Additional countries in any of the regions
Company Information
Detailed analysis and profiling of additional market players (Up to five)
The Healthcare Analytical Testing Services Market Size was valued at USD 7.37 Bn in 2023, expected to reach USD 19.14 Bn by 2032 growing at a CAGR of 11.21%.
Capillary Electrophoresis Market size was USD 354.7 Million in 2023, expected to reach USD 567.7 Million by 2032, growing at a CAGR of 5.38% from 2024-2032.
The Surgical Sutures Market size was projected at USD 4.55 billion in 2023 and is anticipated to reach USD 7.18 billion by 2032 at a CAGR of 5.2% over the forecast period of 2024-2032.
The Ventricular Assist Device Market Size was USD 1.6 Billion in 2023 and is projected to grow to USD 3.3 Billion by 2032, with a CAGR of 8.8%.
The Intraoral Cameras Market size was valued at USD 2.2 billion in 2023 and is expected to reach USD 5.8 billion by 2032 and grow at a CAGR of 11.4% over the forecast period 2024-2032.
The Geographic Atrophy (GA) Market Size was valued at USD 23.7 Billion in 2023 and is expected to reach USD 50.0 Billion by 2032 and grow at a CAGR of 8.6% over the forecast period 2024-2032.

Hi! Click one of our member below to chat on Phone
© 2025 All Rights Reserved by SNS Insider Pvt Ltd


