image

Spatial Omics Market Report Scope & Overview:

Spatial Omics market Revenue Analysis

Get more information on Spatial Omics Market - Request Free Sample Report

The Spatial Omics Market Size was valued at USD 451.76 Million in 2023 and is expected to reach USD 1,308.88 Million by 2032, growing at a CAGR of 12.55% over the forecast period of 2024-2032.

The Spatial Omics Market is witnessing dynamic growth, propelled by technological breakthroughs and rising financial support. Our report uncovers key investment trends and funding analysis, showcasing how capital flow is accelerating innovation. It also explores evolving regulatory frameworks and compliance standards, which guide the safe deployment of these advanced technologies. As adoption spreads, the customer value proposition and benefits become central, emphasizing enhanced precision in diagnostics and research. With environmental consciousness rising, our study highlights sustainability and green initiatives adopted by leading players. Moreover, global trade policies and their impacts are examined, revealing how international regulations and tariffs influence market expansion. Together, these elements paint a comprehensive picture of a market poised for transformative growth.

The US Spatial Omics Market Size was valued at USD 144.38 Million in 2023 with a market share of around 81% and growing at a significant CAGR over the forecast period of 2024-2032.

The US Spatial Omics Market is experiencing significant growth due to robust research initiatives, increasing funding, and advancements in biotechnology. Key drivers include the strong presence of leading institutions like the National Institutes of Health (NIH) and major companies such as 10x Genomics, which are pioneering innovative spatial omics technologies. The growing demand for precision medicine, coupled with the need for more accurate diagnostics and treatments, accelerates market expansion. Additionally, the integration of artificial intelligence in spatial data analysis is opening new frontiers, further boosting the market’s growth prospects.

Market Dynamics

Drivers

  • Unprecedented Growth in Spatial Omics Through Innovative Integration of Artificial Intelligence, Machine Learning, and Advanced Bioinformatics Platforms Driving Data Analysis

The Spatial Omics Market is experiencing remarkable expansion through the innovative integration of artificial intelligence, machine learning, and advanced bioinformatics platforms. In this dynamic environment, emerging technologies are being harnessed to transform vast and complex biological datasets into actionable insights. Cutting-edge artificial intelligence algorithms and machine learning techniques are increasingly applied to analyze spatial gene expression, protein distribution, and tissue architecture. Advanced bioinformatics platforms are playing a pivotal role in integrating diverse data sources, enabling the precise mapping of cellular functions and molecular interactions in situ. This integration facilitates faster and more accurate data interpretation, thereby accelerating discovery and clinical translation. Furthermore, the seamless connection between computational models and experimental data supports predictive analytics that drive personalized medicine strategies. The convergence of these technological innovations is not only streamlining research workflows but also empowering researchers to overcome previous analytical limitations. This growth trajectory is fueling significant investments and fostering an ecosystem of continuous improvement. The comprehensive analysis provided in our report details how these innovations are reshaping the Spatial Omics Market, driving breakthroughs that promise to revolutionize diagnostic and therapeutic applications across a broad spectrum of life sciences.

Restraints

  • High Operational and Infrastructure Costs Hinder Widespread Adoption of Advanced Spatial Omics Technologies Due to Complexity and Significant Investment Requirements

A major restraint affecting the Spatial Omics Market is the high operational and infrastructure costs that hinder widespread adoption of advanced spatial omics technologies. These technologies require substantial capital investment in sophisticated instruments, specialized facilities, and high-performance computational infrastructure to manage and analyze large-scale data. The inherent complexity of spatial omics workflows, which integrate multiple high-throughput techniques and advanced imaging systems, further escalates the operational expenses. For many research organizations, especially smaller academic institutions and emerging biotechnology companies, the financial burden associated with establishing and maintaining these state-of-the-art facilities represents a significant barrier. Additionally, the costs extend beyond mere acquisition of equipment; they include ongoing expenses related to system calibration, software updates, data storage, and personnel training. Our report delves into these financial challenges, outlining how high investment requirements can slow market penetration and limit accessibility. Detailed case studies illustrate the economic implications of implementing spatial omics solutions, emphasizing the need for innovative financing models and collaborative funding strategies to mitigate these cost barriers. Addressing these challenges remains crucial for ensuring that the benefits of spatial omics can be more broadly realized across diverse research and clinical settings.

Opportunities

  • Collaborative Innovations Between Industry and Academic Institutions Create Opportunities to Develop Breakthrough Spatial Omics Solutions for Advanced Clinical Applications Worldwide

Collaborative innovations between industry leaders and academic institutions are driving significant opportunities for the development of breakthrough spatial omics solutions aimed at advanced clinical applications worldwide. These collaborative efforts bring together the strengths of cutting-edge research and commercial expertise, fostering an environment where novel ideas and technologies can flourish. Partnerships enable the pooling of resources, expertise, and data, which are critical for overcoming technical challenges and accelerating the development of robust spatial omics platforms. This cooperation has led to the co-creation of innovative tools that combine high-resolution imaging, multi-omics data integration, and sophisticated computational analysis. Such solutions are essential for unraveling complex biological phenomena and translating research findings into clinical diagnostics and personalized therapies. Our report provides a detailed exploration of several case studies where industry-academic collaborations have resulted in significant advancements, driving forward the potential of spatial omics technologies. It also discusses strategic frameworks that support these partnerships, including joint funding initiatives, shared research facilities, and collaborative training programs. The analysis underscores how these integrated efforts are paving the way for new clinical applications, ultimately enhancing patient care and contributing to the overall growth of the Spatial Omics Market on a global scale.

Challenge

  • Complex Data Integration and Management Pose Significant Challenges for Interpreting Spatial Omics Results Due to Heterogeneous and Large-Scale Data Generation

A critical challenge in the Spatial Omics Market is the complex data integration and management required for interpreting spatial omics results, given the heterogeneous and large-scale data generation inherent to these technologies. The process involves the aggregation of diverse datasets, including high-resolution imaging, gene expression profiles, and proteomic information, each with its unique format and scale. The challenge lies in seamlessly integrating these varied data types into a coherent analytical framework that can deliver reliable and reproducible insights. Advanced computational tools are necessary to manage the massive volumes of data generated, yet these tools must also accommodate the inherent variability across different experimental platforms and research settings. Our report examines the technical and infrastructural hurdles associated with data integration in the Spatial Omics Market. It details how researchers and companies are developing novel algorithms and data management systems to address these challenges, ensuring that data can be effectively standardized, processed, and analyzed. This comprehensive discussion highlights the importance of continued innovation in computational methodologies and data infrastructure to unlock the full potential of spatial omics research. The report also explores collaborative efforts between technology providers and research institutions aimed at creating unified data platforms, which are essential for advancing the field and achieving clinical translation.

Segmental Analysis

By Product

Consumable products dominated the Spatial Omics Market in 2023 with a market share of 45.5%, largely because consumables such as reagents, antibodies, and specialized chemicals are critical to conducting high-precision spatial assays. This dominance is driven by the continual demand from research institutions and biotechnology companies for high-quality consumables that ensure reproducibility and reliability in experiments. For example, leading organizations such as 10x Genomics and NanoString Technologies rely on advanced consumable products to support their spatial analysis platforms, and industry associations like the Association for Molecular Pathology have highlighted the importance of standardized consumables in achieving consistent results. Government initiatives that fund innovative research projects have also underscored the necessity for dependable consumable supplies, further reinforcing their market dominance. The robust supply chain networks, rapid product development cycles, and continuous improvements in product quality have enabled consumables to not only meet the rigorous demands of advanced spatial omics research but also drive market growth by offering improved sensitivity and accuracy in molecular imaging and profiling. This comprehensive focus on consumables reflects the broader trend in life sciences toward optimizing laboratory workflows and ensuring data integrity, ultimately making consumable products a foundational pillar of the Spatial Omics Market.

By Sample Type

Formalin-Fixed Paraffin-Embedded samples dominated the sample type segment with a market share of 60.7% in 2023, reflecting their widespread use in clinical and research laboratories due to their excellent preservation of tissue morphology and long-term stability. FFPE samples are extensively utilized in pathology laboratories and diagnostic centers, as they enable retrospective studies and provide archival tissue resources for biomarker discovery. Prominent organizations such as the American Society of Clinical Pathology have advocated for the continued use of FFPE due to its cost-effectiveness and reliability, while recent governmental funding announcements have further boosted research initiatives using these samples. This robust preference is also supported by the established protocols and validation studies available for FFPE, which have been refined over decades. The ease of handling and the ability to perform multiplexed analyses using FFPE samples have positioned them as the backbone of spatial omics applications, particularly in oncology and personalized medicine. The strong market position of FFPE samples underscores their critical role in enabling comprehensive spatial profiling and molecular diagnostics, thereby contributing significantly to the overall expansion of the Spatial Omics Market.

By Technology

Spatial Transcriptomics emerged as the dominating technology in 2023 with a market share of 40.9%, driven by its ability to map gene expression within intact tissue architecture and reveal cellular heterogeneity at unprecedented resolution. The technique has revolutionized our understanding of complex biological systems by allowing researchers to visualize gene expression patterns in the spatial context of tissues, thereby facilitating breakthroughs in areas such as cancer research and developmental biology. Esteemed institutions like the National Institutes of Health and leading companies including 10x Genomics have embraced spatial transcriptomics due to its high resolution and versatility. Regulatory bodies have also recognized its potential in improving diagnostic accuracy, further spurring its adoption. Additionally, recent government-sponsored research programs and collaborations between academic institutions and industry partners have accelerated the development and refinement of spatial transcriptomics platforms. The technology’s ability to combine imaging with molecular data has provided researchers with a powerful tool for identifying novel therapeutic targets and understanding disease mechanisms, making it an indispensable component of the Spatial Omics Market.

By Application

Diagnostics dominated the application segment with a market share of 49.4% in 2023, owing to the critical need for precise and early disease detection facilitated by spatial omics technologies. The integration of spatial omics into diagnostic workflows has led to significant advancements in identifying molecular signatures within tissues, thereby enhancing the accuracy of cancer diagnoses and other complex diseases. This dominance is supported by initiatives from government health agencies and research institutions, such as the National Cancer Institute, which emphasize the importance of early detection in improving patient outcomes. Leading companies have leveraged spatial omics to develop diagnostic assays that offer high sensitivity and specificity, thereby enabling more personalized treatment strategies. Regulatory endorsements and clinical trial successes have further reinforced the credibility of spatial omics-based diagnostics, establishing them as a key driver in the medical community. The transformative potential of spatial omics in diagnostics is not only reshaping clinical practices but is also paving the way for novel therapeutic interventions, making diagnostics a central pillar in the growth of the Spatial Omics Market.

By Workflow

Instrumental Analysis claimed dominance in the workflow segment with a market share of 43.8% in 2023, as it forms the critical backbone for data acquisition in spatial omics studies. High-performance instruments, such as advanced microscopy and mass spectrometry systems, are indispensable for capturing high-resolution spatial data from tissue samples, enabling detailed molecular characterization. The widespread adoption of sophisticated imaging platforms by research organizations and biotechnology companies underscores the essential role of instrumental analysis. Regulatory agencies and government-funded research programs have continually emphasized the importance of robust analytical instrumentation in enhancing the reproducibility and accuracy of scientific data. For instance, associations like the American Association for Cancer Research highlight how state-of-the-art instruments drive innovation in diagnostic and therapeutic applications. The continuous technological advancements and increasing investments in research infrastructure have made instrumental analysis a focal point in the Spatial Omics Market, ensuring that data collection is both precise and comprehensive, ultimately propelling market growth.

By End-use

Academic and Translational Research Institutes dominated the end-use segment with a market share of 40.8% in 2023, primarily due to their pivotal role in pioneering spatial omics research and innovation. These institutes, including renowned universities and government-funded research centers, drive forward the development of novel spatial technologies through extensive collaborative projects and public–private partnerships. The academic sector’s commitment to advancing biomedical research is reflected in substantial investments in cutting-edge facilities and training programs, which foster the integration of spatial omics into routine laboratory practice. For example, initiatives supported by organizations such as the National Institutes of Health and the Association of American Medical Colleges have bolstered research capabilities by funding projects that incorporate spatial omics methodologies. Additionally, translational research institutes serve as a bridge between laboratory discoveries and clinical applications, accelerating the process of converting scientific insights into practical diagnostic and therapeutic solutions. This robust engagement from the academic and translational research community has not only enhanced the technological landscape but also contributed significantly to the sustained growth of the Spatial Omics Market, reinforcing its status as an essential driver of innovation and progress in modern biomedical research.
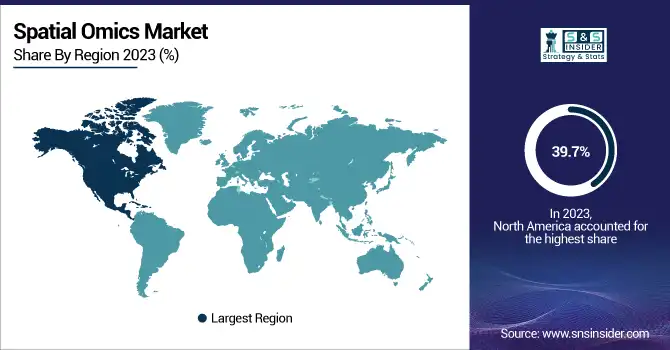
Regional Analysis

North America dominated the Spatial Omics Market in 2023 with a market share of 39.7%, reflecting a highly developed infrastructure and a strong emphasis on biomedical research and innovation. The region is home to leading research institutions such as the National Institutes of Health and top-tier universities, which foster a conducive environment for spatial omics advancements. Prominent companies based in the United States, including 10x Genomics and NanoString Technologies, have significantly contributed to the market by continuously developing and refining state-of-the-art spatial omics platforms. Government initiatives and funding programs, like those from the National Cancer Institute, have further accelerated research and commercialization of these technologies. The integration of robust regulatory frameworks and supportive trade policies has also enhanced market growth, making North America a hub for cutting-edge diagnostics and precision medicine. With extensive collaborations between academia, industry, and government agencies, the region remains a critical driver of innovation and a leading force in shaping the future of spatial omics research and clinical applications.

On the other hand, Asia Pacific emerged as the fastest growing region in the Spatial Omics Market, with a substantial growth rate over the forecast period of 2024 to 2032, driven by rapid technological adoption and increased investments in life science research. Key markets in countries like China, Japan, and South Korea are experiencing accelerated growth due to the establishment of advanced research centers and increased government support for biotechnology initiatives. Regional governments are implementing strategic policies and funding programs to enhance research capabilities, while local companies are investing heavily in spatial omics infrastructure and innovation. For instance, research institutions in China have recently partnered with global companies to develop localized spatial omics solutions, further bolstering market expansion. The growing presence of regional conferences and academic symposia in these countries is also fostering knowledge exchange and collaboration, accelerating the integration of spatial omics into clinical practice. This combination of strong governmental backing, industry collaborations, and an expanding research ecosystem is setting the stage for Asia Pacific to become a major player in the global Spatial Omics Market, driving forward a new era of innovation and precision diagnostics.

Spatial-Omics-Market-Regional-Share

Do You Need any Customization Research on Spatial Omics Market - Enquire Now

Key Players

  • 10x Genomics (Visium Spatial Gene Expression, Xenium In Situ Gene Expression)

  • Akoya Biosciences, Inc. (PhenoCycler-Fusion, Phenoptics)

  • Bio-Techne (RNAscope, Advanced Cell Diagnostics - RNAScope)

  • Bruker Corporation (MALDI Imaging, TIMS-TOF Pro)

  • Dovetail Genomics (Cantata Bio.) (Hi-C, Micro-C)

  • Illumina, Inc. (NextSeq 1000, NovaSeq 6000)

  • Ionpath, Inc. (MIBI, MIBI-TOF)

  • NanoString Technologies, Inc. (GeoMx Digital Spatial Profiler, nCounter Analysis System)

  • RareCyte, Inc. (CyteFinder System, CyteJet)

  • Vizgen, Inc. (MERSCOPE, MERFISH)

  • Advanced Cell Diagnostics, Inc. (RNAscope, BaseScope)

  • Biognosys AG (SpectroMine, Panorama)

  • Fluidigm Corporation (CyTOF, Helios)

  • Lunaphore Technologies S.A. (PhenoImager, PhenoCycler)

  • Molecular Machines & Industries GmbH (Molecular Machine Imaging System, Spatial Protein Profiling)

  • PerkinElmer, Inc. (Vectra Polaris, Opera Phenix)

  • Rebus Biosystems, Inc. (REBUS Imaging Platform, REBUS Scanning Technology)

  • Standard BioTools Inc. (CellStream, IonFlux)

  • Zeiss Group (ZEISS LSM 980, ZEISS Axio Imager)

  • GE Healthcare (Inveon PET, Discovery MI)

Recent Developments

  • February 2025: Illumina announced a groundbreaking spatial transcriptomics technology designed to analyze millions of cells per experiment. This innovation offers a capture area nine times larger and four times the resolution of existing technologies. It is compatible with Illumina's NextSeq and NovaSeq sequencers and is slated for commercial release in 2026.

  • January 2025: Researchers at the University of Pennsylvania's Perelman School of Medicine developed an AI-powered tool named MISO (Multi-modal Spatial Omics). MISO can detect cell-level characteristics of cancer by analyzing data from extremely small tissue samples, enhancing the precision of cancer diagnostics and potentially guiding personalized therapies.

  • November 2024: MGI Tech entered into a partnership with the Human Cell Atlas consortium to advance global human cell mapping efforts. Under this collaboration, MGI committed to providing HCA members with discounted access to its single-cell and spatial omics technologies, along with support in experimental design and bioinformatics.

Spatial Omics Market Report Scope:

Report Attributes Details
Market Size in 2023 USD 451.76 Million
Market Size by 2032 USD 1,308.88 Million
CAGR CAGR of 12.55% From 2024 to 2032
Base Year 2023
Forecast Period 2024-2032
Historical Data 2020-2022
Report Scope & Coverage Market Size, Segments Analysis, Competitive  Landscape, Regional Analysis, DROC & SWOT Analysis, Forecast Outlook
Key Segments •By Sample Type (Formalin-Fixed Paraffin-Embedded (FFPE), Fresh Frozen)
•By Technology (Spatial Transcriptomics, Spatial Genomics, Spatial Proteomics)
•By Application (Diagnostics, Translation Research, Cell Biology, Single Cell Analysis, Others)
•By Workflow (Sample Preparation, Instrumental Analysis, Data Analysis)
•By End-use (Academic & Translational Research Institutes, Pharmaceutical & Biotechnology Companies, Contact Research Organizations (CROs), Others)
Regional Analysis/Coverage North America (US, Canada, Mexico), Europe (Eastern Europe [Poland, Romania, Hungary, Turkey, Rest of Eastern Europe] Western Europe] Germany, France, UK, Italy, Spain, Netherlands, Switzerland, Austria, Rest of Western Europe]), Asia Pacific (China, India, Japan, South Korea, Vietnam, Singapore, Australia, Rest of Asia Pacific), Middle East & Africa (Middle East [UAE, Egypt, Saudi Arabia, Qatar, Rest of Middle East], Africa [Nigeria, South Africa, Rest of Africa], Latin America (Brazil, Argentina, Colombia, Rest of Latin America)
Company Profiles 10x Genomics, NanoString Technologies, Inc., Bio-Techne, Ionpath, Inc., Akoya Biosciences, Inc., Dovetail Genomics (Cantata Bio.), Bruker Corporation, Illumina, Inc., RareCyte, Inc., Vizgen, Inc. and other key players

Frequently Asked Questions

Ans: The Spatial Omics Market was valued at USD 451.76 million in 2023 and is projected to reach USD 1,309.23 million by 2032.

Ans: The Spatial Omics Market is growing rapidly due to AI integration, increased funding, and advancements in biotechnology.

Ans: Formalin-Fixed Paraffin-Embedded (FFPE) samples lead the Spatial Omics Market due to their stability and diagnostic relevance.

Ans: Consumables hold the largest share in the Spatial Omics Market, accounting for 45.5% in 2023 due to their critical research role.

Ans: The US dominates the Spatial Omics Market with a market share of around 81% in 2023, led by NIH and biotech firms.

Table of Contents:

1. Introduction

1.1 Market Definition

1.2 Scope (Inclusion and Exclusions)

1.3 Research Assumptions

2. Executive Summary

2.1 Market Overview

2.2 Regional Synopsis

2.3 Competitive Summary

3. Research Methodology

3.1 Top-Down Approach

3.2 Bottom-up Approach

3.3. Data Validation

3.4 Primary Interviews

4. Market Dynamics Impact Analysis

4.1 Market Driving Factors Analysis

4.1.1 Drivers

4.1.2 Restraints

4.1.3 Opportunities

4.1.4 Challenges

4.2 PESTLE Analysis

4.3 Porter’s Five Forces Model

5. Statistical Insights and Trends Reporting

5.1 Investment Trends and Funding Analysis

5.2 Regulatory Frameworks and Compliance Standards

5.3 Customer Value Proposition and Benefits

5.4 Environmental Sustainability and Green Initiatives

5.5 Global Trade Policies and Impacts

6. Competitive Landscape

6.1 List of Major Companies, By Region

6.2 Market Share Analysis, By Region

6.3 Product Benchmarking

6.3.1 Product specifications and features

6.3.2 Pricing

6.4 Strategic Initiatives

6.4.1 Marketing and promotional activities

6.4.2 Distribution and Supply Chain Strategies

6.4.3 Expansion plans and new product launches

6.4.4 Strategic partnerships and collaborations

6.5 Technological Advancements

6.6 Market Positioning and Branding

7. Spatial Omics Market Segmentation, By Product

7.1 Chapter Overview

7.2 Instruments

      7.2.1 Instruments Market Trends Analysis (2020-2032)

      7.2.2 Instruments Market Size Estimates and Forecasts to 2032 (USD Million)

      7.2.3 Sequencing Platforms

      7.2.3.1 Sequencing Platforms Market Trends Analysis (2020-2032)

      7.2.3.2 Sequencing Platforms Market Size Estimates and Forecasts to 2032 (USD Million)

      7.2.4 IHC

      7.2.4.1 IHC Market Trends Analysis (2020-2032)

      7.2.4.2 IHC Market Size Estimates and Forecasts to 2032 (USD Million)

      7.2.5 Microscopy

      7.2.5.1 Microscopy Market Trends Analysis (2020-2032)

      7.2.5.2 Microscopy Market Size Estimates and Forecasts to 2032 (USD Million)

      7.2.6 Flow Cytometry

      7.2.6.1 Flow Cytometry Market Trends Analysis (2020-2032)

      7.2.6.2 Flow Cytometry Market Size Estimates and Forecasts to 2032 (USD Million)

      7.2.7 Mass Spectrometry

      7.2.7.1 Mass Spectrometry Market Trends Analysis (2020-2032)

      7.2.7.2 Mass Spectrometry Market Size Estimates and Forecasts to 2032 (USD Million)

      7.2.8 Others

      7.2.8.1 Others Market Trends Analysis (2020-2032)

      7.2.8.2 Others Market Size Estimates and Forecasts to 2032 (USD Million)

7.3 Consumable

      7.3.1 Consumable Market Trends Analysis (2020-2032)

      7.3.2 Consumable Market Size Estimates and Forecasts to 2032 (USD Million)

7.4 Software

      7.4.1 Software Market Trends Analysis (2020-2032)

      7.4.2 Software Market Size Estimates and Forecasts to 2032 (USD Million)

      7.4.3 Sequencing Platforms

      7.4.3.1 Sequencing Platforms Market Trends Analysis (2020-2032)

      7.4.3.2 Sequencing Platforms Market Size Estimates and Forecasts to 2032 (USD Million)

      7.4.4 IHC

      7.4.4.1 IHC Market Trends Analysis (2020-2032)

      7.4.4.2 IHC Market Size Estimates and Forecasts to 2032 (USD Million)

      7.4.5 Microscopy

      7.4.5.1 Microscopy Market Trends Analysis (2020-2032)

      7.4.5.2 Microscopy Market Size Estimates and Forecasts to 2032 (USD Million)

8. Spatial Omics Market Segmentation, By Sample Type

8.1 Chapter Overview

8.2 Formalin-Fixed Paraffin-Embedded (FFPE)

       8.2.1 Formalin-Fixed Paraffin-Embedded (FFPE) Market Trends Analysis (2020-2032)

       8.2.2 Formalin-Fixed Paraffin-Embedded (FFPE) Market Size Estimates And Forecasts To 2032 (USD Million)

8.3 Fresh Frozen

       8.3.1 Fresh Frozen Market Trends Analysis (2020-2032)

       8.3.2 Fresh Frozen Market Size Estimates And Forecasts To 2032 (USD Million)

9. Spatial Omics Market Segmentation, By Technology

9.1 Chapter Overview

9.2 Spatial Transcriptomics

       9.2.1 Spatial Transcriptomics Market Trends Analysis (2020-2032)

       9.2.2 Spatial Transcriptomics Market Size Estimates And Forecasts To 2032 (USD Million)

9.3 Spatial Genomics

       9.3.1 Spatial Genomics Market Trends Analysis (2020-2032)

       9.3.2 Spatial Genomics Market Size Estimates And Forecasts To 2032 (USD Million)

9.4 Spatial Proteomics

       9.4.1 Spatial Proteomics Market Trends Analysis (2020-2032)

       9.4.2 Spatial Proteomics Market Size Estimates And Forecasts To 2032 (USD Million)

10. Spatial Omics Market Segmentation, By Application

10.1 Chapter Overview

10.2 Diagnostics

       10.2.1 Diagnostics Market Trends Analysis (2020-2032)

       10.2.2 Diagnostics Market Size Estimates And Forecasts To 2032 (USD Million)

10.3 Translation Research

       10.3.1 Translation Research Market Trends Analysis (2020-2032)

       10.3.2 Translation Research Market Size Estimates And Forecasts To 2032 (USD Million)

10.4 Cell Biology

       10.4.1 Cell Biology Market Trends Analysis (2020-2032)

       10.4.2 Cell Biology Market Size Estimates And Forecasts To 2032 (USD Million)

10.5 Single Cell Analysis

       10.5.1 Single Cell Analysis Market Trends Analysis (2020-2032)

       10.5.2 Single Cell Analysis Market Size Estimates And Forecasts To 2032 (USD Million)

10.6 Others

       10.6.1 Others Market Trends Analysis (2020-2032)

       10.6.2 Others Market Size Estimates And Forecasts To 2032 (USD Million)

10.7 Healthcare

       10.7.1 Healthcare Market Trends Analysis (2020-2032)

       10.7.2 Healthcare Market Size Estimates And Forecasts To 2032 (USD Million)

10.8 Others

       10.8.1 Others Market Trends Analysis (2020-2032)

       10.8.2 Others Market Size Estimates And Forecasts To 2032 (USD Million)

11. Spatial Omics Market Segmentation, By Workflow

11.1 Chapter Overview

11.2 Sample Preparation

       11.2.1 Sample Preparation Market Trends Analysis (2020-2032)

       11.2.2 Sample Preparation Market Size Estimates And Forecasts To 2032 (USD Million)

11.3 Instrumental Analysis

       11.3.1 Instrumental Analysis Vehicles Market Trends Analysis (2020-2032)

       11.3.2 Instrumental Analysis Market Size Estimates And Forecasts To 2032 (USD Million)

11.4 Data Analysis

       11.4.1 Data Analysis Vehicles Market Trends Analysis (2020-2032)

       11.4.2 Data Analysis Market Size Estimates And Forecasts To 2032 (USD Million)

12. Spatial Omics Market Estimates And Forecasts, By End-use

12.1 Chapter Overview

12.2 Academic & Translational Research Institutes

       12.2.1 Academic & Translational Research Institutes Market Trends Analysis (2020-2032)

       12.2.2 Academic & Translational Research Institutes Market Size Estimates And Forecasts To 2032 (USD Million)

12.3 Pharmaceutical & Biotechnology Companies

       12.3.1 Pharmaceutical & Biotechnology Companies Market Trends Analysis (2020-2032)

       12.3.2 Pharmaceutical & Biotechnology Companies Market Size Estimates And Forecasts To 2032 (USD Million)

12.4 Contact Research Organizations (CROs)

       12.4.1 Contact Research Organizations (CROs) Market Trends Analysis (2020-2032)

       12.4.2 Contact Research Organizations (CROs) Market Size Estimates And Forecasts To 2032 (USD Million)

12.5 Others

       12.5.1 Others Market Trends Analysis (2020-2032)

       12.5.2 Others Market Size Estimates And Forecasts To 2032 (USD Million)

13. Regional Analysis

13.1 Chapter Overview

13.2 North America

13.2.1 Trends Analysis

13.2.2 North America Spatial Omics Market Estimates And Forecasts, By Country (2020-2032) (USD Million)

13.2.3 North America Spatial Omics Market Estimates And Forecasts, By Product (2020-2032) (USD Million)

13.2.4 North America Spatial Omics Market Estimates And Forecasts, By Sample Type (2020-2032) (USD Million)

13.2.5 North America Spatial Omics Market Estimates And Forecasts, By Technology (2020-2032) (USD Million)

13.2.6 North America Spatial Omics Market Estimates And Forecasts, By Application (2020-2032) (USD Million)

13.2.7 North America Spatial Omics Market Estimates And Forecasts, By Workflow (2020-2032) (USD Million)

13.2.8 North America Spatial Omics Market Estimates And Forecasts, By End-use (2020-2032) (USD Million)

13.2.9 USA

13.2.9.1 USA Spatial Omics Market Estimates And Forecasts, By Product (2020-2032) (USD Million)

13.2.9.2 USA Spatial Omics Market Estimates And Forecasts, By Sample Type (2020-2032) (USD Million)

13.2.9.3 USA Spatial Omics Market Estimates And Forecasts, By Technology (2020-2032) (USD Million)

13.2.9.4 USA Spatial Omics Market Estimates And Forecasts, By Application (2020-2032) (USD Million)

13.2.9.5 USA Spatial Omics Market Estimates And Forecasts, By Workflow (2020-2032) (USD Million)

13.2.9.6 USA Spatial Omics Market Estimates And Forecasts, By End-use (2020-2032) (USD Million)

13.2.10 Canada

13.2.10.1 Canada Spatial Omics Market Estimates And Forecasts, By Product (2020-2032) (USD Million)

13.2.10.2 Canada Spatial Omics Market Estimates And Forecasts, By Sample Type (2020-2032) (USD Million)

13.2.10.3 Canada Spatial Omics Market Estimates And Forecasts, By Technology (2020-2032) (USD Million)

13.2.10.4 Canada Spatial Omics Market Estimates And Forecasts, By Application (2020-2032) (USD Million)

13.2.10.5 Canada Spatial Omics Market Estimates And Forecasts, By Workflow (2020-2032) (USD Million)

13.2.10.6 Canada Spatial Omics Market Estimates And Forecasts, By End-use (2020-2032) (USD Million)

13.2.11 Mexico

13.2.11.1 Mexico Spatial Omics Market Estimates And Forecasts, By Product (2020-2032) (USD Million)

13.2.11.2 Mexico Spatial Omics Market Estimates And Forecasts, By Sample Type (2020-2032) (USD Million)

13.2.11.3 Mexico Spatial Omics Market Estimates And Forecasts, By Technology (2020-2032) (USD Million)

13.2.11.4 Mexico Spatial Omics Market Estimates And Forecasts, By Application (2020-2032) (USD Million)

13.2.11.5 Mexico Spatial Omics Market Estimates And Forecasts, By Workflow (2020-2032) (USD Million)

13.2.11.6 Mexico Spatial Omics Market Estimates And Forecasts, By End-use (2020-2032) (USD Million)

13.3 Europe

13.3.1 Eastern Europe

13.3.1.1 Trends Analysis

13.3.1.2 Eastern Europe Spatial Omics Market Estimates And Forecasts, By Country (2020-2032) (USD Million)

13.3.1.3 Eastern Europe Spatial Omics Market Estimates And Forecasts, By Product (2020-2032) (USD Million)

13.3.1.4 Eastern Europe Spatial Omics Market Estimates And Forecasts, By Sample Type (2020-2032) (USD Million)

13.3.1.5 Eastern Europe Spatial Omics Market Estimates And Forecasts, By Technology (2020-2032) (USD Million)

13.3.1.6 Eastern Europe Spatial Omics Market Estimates And Forecasts, By Application (2020-2032) (USD Million)

13.3.1.7 Eastern Europe Spatial Omics Market Estimates And Forecasts, By Workflow (2020-2032) (USD Million)

13.3.1.8 Eastern Europe Spatial Omics Market Estimates And Forecasts, By End-use (2020-2032) (USD Million)

13.3.1.9 Poland

13.3.1.9.1 Poland Spatial Omics Market Estimates And Forecasts, By Product (2020-2032) (USD Million)

13.3.1.9.2 Poland Spatial Omics Market Estimates And Forecasts, By Sample Type (2020-2032) (USD Million)

13.3.1.9.3 Poland Spatial Omics Market Estimates And Forecasts, By Technology (2020-2032) (USD Million)

13.3.1.9.4 Poland Spatial Omics Market Estimates And Forecasts, By Application (2020-2032) (USD Million)

13.3.1.9.5 Poland Spatial Omics Market Estimates And Forecasts, By Workflow (2020-2032) (USD Million)

13.3.1.9.6 Poland Spatial Omics Market Estimates And Forecasts, By End-use (2020-2032) (USD Million)

13.3.1.10 Romania

13.3.1.10.1 Romania Spatial Omics Market Estimates And Forecasts, By Product (2020-2032) (USD Million)

13.3.1.10.2 Romania Spatial Omics Market Estimates And Forecasts, By Sample Type (2020-2032) (USD Million)

13.3.1.10.3 Romania Spatial Omics Market Estimates And Forecasts, By Technology (2020-2032) (USD Million)

13.3.1.10.4 Romania Spatial Omics Market Estimates And Forecasts, By Application (2020-2032) (USD Million)

13.3.1.10.5 Romania Spatial Omics Market Estimates And Forecasts, By Workflow (2020-2032) (USD Million)

13.3.1.10.6 Romania Spatial Omics Market Estimates And Forecasts, By End-use (2020-2032) (USD Million)

13.3.1.11 Hungary

13.3.1.11.1 Hungary Spatial Omics Market Estimates And Forecasts, By Product (2020-2032) (USD Million)

13.3.1.11.2 Hungary Spatial Omics Market Estimates And Forecasts, By Sample Type (2020-2032) (USD Million)

13.3.1.11.3 Hungary Spatial Omics Market Estimates And Forecasts, By Technology (2020-2032) (USD Million)

13.3.1.11.4 Hungary Spatial Omics Market Estimates And Forecasts, By Application (2020-2032) (USD Million)

13.3.1.11.5 Hungary Spatial Omics Market Estimates And Forecasts, By Workflow (2020-2032) (USD Million)

13.3.1.11.6 Hungary Spatial Omics Market Estimates And Forecasts, By End-use (2020-2032) (USD Million)

13.3.1.12 Turkey

13.3.1.12.1 Turkey Spatial Omics Market Estimates And Forecasts, By Product (2020-2032) (USD Million)

13.3.1.12.2 Turkey Spatial Omics Market Estimates And Forecasts, By Sample Type (2020-2032) (USD Million)

13.3.1.12.3 Turkey Spatial Omics Market Estimates And Forecasts, By Technology (2020-2032) (USD Million)

13.3.1.12.4 Turkey Spatial Omics Market Estimates And Forecasts, By Application (2020-2032) (USD Million)

13.3.1.12.5 Turkey Spatial Omics Market Estimates And Forecasts, By Workflow (2020-2032) (USD Million)

13.3.1.12.6 Turkey Spatial Omics Market Estimates And Forecasts, By End-use (2020-2032) (USD Million)

13.3.1.13 Rest Of Eastern Europe

13.3.1.13.1 Rest Of Eastern Europe Spatial Omics Market Estimates And Forecasts, By Product (2020-2032) (USD Million)

13.3.1.13.2 Rest Of Eastern Europe Spatial Omics Market Estimates And Forecasts, By Sample Type (2020-2032) (USD Million)

13.3.1.13.3 Rest Of Eastern Europe Spatial Omics Market Estimates And Forecasts, By Technology (2020-2032) (USD Million)

13.3.1.13.4 Rest Of Eastern Europe Spatial Omics Market Estimates And Forecasts, By Application (2020-2032) (USD Million)

13.3.1.13.5 Rest Of Eastern Europe Spatial Omics Market Estimates And Forecasts, By Workflow (2020-2032) (USD Million)

13.3.1.13.6 Rest Of Eastern Europe Spatial Omics Market Estimates And Forecasts, By End-use (2020-2032) (USD Million)

13.3.2 Western Europe

13.3.2.1 Trends Analysis

13.3.2.2 Western Europe Spatial Omics Market Estimates And Forecasts, By Country (2020-2032) (USD Million)

13.3.2.3 Western Europe Spatial Omics Market Estimates And Forecasts, By Product (2020-2032) (USD Million)

13.3.2.4 Western Europe Spatial Omics Market Estimates And Forecasts, By Sample Type (2020-2032) (USD Million)

13.3.2.5 Western Europe Spatial Omics Market Estimates And Forecasts, By Technology (2020-2032) (USD Million)

13.3.2.6 Western Europe Spatial Omics Market Estimates And Forecasts, By Application (2020-2032) (USD Million)

13.3.2.7 Western Europe Spatial Omics Market Estimates And Forecasts, By Workflow (2020-2032) (USD Million)

13.3.2.8 Western Europe Spatial Omics Market Estimates And Forecasts, By End-use (2020-2032) (USD Million)

13.3.2.9 Germany   

13.3.2.9.1 Germany Spatial Omics Market Estimates And Forecasts, By Product (2020-2032) (USD Million)

13.3.2.9.2 Germany Spatial Omics Market Estimates And Forecasts, By Sample Type (2020-2032) (USD Million)

13.3.2.9.3 Germany Spatial Omics Market Estimates And Forecasts, By Technology (2020-2032) (USD Million)

13.3.2.9.4 Germany Spatial Omics Market Estimates And Forecasts, By Application (2020-2032) (USD Million)

13.3.2.9.5 Germany Spatial Omics Market Estimates And Forecasts, By Workflow (2020-2032) (USD Million)

13.3.2.9.6 Germany Spatial Omics Market Estimates And Forecasts, By End-use (2020-2032) (USD Million)

13.3.2.10 France

13.3.2.10.1 France Spatial Omics Market Estimates And Forecasts, By Product (2020-2032) (USD Million)

13.3.2.10.2 France Spatial Omics Market Estimates And Forecasts, By Sample Type (2020-2032) (USD Million)

13.3.2.10.3 France Spatial Omics Market Estimates And Forecasts, By Technology (2020-2032) (USD Million)

13.3.2.10.4 France Spatial Omics Market Estimates And Forecasts, By Application (2020-2032) (USD Million)

13.3.2.10.5 France Spatial Omics Market Estimates And Forecasts, By Workflow (2020-2032) (USD Million)

13.3.2.10.6 France Spatial Omics Market Estimates And Forecasts, By End-use (2020-2032) (USD Million)

13.3.2.11 UK

13.3.2.11.1 UK Spatial Omics Market Estimates And Forecasts, By Product (2020-2032) (USD Million)

13.3.2.11.2 UK Spatial Omics Market Estimates And Forecasts, By Sample Type (2020-2032) (USD Million)

13.3.2.11.3 UK Spatial Omics Market Estimates And Forecasts, By Technology (2020-2032) (USD Million)

13.3.2.11.4 UK Spatial Omics Market Estimates And Forecasts, By Application (2020-2032) (USD Million)

13.3.2.11.5 UK Spatial Omics Market Estimates And Forecasts, By Workflow (2020-2032) (USD Million)

13.3.2.11.6 UK Spatial Omics Market Estimates And Forecasts, By End-use (2020-2032) (USD Million)

13.3.2.12 Italy

13.3.2.12.1 Italy Spatial Omics Market Estimates And Forecasts, By Product (2020-2032) (USD Million)

13.3.2.12.2 Italy Spatial Omics Market Estimates And Forecasts, By Sample Type (2020-2032) (USD Million)

13.3.2.12.3 Italy Spatial Omics Market Estimates And Forecasts, By Technology (2020-2032) (USD Million)

13.3.2.12.4 Italy Spatial Omics Market Estimates And Forecasts, By Application (2020-2032) (USD Million)

13.3.2.12.5 Italy Spatial Omics Market Estimates And Forecasts, By Workflow (2020-2032) (USD Million)

13.3.2.12.6 Italy Spatial Omics Market Estimates And Forecasts, By End-use (2020-2032) (USD Million)

13.3.2.13 Spain

13.3.2.13.1 Spain Spatial Omics Market Estimates And Forecasts, By Product (2020-2032) (USD Million)

13.3.2.13.2 Spain Spatial Omics Market Estimates And Forecasts, By Sample Type (2020-2032) (USD Million)

13.3.2.13.3 Spain Spatial Omics Market Estimates And Forecasts, By Technology (2020-2032) (USD Million)

13.3.2.13.4 Spain Spatial Omics Market Estimates And Forecasts, By Application (2020-2032) (USD Million)

13.3.2.13.5 Spain Spatial Omics Market Estimates and Forecasts, By Workflow (2020-2032) (USD -13824)

13.3.2.13.6 Spain Spatial Omics Market Estimates And Forecasts, By End-use (2020-2032) (USD Million)

13.3.2.14 Netherlands

13.3.2.14.1 Netherlands Spatial Omics Market Estimates and Forecasts, By Product (2020-2032) (USD Million)

13.3.2.14.2 Netherlands Spatial Omics Market Estimates And Forecasts, By Sample Type (2020-2032) (USD Million)

13.3.2.14.3 Netherlands Spatial Omics Market Estimates And Forecasts, By Technology (2020-2032) (USD Million)

13.3.2.14.4 Netherlands Spatial Omics Market Estimates And Forecasts, By Application (2020-2032) (USD Million)

13.3.2.14.5 Netherlands Spatial Omics Market Estimates And Forecasts, By Workflow (2020-2032) (USD Million)

13.3.2.14.6 Netherlands Spatial Omics Market Estimates And Forecasts, By End-use (2020-2032) (USD Million)

13.3.2.15 Switzerland

13.3.2.15.1 Switzerland Spatial Omics Market Estimates And Forecasts, By Product (2020-2032) (USD Million)

13.3.2.15.2 Switzerland Spatial Omics Market Estimates And Forecasts, By Sample Type (2020-2032) (USD Million)

13.3.2.15.3 Switzerland Spatial Omics Market Estimates And Forecasts, By Technology (2020-2032) (USD Million)

13.3.2.15.4 Switzerland Spatial Omics Market Estimates And Forecasts, By Application (2020-2032) (USD Million)

13.3.2.15.5 Switzerland Spatial Omics Market Estimates And Forecasts, By Workflow (2020-2032) (USD Million)

13.3.2.15.6 Switzerland Spatial Omics Market Estimates And Forecasts, By End-use (2020-2032) (USD Million)

13.3.2.16 Austria

13.3.2.16.1 Austria Spatial Omics Market Estimates And Forecasts, By Product (2020-2032) (USD Million)

13.3.2.16.2 Austria Spatial Omics Market Estimates And Forecasts, By Sample Type (2020-2032) (USD Million)

13.3.2.16.3 Austria Spatial Omics Market Estimates And Forecasts, By Technology (2020-2032) (USD Million)

13.3.2.16.4 Austria Spatial Omics Market Estimates And Forecasts, By Application (2020-2032) (USD Million)

13.3.2.16.5 Austria Spatial Omics Market Estimates And Forecasts, By Workflow (2020-2032) (USD Million)

13.3.2.16.6 Austria Spatial Omics Market Estimates And Forecasts, By End-use (2020-2032) (USD Million)

13.3.2.17 Rest Of Western Europe

13.3.2.17.1 Rest Of Western Europe Spatial Omics Market Estimates And Forecasts, By Product (2020-2032) (USD Million)

13.3.2.17.2 Rest Of Western Europe Spatial Omics Market Estimates And Forecasts, By Sample Type (2020-2032) (USD Million)

13.3.2.17.3 Rest Of Western Europe Spatial Omics Market Estimates And Forecasts, By Technology (2020-2032) (USD Million)

13.3.2.17.4 Rest Of Western Europe Spatial Omics Market Estimates And Forecasts, By Application (2020-2032) (USD Million)

13.3.2.17.5 Rest Of Western Europe Spatial Omics Market Estimates And Forecasts, By Workflow (2020-2032) (USD Million)

13.3.2.17.6 Rest Of Western Europe Spatial Omics Market Estimates And Forecasts, By End-use (2020-2032) (USD Million)

13.4 Asia Pacific

                              13.4.1 Trends Analysis

13.4.2 Asia Pacific Spatial Omics Market Estimates And Forecasts, By Country (2020-2032) (USD Million)

13.4.3 Asia Pacific Spatial Omics Market Estimates And Forecasts, By Product (2020-2032) (USD Million)

13.4.4 Asia Pacific Spatial Omics Market Estimates And Forecasts, By Sample Type (2020-2032) (USD Million)

13.4.5 Asia Pacific Spatial Omics Market Estimates And Forecasts, By Technology (2020-2032) (USD Million)

13.4.6 Asia Pacific Spatial Omics Market Estimates And Forecasts, By Application (2020-2032) (USD Million)

13.4.7 Asia Pacific Spatial Omics Market Estimates And Forecasts, By Workflow (2020-2032) (USD Million)

13.4.8 Asia Pacific Spatial Omics Market Estimates And Forecasts, By End-use (2020-2032) (USD Million)

13.4.9 China

13.4.9.1 China Spatial Omics Market Estimates And Forecasts, By Product (2020-2032) (USD Million)

13.4.9.2 China Spatial Omics Market Estimates And Forecasts, By Sample Type (2020-2032) (USD Million)

13.4.9.3 China Spatial Omics Market Estimates And Forecasts, By Technology (2020-2032) (USD Million)

13.4.9.4 China Spatial Omics Market Estimates And Forecasts, By Application (2020-2032) (USD Million)

13.4.9.5 China Spatial Omics Market Estimates And Forecasts, By Workflow (2020-2032) (USD Million)

13.4.9.6 China Spatial Omics Market Estimates And Forecasts, By End-use (2020-2032) (USD Million)

13.4.10 India

13.4.10.1 India Spatial Omics Market Estimates And Forecasts, By Product (2020-2032) (USD Million)

13.4.10.2 India Spatial Omics Market Estimates And Forecasts, By Sample Type (2020-2032) (USD Million)

13.4.10.3 India Spatial Omics Market Estimates And Forecasts, By Technology (2020-2032) (USD Million)

13.4.10.4 India Spatial Omics Market Estimates And Forecasts, By Application (2020-2032) (USD Million)

13.4.10.5 India Spatial Omics Market Estimates And Forecasts, By Workflow (2020-2032) (USD Million)

13.4.10.6 India Spatial Omics Market Estimates And Forecasts, By End-use (2020-2032) (USD Million)

13.4.11 Japan

13.4.11.1 Japan Spatial Omics Market Estimates And Forecasts, By Product (2020-2032) (USD Million)

13.4.11.2 Japan Spatial Omics Market Estimates And Forecasts, By Sample Type (2020-2032) (USD Million)

13.4.11.3 Japan Spatial Omics Market Estimates And Forecasts, By Technology (2020-2032) (USD Million)

13.4.11.4 Japan Spatial Omics Market Estimates And Forecasts, By Application (2020-2032) (USD Million)

13.4.11.5 Japan Spatial Omics Market Estimates And Forecasts, By Workflow (2020-2032) (USD Million)

13.4.11.6 Japan Spatial Omics Market Estimates And Forecasts, By End-use (2020-2032) (USD Million)

13.4.12 South Korea

13.4.12.1 South Korea Spatial Omics Market Estimates And Forecasts, By Product (2020-2032) (USD Million)

13.4.12.2 South Korea Spatial Omics Market Estimates And Forecasts, By Sample Type (2020-2032) (USD Million)

13.4.12.3 South Korea Spatial Omics Market Estimates And Forecasts, By Technology (2020-2032) (USD Million)

13.4.12.4 South Korea Spatial Omics Market Estimates And Forecasts, By Application (2020-2032) (USD Million)

13.4.12.5 South Korea Spatial Omics Market Estimates And Forecasts, By Workflow (2020-2032) (USD Million)

13.4.12.6 South Korea Spatial Omics Market Estimates And Forecasts, By End-use (2020-2032) (USD Million)

13.4.13 Vietnam

13.4.13.1 Vietnam Spatial Omics Market Estimates And Forecasts, By Product (2020-2032) (USD Million)

13.4.13.2 Vietnam Spatial Omics Market Estimates And Forecasts, By Sample Type (2020-2032) (USD Million)

13.4.13.3 Vietnam Spatial Omics Market Estimates And Forecasts, By Technology (2020-2032) (USD Million)

13.4.13.4 Vietnam Spatial Omics Market Estimates And Forecasts, By Application (2020-2032) (USD Million)

13.4.13.5 Vietnam Spatial Omics Market Estimates And Forecasts, By Workflow (2020-2032) (USD Million)

13.4.13.6 Vietnam Spatial Omics Market Estimates And Forecasts, By End-use (2020-2032) (USD Million)

13.4.14 Singapore

13.4.14.1 Singapore Spatial Omics Market Estimates And Forecasts, By Product (2020-2032) (USD Million)

13.4.14.2 Singapore Spatial Omics Market Estimates And Forecasts, By Sample Type (2020-2032) (USD Million)

13.4.14.3 Singapore Spatial Omics Market Estimates And Forecasts, By Technology (2020-2032) (USD Million)

13.4.14.4 Singapore Spatial Omics Market Estimates And Forecasts, By Application (2020-2032) (USD Million)

13.4.14.5 Singapore Spatial Omics Market Estimates And Forecasts, By Workflow (2020-2032) (USD Million)

13.4.14.6 Singapore Spatial Omics Market Estimates And Forecasts, By End-use (2020-2032) (USD Million)

13.4.15 Australia

13.4.15.1 Australia Spatial Omics Market Estimates And Forecasts, By Product (2020-2032) (USD Million)

13.4.15.2 Australia Spatial Omics Market Estimates And Forecasts, By Sample Type (2020-2032) (USD Million)

13.4.15.3 Australia Spatial Omics Market Estimates And Forecasts, By Technology (2020-2032) (USD Million)

13.4.15.4 Australia Spatial Omics Market Estimates And Forecasts, By Application (2020-2032) (USD Million)

13.4.15.5 Australia Spatial Omics Market Estimates And Forecasts, By Workflow (2020-2032) (USD Million)

13.4.15.6 Australia Spatial Omics Market Estimates And Forecasts, By End-use (2020-2032) (USD Million)

13.4.16 Rest Of Asia Pacific

13.4.16.1 Rest Of Asia Pacific Spatial Omics Market Estimates And Forecasts, By Product (2020-2032) (USD Million)

13.4.16.2 Rest Of Asia Pacific Spatial Omics Market Estimates And Forecasts, By Sample Type (2020-2032) (USD Million)

13.4.16.3 Rest Of Asia Pacific Spatial Omics Market Estimates And Forecasts, By Technology (2020-2032) (USD Million)

13.4.16.4 Rest Of Asia Pacific Spatial Omics Market Estimates And Forecasts, By Application (2020-2032) (USD Million)

13.4.16.5 Rest Of Asia Pacific Spatial Omics Market Estimates And Forecasts, By Workflow (2020-2032) (USD Million)

13.4.16.6 Rest Of Asia Pacific Spatial Omics Market Estimates And Forecasts, By End-use (2020-2032) (USD Million)

13.5 Middle East And Africa

13.5.1 Middle East

                                 13.5.1.1 Trends Analysis

13.5.1.2 Middle East Spatial Omics Market Estimates And Forecasts, By Country (2020-2032) (USD Million)

13.5.1.3 Middle East Spatial Omics Market Estimates And Forecasts, By Product (2020-2032) (USD Million)

13.5.1.4 Middle East Spatial Omics Market Estimates And Forecasts, By Sample Type (2020-2032) (USD Million)

13.5.1.5 Middle East Spatial Omics Market Estimates And Forecasts, By Technology (2020-2032) (USD Million)

13.5.1.6 Middle East Spatial Omics Market Estimates And Forecasts, By Application (2020-2032) (USD Million)

13.5.1.7 Middle East Spatial Omics Market Estimates And Forecasts, By Workflow (2020-2032) (USD Million)

13.5.1.8 Middle East Spatial Omics Market Estimates And Forecasts, By End-use (2020-2032) (USD Million)

13.5.1.9 UAE

13.5.1.9.1 UAE Spatial Omics Market Estimates And Forecasts, By Product (2020-2032) (USD Million)

13.5.1.9.2 UAE Spatial Omics Market Estimates And Forecasts, By Sample Type (2020-2032) (USD Million)

13.5.1.9.3 UAE Spatial Omics Market Estimates And Forecasts, By Technology (2020-2032) (USD Million)

13.5.1.9.4 UAE Spatial Omics Market Estimates And Forecasts, By Application (2020-2032) (USD Million)

13.5.1.9.5 UAE Spatial Omics Market Estimates And Forecasts, By Workflow (2020-2032) (USD Million)

13.5.1.9.6 UAE Spatial Omics Market Estimates And Forecasts, By End-use (2020-2032) (USD Million)

13.5.1.10 Egypt

13.5.1.10.1 Egypt Spatial Omics Market Estimates And Forecasts, By Product (2020-2032) (USD Million)

13.5.1.10.2 Egypt Spatial Omics Market Estimates And Forecasts, By Sample Type (2020-2032) (USD Million)

13.5.1.10.3 Egypt Spatial Omics Market Estimates And Forecasts, By Technology (2020-2032) (USD Million)

13.5.1.10.4 Egypt Spatial Omics Market Estimates And Forecasts, By Application (2020-2032) (USD Million)

13.5.1.10.5 Egypt Spatial Omics Market Estimates And Forecasts, By Workflow (2020-2032) (USD Million)

13.5.1.10.6 Egypt Spatial Omics Market Estimates And Forecasts, By End-use (2020-2032) (USD Million)

13.5.1.11 Saudi Arabia

13.5.1.10.1 Saudi Arabia Spatial Omics Market Estimates And Forecasts, By Product (2020-2032) (USD Million)

13.5.1.11.2 Saudi Arabia Spatial Omics Market Estimates And Forecasts, By Sample Type (2020-2032) (USD Million)

13.5.1.11.3 Saudi Arabia Spatial Omics Market Estimates And Forecasts, By Technology (2020-2032) (USD Million)

13.5.1.11.4 Saudi Arabia Spatial Omics Market Estimates And Forecasts, By Application (2020-2032) (USD Million)

13.5.1.11.5 Saudi Arabia Spatial Omics Market Estimates And Forecasts, By Workflow (2020-2032) (USD Million)

13.5.1.11.6 Saudi Arabia Spatial Omics Market Estimates And Forecasts, By End-use (2020-2032) (USD Million)

13.5.1.12 Qatar

13.5.1.12.1 Qatar Spatial Omics Market Estimates And Forecasts, By Product (2020-2032) (USD Million)

13.5.1.12.2 Qatar Spatial Omics Market Estimates And Forecasts, By Sample Type (2020-2032) (USD Million)

13.5.1.12.3 Qatar Spatial Omics Market Estimates And Forecasts, By Technology (2020-2032) (USD Million)

13.5.1.12.4 Qatar Spatial Omics Market Estimates And Forecasts, By Application (2020-2032) (USD Million)

13.5.1.12.5 Qatar Spatial Omics Market Estimates And Forecasts, By Workflow (2020-2032) (USD Million)

13.5.1.12.6 Qatar Spatial Omics Market Estimates And Forecasts, By End-use (2020-2032) (USD Million)

13.5.1.13 Rest Of Middle East

13.5.1.13.1 Rest Of Middle East Spatial Omics Market Estimates And Forecasts, By Product (2020-2032) (USD Million)

13.5.1.13.2 Rest Of Middle East Spatial Omics Market Estimates And Forecasts, By Sample Type (2020-2032) (USD Million)

13.5.1.13.3 Rest Of Middle East Spatial Omics Market Estimates And Forecasts, By Technology (2020-2032) (USD Million)

13.5.1.13.4 Rest Of Middle East Spatial Omics Market Estimates And Forecasts, By Application (2020-2032) (USD Million)

13.5.1.13.5 Rest Of Middle East Spatial Omics Market Estimates And Forecasts, By Workflow (2020-2032) (USD Million)

13.5.1.13.6 Rest Of Middle East Spatial Omics Market Estimates And Forecasts, By End-use (2020-2032) (USD Million)

13.5.2 Africa

13.5.2.1 Trends Analysis

13.5.2.2 Africa Spatial Omics Market Estimates And Forecasts, By Country (2020-2032) (USD Million)

13.5.2.3 Africa Spatial Omics Market Estimates And Forecasts, By Product (2020-2032) (USD Million)

13.5.2.4 Africa Spatial Omics Market Estimates And Forecasts, By Sample Type (2020-2032) (USD Million)

13.5.2.5 Africa Spatial Omics Market Estimates And Forecasts, By Technology (2020-2032) (USD Million)

13.5.2.6 Africa Spatial Omics Market Estimates And Forecasts, By Application (2020-2032) (USD Million)

13.5.2.7 Africa Spatial Omics Market Estimates And Forecasts, By Workflow (2020-2032) (USD Million)

13.5.2.8 Africa Spatial Omics Market Estimates And Forecasts, By End-use (2020-2032) (USD Million)

13.5.2.9 South Africa

13.5.2.9.1 South Africa Spatial Omics Market Estimates And Forecasts, By Product (2020-2032) (USD Million)

13.5.2.9.2 South Africa Spatial Omics Market Estimates And Forecasts, By Sample Type (2020-2032) (USD Million)

13.5.2.9.3 South Africa Spatial Omics Market Estimates And Forecasts, By Technology (2020-2032) (USD Million)

13.5.2.9.4 South Africa Spatial Omics Market Estimates And Forecasts, By Application (2020-2032) (USD Million)

13.5.2.9.5 South Africa Spatial Omics Market Estimates And Forecasts, By Workflow (2020-2032) (USD Million)

13.5.2.9.6 South Africa Spatial Omics Market Estimates And Forecasts, By End-use (2020-2032) (USD Million)

13.5.2.10 Nigeria

13.5.2.10.1 Nigeria Spatial Omics Market Estimates And Forecasts, By Product (2020-2032) (USD Million)

13.5.2.10.2 Nigeria Spatial Omics Market Estimates And Forecasts, By Sample Type (2020-2032) (USD Million)

13.5.2.10.3 Nigeria Spatial Omics Market Estimates And Forecasts, By Technology (2020-2032) (USD Million)

13.5.2.10.4 Nigeria Spatial Omics Market Estimates And Forecasts, By Application (2020-2032) (USD Million)

13.5.2.10.5 Nigeria Spatial Omics Market Estimates And Forecasts, By Workflow (2020-2032) (USD Million)

13.5.2.10.6 Nigeria Spatial Omics Market Estimates And Forecasts, By End-use (2020-2032) (USD Million)

13.5.2.11 Rest Of Africa

13.5.2.11.1 Rest Of Africa Spatial Omics Market Estimates And Forecasts, By Product (2020-2032) (USD Million)

13.5.2.11.2 Rest Of Africa Spatial Omics Market Estimates And Forecasts, By Sample Type (2020-2032) (USD Million)

13.5.2.11.3 Rest Of Africa Spatial Omics Market Estimates And Forecasts, By Technology (2020-2032) (USD Million)

13.5.2.11.4 Rest Of Africa Spatial Omics Market Estimates And Forecasts, By Application (2020-2032) (USD Million)

13.5.2.11.5 Rest Of Africa Spatial Omics Market Estimates And Forecasts, By Workflow (2020-2032) (USD Million)

13.5.2.11.6 Rest Of Africa Spatial Omics Market Estimates And Forecasts, By End-use (2020-2032) (USD Million)

13.6 Latin America

13.6.1 Trends Analysis

13.6.2 Latin America Spatial Omics Market Estimates And Forecasts, By Country (2020-2032) (USD Million)

13.6.3 Latin America Spatial Omics Market Estimates And Forecasts, By Product (2020-2032) (USD Million)

13.6.4 Latin America Spatial Omics Market Estimates And Forecasts, By Sample Type (2020-2032) (USD Million)

13.6.5 Latin America Spatial Omics Market Estimates And Forecasts, By Technology (2020-2032) (USD Million)

13.6.6 Latin America Spatial Omics Market Estimates And Forecasts, By Application (2020-2032) (USD Million)

13.6.7 Latin America Spatial Omics Market Estimates And Forecasts, By Workflow (2020-2032) (USD Million)

13.6.8 Latin America Spatial Omics Market Estimates And Forecasts, By End-use (2020-2032) (USD Million)

13.6.9 Brazil

13.6.9.1 Brazil Spatial Omics Market Estimates And Forecasts, By Product (2020-2032) (USD Million)

13.6.9.2 Brazil Spatial Omics Market Estimates And Forecasts, By Sample Type (2020-2032) (USD Million)

13.6.9.3 Brazil Spatial Omics Market Estimates And Forecasts, By Technology (2020-2032) (USD Million)

13.6.9.4 Brazil Spatial Omics Market Estimates And Forecasts, By Application (2020-2032) (USD Million)

13.6.9.5 Brazil Spatial Omics Market Estimates And Forecasts, By Workflow (2020-2032) (USD Million)

13.6.9.6 Brazil Spatial Omics Market Estimates And Forecasts, By End-use (2020-2032) (USD Million)

13.6.10 Argentina

13.6.10.1 Argentina Spatial Omics Market Estimates And Forecasts, By Product (2020-2032) (USD Million)

13.6.10.2 Argentina Spatial Omics Market Estimates And Forecasts, By Sample Type (2020-2032) (USD Million)

13.6.10.3 Argentina Spatial Omics Market Estimates And Forecasts, By Technology (2020-2032) (USD Million)

13.6.10.4 Argentina Spatial Omics Market Estimates And Forecasts, By Application (2020-2032) (USD Million)

13.6.10.5 Argentina Spatial Omics Market Estimates And Forecasts, By Workflow (2020-2032) (USD Million)

13.6.10.6 Argentina Spatial Omics Market Estimates And Forecasts, By End-use (2020-2032) (USD Million)

13.6.11 Colombia

13.6.11.1 Colombia Spatial Omics Market Estimates And Forecasts, By Product (2020-2032) (USD Million)

13.6.11.2 Colombia Spatial Omics Market Estimates And Forecasts, By Sample Type (2020-2032) (USD Million)

13.6.11.3 Colombia Spatial Omics Market Estimates And Forecasts, By Technology (2020-2032) (USD Million)

13.6.11.4 Colombia Spatial Omics Market Estimates And Forecasts, By Application (2020-2032) (USD Million)

13.6.11.5 Colombia Spatial Omics Market Estimates And Forecasts, By Workflow (2020-2032) (USD Million)

13.6.11.6 Colombia Spatial Omics Market Estimates And Forecasts, By End-use (2020-2032) (USD Million)

13.6.12 Rest of Latin America

13.6.12.1 Rest of Latin America Spatial Omics Market Estimates And Forecasts, By Product (2020-2032) (USD Million)

13.6.12.2 Rest of Latin America Spatial Omics Market Estimates And Forecasts, By Sample Type (2020-2032) (USD Million)

13.6.12.3 Rest of Latin America Spatial Omics Market Estimates And Forecasts, By Technology (2020-2032) (USD Million)

13.6.12.4 Rest of Latin America Spatial Omics Market Estimates And Forecasts, By Application (2020-2032) (USD Million)

13.6.12.5 Rest of Latin America Spatial Omics Market Estimates And Forecasts, By Workflow (2020-2032) (USD Million)

13.6.12.6 Rest of Latin America Spatial Omics Market Estimates And Forecasts, By End-use (2020-2032) (USD Million)

14. Company Profiles

14.1 10x Genomics

14.1.1Company Overview

14.1.2 Financial

14.1.3 Products/ Technology Offered

14.1.4 SWOT Analysis

14.2 NanoString Technologies, Inc.

14.2.1 Company Overview

14.2.2 Financial

14.2.3 Products/ Technology Offered

14.2.4 SWOT Analysis

14.3 Bio-Techne

14.3.1 Company Overview

14.3.2 Financial

14.3.3 Products/ Technology Offered

14.3.4 SWOT Analysis

14.4 Ionpath, Inc.

14.4.1 Company Overview

14.4.2 Financial

14.4.3 Products/ Technology Offered

14.4.4 SWOT Analysis

14.5 Akoya Biosciences, Inc.

14.5.1 Company Overview

14.5.2 Financial

14.5.3 Products/ Technology Offered

14.5.4 SWOT Analysis

14.6 Dovetail Genomics (Cantata Bio.)

14.6.1 Company Overview

14.6.2 Financial

14.6.3 Products/ Technology Offered

14.6.4 SWOT Analysis

14.7 Bruker Corporation

14.7.1 Company Overview

14.7.2 Financial

14.7.3 Products/ Technology Offered

14.7.4 SWOT Analysis

14.8 Illumina, Inc.

14.8.1 Company Overview

14.8.2 Financial

14.8.3 Products/ Technology Offered

14.8.4 SWOT Analysis

14.9 RareCyte, Inc.

14.9.1 Company Overview

14.9.2 Financial

14.9.3 Products/ Technology Offered

14.9.4 SWOT Analysis

14.10 Vizgen, Inc.

14.10.1 Company Overview

14.10.2 Financial

14.10.3 Products/ Technology Offered

14.10.4 SWOT Analysis

15. Use Cases and Best Practices

16. ConclusioN

An accurate research report requires proper strategizing as well as implementation. There are multiple factors involved in the completion of good and accurate research report and selecting the best methodology to compete the research is the toughest part. Since the research reports we provide play a crucial role in any company’s decision-making process, therefore we at SNS Insider always believe that we should choose the best method which gives us results closer to reality. This allows us to reach at a stage wherein we can provide our clients best and accurate investment to output ratio.

Each report that we prepare takes a timeframe of 350-400 business hours for production. Starting from the selection of titles through a couple of in-depth brain storming session to the final QC process before uploading our titles on our website we dedicate around 350 working hours. The titles are selected based on their current market cap and the foreseen CAGR and growth.


The 5 steps process:

Step 1: Secondary Research:

Secondary Research or Desk Research is as the name suggests is a research process wherein, we collect data through the readily available information. In this process we use various paid and unpaid databases which our team has access to and gather data through the same. This includes examining of listed companies’ annual reports, Journals, SEC filling etc. Apart from this our team has access to various associations across the globe across different industries. Lastly, we have exchange relationships with various university as well as individual libraries.

Secondary Research

Step 2: Primary Research

When we talk about primary research, it is a type of study in which the researchers collect relevant data samples directly, rather than relying on previously collected data.  This type of research is focused on gaining content specific facts that can be sued to solve specific problems. Since the collected data is fresh and first hand therefore it makes the study more accurate and genuine.

We at SNS Insider have divided Primary Research into 2 parts.

Part 1 wherein we interview the KOLs of major players as well as the upcoming ones across various geographic regions. This allows us to have their view over the market scenario and acts as an important tool to come closer to the accurate market numbers. As many as 45 paid and unpaid primary interviews are taken from both the demand and supply side of the industry to make sure we land at an accurate judgement and analysis of the market.

This step involves the triangulation of data wherein our team analyses the interview transcripts, online survey responses and observation of on filed participants. The below mentioned chart should give a better understanding of the part 1 of the primary interview.

Primary Research

Part 2: In this part of primary research the data collected via secondary research and the part 1 of the primary research is validated with the interviews from individual consultants and subject matter experts.

Consultants are those set of people who have at least 12 years of experience and expertise within the industry whereas Subject Matter Experts are those with at least 15 years of experience behind their back within the same space. The data with the help of two main processes i.e., FGDs (Focused Group Discussions) and IDs (Individual Discussions). This gives us a 3rd party nonbiased primary view of the market scenario making it a more dependable one while collation of the data pointers.

Step 3: Data Bank Validation

Once all the information is collected via primary and secondary sources, we run that information for data validation. At our intelligence centre our research heads track a lot of information related to the market which includes the quarterly reports, the daily stock prices, and other relevant information. Our data bank server gets updated every fortnight and that is how the information which we collected using our primary and secondary information is revalidated in real time.

Data Bank Validation

Step 4: QA/QC Process

After all the data collection and validation our team does a final level of quality check and quality assurance to get rid of any unwanted or undesired mistakes. This might include but not limited to getting rid of the any typos, duplication of numbers or missing of any important information. The people involved in this process include technical content writers, research heads and graphics people. Once this process is completed the title gets uploader on our platform for our clients to read it.

Step 5: Final QC/QA Process:

This is the last process and comes when the client has ordered the study. In this process a final QA/QC is done before the study is emailed to the client. Since we believe in giving our clients a good experience of our research studies, therefore, to make sure that we do not lack at our end in any way humanly possible we do a final round of quality check and then dispatch the study to the client.

Key Segments:

By Product

  • Instruments

    • Sequencing Platforms

    • IHC

    • Microscopy

    • Flow Cytometry

    • Mass Spectrometry

    • Others

  • Consumable

  • Software

    • Bioinformatics Tools

    • Imaging Tools

    • Storage & Management Databases

By Sample Type

  • Formalin-Fixed Paraffin-Embedded (FFPE)

  • Fresh Frozen

By Technology         

  • Spatial Transcriptomics

  • Spatial Genomics

  • Spatial Proteomics

By Application

  • Diagnostics

  • Translation Research

  • Cell Biology

  • Single Cell Analysis

  • Others

By Workflow

  • Sample Preparation

  • Instrumental Analysis

  • Data Analysis

By End-use

  • Academic & Translational Research Institutes

  • Pharmaceutical & Biotechnology Companies

  • Contact Research Organizations (CROs)

  • Others

Request for Segment Customization as per your Business Requirement: Segment Customization Request

Regional Coverage:

North America

  • US

  • Canada

  • Mexico

Europe

  • Eastern Europe

    • Poland

    • Romania

    • Hungary

    • Turkey

    • Rest of Eastern Europe

  • Western Europe

    • Germany

    • France

    • UK

    • Italy

    • Spain

    • Netherlands

    • Switzerland

    • Austria

    • Rest of Western Europe

Asia Pacific

  • China

  • India

  • Japan

  • South Korea

  • Vietnam

  • Singapore

  • Australia

  • Rest of Asia Pacific

Middle East & Africa

  • Middle East

    • UAE

    • Egypt

    • Saudi Arabia

    • Qatar

    • Rest of Middle East

  • Africa

    • Nigeria

    • South Africa

    • Rest of Africa

Latin America

  • Brazil

  • Argentina

  • Colombia

  • Rest of Latin America

Request for Country Level Research Report: Country Level Customization Request

Available Customization

With the given market data, SNS Insider offers customization as per the company’s specific needs. The following customization options are available for the report:

  • Detailed Volume Analysis

  • Criss-Cross segment analysis (e.g. Product X Application)

  • Competitive Product Benchmarking

  • Geographic Analysis

  • Additional countries in any of the regions

  • Customized Data Representation

  • Detailed analysis and profiling of additional market players


  •            5000 (33% Discount)


  •            8950 (40% Discount)


  •            3050 (23% Discount)

Start a Conversation

Hi! Click one of our member below to chat on Phone