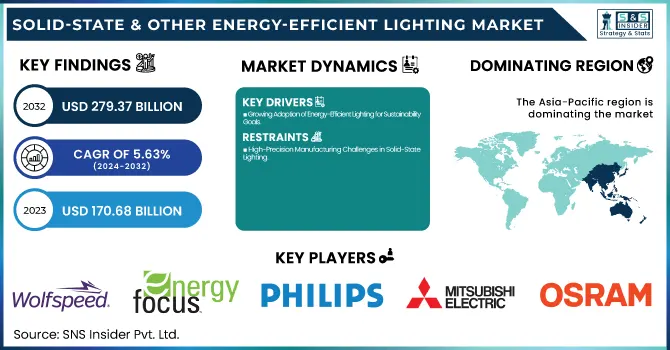
The Solid-State & Other Energy-Efficient Lighting Market size was valued at USD 170.68 Billion in 2023, and expected to reach USD 279.37 Billion by 2032, growing at a CAGR of 5.63% during 2024-2032. Growing adoption and penetration rates in residential, commercial and industrial sectors, backed by regulatory mandates, and the need for cost-effective, long-lasting lighting solutions are driving the market growth. Enhanced energy efficiency and improvement in sustainability metrics are primary criteria, wherein the adoption of solid-state lighting is expected to greatly reduce energy consumption and carbon emissions compared to legacy lighting technologies. Other advantages such as improved product lifecycle or failure rate increased reliability, where current LED solutions offer longer operational life and lower maintenance cost.
To Get more information on Solid-State & Other Energy-Efficient Lighting Market - Request Free Sample Report
Additionally, with the integration of energy-saving lighting in smart grids, and backup power solutions, there is a growing demand for disaster resilience and emergency backup use to improve safety and function in the wake of power outages and natural disasters. As a result of these factors the market is growing, whereby solid-state lighting has become a driving force in the movement towards sustainable and intelligent lighting systems.
Drivers:
Growing Adoption of Energy-Efficient Lighting for Sustainability Goals
With buildings responsible for 37–40% of global energy consumption and CO₂ emissions, the need for sustainable solutions has never been greater. Light pollution is also a great contributor to the advancement of solid-state lighting technologies since governments have been putting policies in place to replace older fixtures with more efficient lighting in order to reduce glare. The increasing focus on eco-friendly, recyclable lighting products among both businesses and consumers is boosting market growth. Smart lighting, when combined with IoT and automation, takes energy optimization a step further with adaptive brightness control and remote monitoring. Corporate sustainability initiatives and green building certifications will also facilitate this shift to solid-state alternatives, providing for long-term savings and environmental benefits. This trend sets solid-state lighting as a major player in global energy efficiency and carbon reduction.
Restraints:
High-Precision Manufacturing Challenges in Solid-State Lighting
The manufacturing of solid-state and energy-efficient lighting technologies involves highly intricate processes that require precision engineering, advanced materials, and specialized equipment. LEDs, OLEDs, and other solid-state lighting solutions rely on semiconductor fabrication techniques, which demand controlled environments and cutting-edge technology to ensure performance and efficiency. The production process includes multiple stages such as epitaxy, wafer processing, phosphor coating, and thermal management, all of which require significant expertise and investment. Additionally, maintaining uniformity in light output, color consistency, and longevity presents technical challenges, as any defects in materials or fabrication can impact overall efficiency. The need for cleanroom environments, automation, and stringent quality control further adds to production costs, making it a barrier for new market entrants.
Opportunities:
Breakthroughs in OLED & Micro LED Technology Driving Lighting Innovation
The rapid advancements in OLED (Organic Light-Emitting Diode) and MicroLED technologies are revolutionizing the solid-state lighting industry by offering superior efficiency, durability, and design flexibility. OLED lighting provides uniform illumination, ultra-thin form factors, and flexibility, making it ideal for architectural, automotive, and display applications. Meanwhile, MicroLED technology boasts higher brightness, lower power consumption, and longer lifespan compared to traditional LEDs, positioning it as a game-changer in high-performance lighting and next-generation display panels. These technologies enable seamless integration with smart lighting systems, enhancing energy management and sustainability. As R&D efforts continue, cost reductions and mass production improvements will further accelerate their adoption, expanding their role in diverse industries, from wearable devices to automotive lighting and large-scale commercial displays.
Challenges:
Effective Thermal Management for High-Power Lighting Efficiency
LEDs and MicroLEDs are high-power solid-state lighting solutions that produce a lot of heat during operation, leading to performance degradation, shortened lifetimes, and lowered efficiency. Dissipation of heat to ensure that they function optimally requires effective thermal management. To tackle this challenge, they are developing new heat sink materials, active cooling systems, and novel thermal interface materials (TIMs). Smart lighting designs also utilize heat spreaders and specialized circuit layouts to improve heat dissipation. Poor thermal regulation can lead to color shifts, reduced luminous output, and premature failure, making it a critical challenge for manufacturers. As lighting applications expand into high-intensity and industrial settings, optimizing thermal solutions remains a key focus to ensure longevity and energy efficiency.
By Technology
The Solid-State Lighting (SSL) segment held the largest market share, accounting for 46% of total revenue in 2023, and is projected to be the fastest-growing segment throughout the forecast period from 2024 to 2032. This growth is driven by the rapid adoption of LED, OLED, and MicroLED by users as they consume less energy, have a higher lifespan, reduced maintenance costs compared to conventional lighting solutions. The pressure from government regulations to deselect inefficient lighting and increasing demand for smart and connected lighting systems complements this. Moreover, Smart Lighting as a Service (SLaaS) solution helps incorporate SSL with IoT-based automation along with adaptive lighting controls, further driving efficiency and sustainability, making SSL the dominant and fastest-growing segment of the energy-efficient lighting market.
By Installation
The New Installation segment held the largest market share in Solid-State & Other Energy-Efficient Lighting Market, accounting for approximately 54% of total revenue in 2023. This dominance is driven by the increasing demand for energy-efficient lighting solutions in new commercial, industrial, and residential construction projects. Governments worldwide are implementing strict energy regulations, promoting the adoption of LED, OLED, and other solid-state lighting technologies in newly built infrastructure. Additionally, rapid urbanization, expansion of smart cities, and the rising focus on sustainable building solutions are fueling market growth. Businesses and developers are prioritizing advanced, long-lasting, and cost-effective lighting systems, further solidifying the New Installation segment as the leading and fastest-growing category within the energy-efficient lighting market.
The Retrofit Installation segment is projected to be the fastest-growing category in the Solid-State & Other Energy-Efficient Lighting Market over the forecast period 2024-2032. The growth can be attributed to the growing replacement of traditional lighting with energy-efficient lighting solutions in commercial, industrial, and residential spaces. Adoption of LEDs, OLEDs and smart lighting systems in existing infrastructure is being accelerated by government incentives, enforcement of strict energy efficiency mandates and rising awareness of the benefits of sustainability. Moreover, businesses and homeowners are working with providers to reduce long-term energy costs and gain greater environmental compliance through a variety of retrofitting projects that are the primary segment driving the growth of the market in the forecast period.
By Application
The Oil and Gas segment dominated the Solid-State & Other Energy-Efficient Lighting Market, accounting for approximately 59% of total revenue in 2023. This dominance is driven by the industry's high demand for durable, energy-efficient lighting solutions in hazardous and remote environments. LEDs, OLEDs, and explosion-proof lighting systems are widely adopted to enhance worker safety, operational efficiency, and energy conservation in offshore platforms, refineries, and drilling sites. Additionally, stringent government regulations on energy efficiency and carbon emissions are pushing oil and gas companies to transition toward sustainable lighting solutions. The sector's focus on reducing operational costs and minimizing environmental impact further fuels the demand for solid-state and energy-efficient lighting technologies, solidifying its market leadership.
The Chemical and Mining segment is the fastest-growing sector in the Solid-State & Other Energy-Efficient Lighting Market during the forecast period 2024-2032. This rapid growth is fueled by the increasing adoption of energy-efficient, explosion-proof, and durable lighting solutions in hazardous industrial environments. LEDs, OLEDs, and advanced solid-state lighting technologies are being integrated into chemical plants, processing units, and mining sites to enhance worker safety, operational efficiency, and cost savings. Stricter regulatory standards for workplace safety and energy consumption further drive the shift toward long-lasting, high-performance lighting. Additionally, advancements in smart lighting and automation allow for remote monitoring and adaptive brightness control, making them ideal for harsh and high-risk industrial settings.
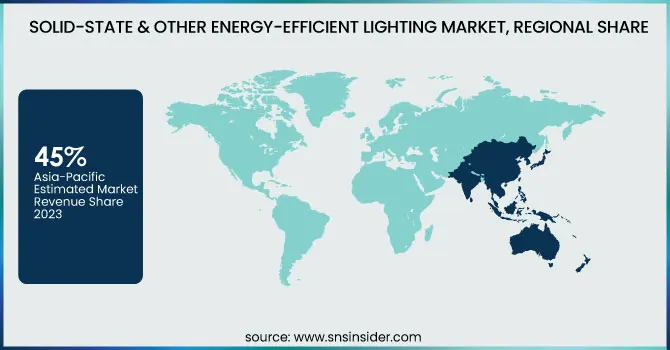
The Asia-Pacific region dominated the Solid-State & Other Energy-Efficient Lighting Market, accounting for approximately 45% of the revenue share in 2023. This involves fast-paced urbanization, industrial growth, and government support for energy-efficient lighting solutions in countries including China, India, Japan, and South Korea. The booming construction industry, growing number of infrastructure development projects, and increasing penetration of smart city implementations are showing exponential demand for LEDs, OLEDs, and other solid-state lighting technologies in the region. Moreover, government policies promoting energy conservation, incentives for LED adoption and restrictions on inefficient lighting solutions also fuel market growth. In upcoming years, Asia-Pacific will dominate Imperial LED Main Panel Market due to technological development, increasing consumer awareness, and decreasing LED prices.
The Europe region is the fastest-growing market in the Solid-State & Other Energy-Efficient Lighting Market over the forecast period from 2024 to 2032, driven by stringent energy efficiency regulations, government incentives, and the rapid adoption of smart lighting solutions. The European Union’s initiatives to phase out traditional incandescent bulbs and promote LED and OLED technologies have significantly boosted market demand. Additionally, the rise of smart cities, increasing investments in sustainable infrastructure, and a strong emphasis on reducing carbon emissions are fueling growth. Countries like Germany, France, and the UK are at the forefront of adopting advanced lighting solutions in both residential and industrial sectors. With continuous technological advancements and policy-driven energy transitions, Europe is set to experience robust market expansion.
Get Customized Report as per Your Business Requirement - Enquiry Now
Some of the major Players in Solid-State & Other Energy-Efficient Lighting Market along with their product:
Wolfspeed Inc. (USA, Semiconductor & LED Solutions)
Energy Focus Inc. (USA, Energy-Efficient Lighting)
GE Lighting (USA, LED & Smart Lighting)
Koninklijke Philips N.V. (Netherlands, LED & Smart Lighting)
Mitsubishi Electric Corporation (Japan, Industrial & Commercial Lighting)
Osram Licht AG (Germany, Automotive & Specialty Lighting)
Samsung Electronics Co. Ltd. (South Korea, LED & Display Solutions)
Seoul Semiconductor Co. Ltd. (South Korea, LED Components & Modules)
Sharp Corporation (Japan, LED & Display Technology)
Toshiba Corporation (Japan, Industrial & Smart Lighting)
List of Suppliers Companies that supply raw materials and components for the lighting industry:
Plansee Group (Austria)
Nichia Corporation (Japan)
Supreme Components International (Singapore)
G.W.P. AG (Germany)
EURO METRICS (Europe)
Epistar Corporation (Taiwan)
Cree Inc. (USA)
Osram Licht AG (Germany)
Seoul Semiconductor (South Korea)
On November 27, 2024, researchers from Chiba University achieved a breakthrough in optical cooling – They demonstrated that perovskite quantum dots embedded in a crystal lattice could reach temperatures 10 K below room temperature using anti-Stokes photoluminescence. This pioneering approach could revolutionize energy-efficient cooling technologies, though challenges remain in achieving near 100% emission efficiency and maintaining quantum dot stability under exposure to air.
On March 5, 2025, Toshiba announced TLP5814H, a gatedriver photocoupler with SiC MOSFET compatible high safety functionality. Integrated active Miller clamp circuit enables system size reduction and higher reliability for use in high-voltage industrial designs.
On April 2, 2024, GE celebrates the launch of GE Aerospace and GE Vernova as standalone companies. This opens a new chapter of not just invention but world changing invention in aviation, energy, and health care the legacy of GE.
| Report Attributes | Details |
|---|---|
| Market Size in 2023 | USD 170.68 Billion |
| Market Size by 2032 | USD 279.37 Billion |
| CAGR | CAGR of 5.63% From 2024 to 2032 |
| Base Year | 2023 |
| Forecast Period | 2024-2032 |
| Historical Data | 2020-2022 |
| Report Scope & Coverage | Market Size, Segments Analysis, Competitive Landscape, Regional Analysis, DROC & SWOT Analysis, Forecast Outlook |
| Key Segments | • By Technology (HID Lighting, Plasma, Induction Lighting, Solid-State Lighting, Fluorescent Lighting) • By Installation (New Installation, Retrofit Installation) • By Application (Oil and Gas, Chemical, Mining) |
| Regional Analysis/Coverage | North America (US, Canada, Mexico), Europe (Eastern Europe [Poland, Romania, Hungary, Turkey, Rest of Eastern Europe] Western Europe] Germany, France, UK, Italy, Spain, Netherlands, Switzerland, Austria, Rest of Western Europe]), Asia Pacific (China, India, Japan, South Korea, Vietnam, Singapore, Australia, Rest of Asia Pacific), Middle East & Africa (Middle East [UAE, Egypt, Saudi Arabia, Qatar, Rest of Middle East], Africa [Nigeria, South Africa, Rest of Africa], Latin America (Brazil, Argentina, Colombia, Rest of Latin America) |
| Company Profiles | Wolfspeed Inc. (USA), Energy Focus Inc. (USA), GE Lighting (USA), Koninklijke Philips N.V. (Netherlands), Mitsubishi Electric Corporation (Japan), Osram Licht AG (Germany), Samsung Electronics Co. Ltd. (South Korea), Seoul Semiconductor Co. Ltd. (South Korea), Sharp Corporation (Japan), Toshiba Corporation (Japan). |
Ans: The Solid-State & Other Energy-Efficient Lighting Market is expected to grow at a CAGR of 5.63 % during 2024-2032.
Ans: The Solid-State & Other Energy-Efficient Lighting Market was USD 170.68 billion in 2023 and is expected to Reach USD 279.37billion by 2032.
Ans: The key drivers of the Solid-State & Other Energy-Efficient Lighting Market include increasing energy efficiency regulations, rising demand for sustainable lighting, advancements in LED and OLED technology, declining component costs, and growing adoption in smart city and industrial applications.
Ans: The “Solid-State Lighting” segment dominated the Solid-State & Other Energy-Efficient Lighting Market.
Ans: Asia-Pacific dominated the Solid-State & Other Energy-Efficient Lighting Market in 2023
1. Introduction
1.1 Market Definition
1.2 Scope (Inclusion and Exclusions)
1.3 Research Assumptions
2. Executive Summary
2.1 Market Overview
2.2 Regional Synopsis
2.3 Competitive Summary
3. Research Methodology
3.1 Top-Down Approach
3.2 Bottom-up Approach
3.3. Data Validation
3.4 Primary Interviews
4. Market Dynamics Impact Analysis
4.1 Market Driving Factors Analysis
4.1.1 Drivers
4.1.2 Restraints
4.1.3 Opportunities
4.1.4 Challenges
4.2 PESTLE Analysis
4.3 Porter’s Five Forces Model
5. Statistical Insights and Trends Reporting
5.1 Adoption & Penetration Rates
5.2 Energy Efficiency & Sustainability Metrics
5.3 Product Lifecycle & Failure Rate
5.4 Disaster Resilience & Emergency Backup Usage
6. Competitive Landscape
6.1 List of Major Companies, By Region
6.2 Market Share Analysis, By Region
6.3 Product Benchmarking
6.3.1 Product specifications and features
6.3.2 Pricing
6.4 Strategic Initiatives
6.4.1 Marketing and promotional activities
6.4.2 Distribution and supply chain strategies
6.4.3 Expansion plans and new product launches
6.4.4 Strategic partnerships and collaborations
6.5 Technological Advancements
6.6 Market Positioning and Branding
7. Solid-State & Other Energy-Efficient Lighting Market Segmentation, by Technology
7.1 Chapter Overview
7.2 Hid Lighting
7.2.1 Hid Lighting Market Trends Analysis (2020-2032)
7.2.2 Hid Lighting Market Size Estimates and Forecasts to 2032 (USD Billion)
7.3 Plasma
7.3.1 Plasma Market Trends Analysis (2020-2032)
7.3.2 Plasma Market Size Estimates and Forecasts to 2032 (USD Billion)
7.4 Induction Lighting
7.4.1 Induction Lighting Market Trends Analysis (2020-2032)
7.4.2 Induction Lighting Market Size Estimates and Forecasts to 2032 (USD Billion)
7.5 Solid-State Lighting
7.5.1 Solid-State Lighting Market Trends Analysis (2020-2032)
7.5.2 Solid-State Lighting Market Size Estimates and Forecasts to 2032 (USD Billion)
7.6 Fluorescent Lighting
7.5.1 Fluorescent Lighting Market Trends Analysis (2020-2032)
7.5.2 Fluorescent Lighting Market Size Estimates and Forecasts to 2032 (USD Billion)
8. Solid-State & Other Energy-Efficient Lighting Market Segmentation, by Installation
8.1 Chapter Overview
8.2 New Installation
8.2.1 New Installation Market Trends Analysis (2020-2032)
8.2.2 New Installation Market Size Estimates and Forecasts to 2032 (USD Billion)
8.3 Retrofit Installation
8.3.1 Retrofit Installation Market Trends Analysis (2020-2032)
8.3.2 Retrofit Installation Market Size Estimates and Forecasts to 2032 (USD Billion)
9. Solid-State & Other Energy-Efficient Lighting Market Segmentation, by Application
9.1 Chapter Overview
9.2 Oil and Gas
9.2.1 Oil and Gas Market Trends Analysis (2020-2032)
9.2.2 Oil and Gas Market Size Estimates and Forecasts to 2032 (USD Billion)
9.3 Chemical, Mining
9.3.1 Chemical, Mining Market Trends Analysis (2020-2032)
9.3.2 Chemical, Mining Market Size Estimates and Forecasts to 2032 (USD Billion)
10. Regional Analysis
10.1 Chapter Overview
10.2 North America
10.2.1 Trends Analysis
10.2.2 North America Solid-State & Other Energy-Efficient Lighting Market Estimates and Forecasts, by Country (2020-2032) (USD Billion)
10.2.3 North America Solid-State & Other Energy-Efficient Lighting Market Estimates and Forecasts, by Technology (2020-2032) (USD Billion)
10.2.4 North America Solid-State & Other Energy-Efficient Lighting Market Estimates and Forecasts, by Installation (2020-2032) (USD Billion)
10.2.5 North America Solid-State & Other Energy-Efficient Lighting Market Estimates and Forecasts, by Application (2020-2032) (USD Billion)
10.2.6 USA
10.2.6.1 USA Solid-State & Other Energy-Efficient Lighting Market Estimates and Forecasts, by Technology (2020-2032) (USD Billion)
10.2.6.2 USA Solid-State & Other Energy-Efficient Lighting Market Estimates and Forecasts, by Installation (2020-2032) (USD Billion)
10.2.6.3 USA Solid-State & Other Energy-Efficient Lighting Market Estimates and Forecasts, by Application (2020-2032) (USD Billion)
10.2.7 Canada
10.2.7.1 Canada Solid-State & Other Energy-Efficient Lighting Market Estimates and Forecasts, by Technology (2020-2032) (USD Billion)
10.2.7.2 Canada Solid-State & Other Energy-Efficient Lighting Market Estimates and Forecasts, by Installation (2020-2032) (USD Billion)
10.2.7.3 Canada Solid-State & Other Energy-Efficient Lighting Market Estimates and Forecasts, by Application (2020-2032) (USD Billion)
10.2.8 Mexico
10.2.8.1 Mexico Solid-State & Other Energy-Efficient Lighting Market Estimates and Forecasts, by Technology (2020-2032) (USD Billion)
10.2.8.2 Mexico Solid-State & Other Energy-Efficient Lighting Market Estimates and Forecasts, by Installation (2020-2032) (USD Billion)
10.2.8.3 Mexico Solid-State & Other Energy-Efficient Lighting Market Estimates and Forecasts, by Application (2020-2032) (USD Billion)
10.3 Europe
10.3.1 Eastern Europe
10.3.1.1 Trends Analysis
10.3.1.2 Eastern Europe Solid-State & Other Energy-Efficient Lighting Market Estimates and Forecasts, by Country (2020-2032) (USD Billion)
10.3.1.3 Eastern Europe Solid-State & Other Energy-Efficient Lighting Market Estimates and Forecasts, by Technology (2020-2032) (USD Billion)
10.3.1.4 Eastern Europe Solid-State & Other Energy-Efficient Lighting Market Estimates and Forecasts, by Installation (2020-2032) (USD Billion)
10.3.1.5 Eastern Europe Solid-State & Other Energy-Efficient Lighting Market Estimates and Forecasts, by Application (2020-2032) (USD Billion)
10.3.1.6 Poland
10.3.1.6.1 Poland Solid-State & Other Energy-Efficient Lighting Market Estimates and Forecasts, by Technology (2020-2032) (USD Billion)
10.3.1.6.2 Poland Solid-State & Other Energy-Efficient Lighting Market Estimates and Forecasts, by Installation (2020-2032) (USD Billion)
10.3.1.6.3 Poland Solid-State & Other Energy-Efficient Lighting Market Estimates and Forecasts, by Application (2020-2032) (USD Billion)
10.3.1.7 Romania
10.3.1.7.1 Romania Solid-State & Other Energy-Efficient Lighting Market Estimates and Forecasts, by Technology (2020-2032) (USD Billion)
10.3.1.7.2 Romania Solid-State & Other Energy-Efficient Lighting Market Estimates and Forecasts, by Installation (2020-2032) (USD Billion)
10.3.1.7.3 Romania Solid-State & Other Energy-Efficient Lighting Market Estimates and Forecasts, by Application (2020-2032) (USD Billion)
10.3.1.8 Hungary
10.3.1.8.1 Hungary Solid-State & Other Energy-Efficient Lighting Market Estimates and Forecasts, by Technology (2020-2032) (USD Billion)
10.3.1.8.2 Hungary Solid-State & Other Energy-Efficient Lighting Market Estimates and Forecasts, by Installation (2020-2032) (USD Billion)
10.3.1.8.3 Hungary Solid-State & Other Energy-Efficient Lighting Market Estimates and Forecasts, by Application (2020-2032) (USD Billion)
10.3.1.9 Turkey
10.3.1.9.1 Turkey Solid-State & Other Energy-Efficient Lighting Market Estimates and Forecasts, by Technology (2020-2032) (USD Billion)
10.3.1.9.2 Turkey Solid-State & Other Energy-Efficient Lighting Market Estimates and Forecasts, by Installation (2020-2032) (USD Billion)
10.3.1.9.3 Turkey Solid-State & Other Energy-Efficient Lighting Market Estimates and Forecasts, by Application (2020-2032) (USD Billion)
10.3.1.10 Rest of Eastern Europe
10.3.1.10.1 Rest of Eastern Europe Solid-State & Other Energy-Efficient Lighting Market Estimates and Forecasts, by Technology (2020-2032) (USD Billion)
10.3.1.10.2 Rest of Eastern Europe Solid-State & Other Energy-Efficient Lighting Market Estimates and Forecasts, by Installation (2020-2032) (USD Billion)
10.3.1.10.3 Rest of Eastern Europe Solid-State & Other Energy-Efficient Lighting Market Estimates and Forecasts, by Application (2020-2032) (USD Billion)
10.3.2 Western Europe
10.3.2.1 Trends Analysis
10.3.2.2 Western Europe Solid-State & Other Energy-Efficient Lighting Market Estimates and Forecasts, by Country (2020-2032) (USD Billion)
10.3.2.3 Western Europe Solid-State & Other Energy-Efficient Lighting Market Estimates and Forecasts, by Technology (2020-2032) (USD Billion)
10.3.2.4 Western Europe Solid-State & Other Energy-Efficient Lighting Market Estimates and Forecasts, by Installation (2020-2032) (USD Billion)
10.3.2.5 Western Europe Solid-State & Other Energy-Efficient Lighting Market Estimates and Forecasts, by Application (2020-2032) (USD Billion)
10.3.2.6 Germany
10.3.2.6.1 Germany Solid-State & Other Energy-Efficient Lighting Market Estimates and Forecasts, by Technology (2020-2032) (USD Billion)
10.3.2.6.2 Germany Solid-State & Other Energy-Efficient Lighting Market Estimates and Forecasts, by Installation (2020-2032) (USD Billion)
10.3.2.6.3 Germany Solid-State & Other Energy-Efficient Lighting Market Estimates and Forecasts, by Application (2020-2032) (USD Billion)
10.3.2.7 France
10.3.2.7.1 France Solid-State & Other Energy-Efficient Lighting Market Estimates and Forecasts, by Technology (2020-2032) (USD Billion)
10.3.2.7.2 France Solid-State & Other Energy-Efficient Lighting Market Estimates and Forecasts, by Installation (2020-2032) (USD Billion)
10.3.2.7.3 France Solid-State & Other Energy-Efficient Lighting Market Estimates and Forecasts, by Application (2020-2032) (USD Billion)
10.3.2.8 UK
10.3.2.8.1 UK Solid-State & Other Energy-Efficient Lighting Market Estimates and Forecasts, by Technology (2020-2032) (USD Billion)
10.3.2.8.2 UK Solid-State & Other Energy-Efficient Lighting Market Estimates and Forecasts, by Installation (2020-2032) (USD Billion)
10.3.2.8.3 UK Solid-State & Other Energy-Efficient Lighting Market Estimates and Forecasts, by Application (2020-2032) (USD Billion)
10.3.2.9 Italy
10.3.2.9.1 Italy Solid-State & Other Energy-Efficient Lighting Market Estimates and Forecasts, by Technology (2020-2032) (USD Billion)
10.3.2.9.2 Italy Solid-State & Other Energy-Efficient Lighting Market Estimates and Forecasts, by Installation (2020-2032) (USD Billion)
10.3.2.9.3 Italy Solid-State & Other Energy-Efficient Lighting Market Estimates and Forecasts, by Application (2020-2032) (USD Billion)
10.3.2.10 Spain
10.3.2.10.1 Spain Solid-State & Other Energy-Efficient Lighting Market Estimates and Forecasts, by Technology (2020-2032) (USD Billion)
10.3.2.10.2 Spain Solid-State & Other Energy-Efficient Lighting Market Estimates and Forecasts, by Installation (2020-2032) (USD Billion)
10.3.2.10.3 Spain Solid-State & Other Energy-Efficient Lighting Market Estimates and Forecasts, by Application (2020-2032) (USD Billion)
10.3.2.11 Netherlands
10.3.2.11.1 Netherlands Solid-State & Other Energy-Efficient Lighting Market Estimates and Forecasts, by Technology (2020-2032) (USD Billion)
10.3.2.11.2 Netherlands Solid-State & Other Energy-Efficient Lighting Market Estimates and Forecasts, by Installation (2020-2032) (USD Billion)
10.3.2.11.3 Netherlands Solid-State & Other Energy-Efficient Lighting Market Estimates and Forecasts, by Application (2020-2032) (USD Billion)
10.3.2.12 Switzerland
10.3.2.12.1 Switzerland Solid-State & Other Energy-Efficient Lighting Market Estimates and Forecasts, by Technology (2020-2032) (USD Billion)
10.3.2.12.2 Switzerland Solid-State & Other Energy-Efficient Lighting Market Estimates and Forecasts, by Installation (2020-2032) (USD Billion)
10.3.2.12.3 Switzerland Solid-State & Other Energy-Efficient Lighting Market Estimates and Forecasts, by Application (2020-2032) (USD Billion)
10.3.2.13 Austria
10.3.2.13.1 Austria Solid-State & Other Energy-Efficient Lighting Market Estimates and Forecasts, by Technology (2020-2032) (USD Billion)
10.3.2.13.2 Austria Solid-State & Other Energy-Efficient Lighting Market Estimates and Forecasts, by Installation (2020-2032) (USD Billion)
10.3.2.13.3 Austria Solid-State & Other Energy-Efficient Lighting Market Estimates and Forecasts, by Application (2020-2032) (USD Billion)
10.3.2.14 Rest of Western Europe
10.3.2.14.1 Rest of Western Europe Solid-State & Other Energy-Efficient Lighting Market Estimates and Forecasts, by Technology (2020-2032) (USD Billion)
10.3.2.14.2 Rest of Western Europe Solid-State & Other Energy-Efficient Lighting Market Estimates and Forecasts, by Installation (2020-2032) (USD Billion)
10.3.2.14.3 Rest of Western Europe Solid-State & Other Energy-Efficient Lighting Market Estimates and Forecasts, by Application (2020-2032) (USD Billion)
10.4 Asia-Pacific
10.4.1 Trends Analysis
10.4.2 Asia-Pacific Solid-State & Other Energy-Efficient Lighting Market Estimates and Forecasts, by Country (2020-2032) (USD Billion)
10.4.3 Asia-Pacific Solid-State & Other Energy-Efficient Lighting Market Estimates and Forecasts, by Technology (2020-2032) (USD Billion)
10.4.4 Asia-Pacific Solid-State & Other Energy-Efficient Lighting Market Estimates and Forecasts, by Installation (2020-2032) (USD Billion)
10.4.5 Asia-Pacific Solid-State & Other Energy-Efficient Lighting Market Estimates and Forecasts, by Application (2020-2032) (USD Billion)
10.4.6 China
10.4.6.1 China Solid-State & Other Energy-Efficient Lighting Market Estimates and Forecasts, by Technology (2020-2032) (USD Billion)
10.4.6.2 China Solid-State & Other Energy-Efficient Lighting Market Estimates and Forecasts, by Installation (2020-2032) (USD Billion)
10.4.6.3 China Solid-State & Other Energy-Efficient Lighting Market Estimates and Forecasts, by Application (2020-2032) (USD Billion)
10.4.7 India
10.4.7.1 India Solid-State & Other Energy-Efficient Lighting Market Estimates and Forecasts, by Technology (2020-2032) (USD Billion)
10.4.7.2 India Solid-State & Other Energy-Efficient Lighting Market Estimates and Forecasts, by Installation (2020-2032) (USD Billion)
10.4.7.3 India Solid-State & Other Energy-Efficient Lighting Market Estimates and Forecasts, by Application (2020-2032) (USD Billion)
10.4.8 Japan
10.4.8.1 Japan Solid-State & Other Energy-Efficient Lighting Market Estimates and Forecasts, by Technology (2020-2032) (USD Billion)
10.4.8.2 Japan Solid-State & Other Energy-Efficient Lighting Market Estimates and Forecasts, by Installation (2020-2032) (USD Billion)
10.4.8.3 Japan Solid-State & Other Energy-Efficient Lighting Market Estimates and Forecasts, by Application (2020-2032) (USD Billion)
10.4.9 South Korea
10.4.9.1 South Korea Solid-State & Other Energy-Efficient Lighting Market Estimates and Forecasts, by Technology (2020-2032) (USD Billion)
10.4.9.2 South Korea Solid-State & Other Energy-Efficient Lighting Market Estimates and Forecasts, by Installation (2020-2032) (USD Billion)
10.4.9.3 South Korea Solid-State & Other Energy-Efficient Lighting Market Estimates and Forecasts, by Application (2020-2032) (USD Billion)
10.4.10 Vietnam
10.4.10.1 Vietnam Solid-State & Other Energy-Efficient Lighting Market Estimates and Forecasts, by Technology (2020-2032) (USD Billion)
10.4.10.2 Vietnam Solid-State & Other Energy-Efficient Lighting Market Estimates and Forecasts, by Installation (2020-2032) (USD Billion)
10.4.10.3 Vietnam Solid-State & Other Energy-Efficient Lighting Market Estimates and Forecasts, by Application (2020-2032) (USD Billion)
10.4.11 Singapore
10.4.11.1 Singapore Solid-State & Other Energy-Efficient Lighting Market Estimates and Forecasts, by Technology (2020-2032) (USD Billion)
10.4.11.2 Singapore Solid-State & Other Energy-Efficient Lighting Market Estimates and Forecasts, by Installation (2020-2032) (USD Billion)
10.4.11.3 Singapore Solid-State & Other Energy-Efficient Lighting Market Estimates and Forecasts, by Application (2020-2032) (USD Billion)
10.4.12 Australia
10.4.12.1 Australia Solid-State & Other Energy-Efficient Lighting Market Estimates and Forecasts, by Technology (2020-2032) (USD Billion)
10.4.12.2 Australia Solid-State & Other Energy-Efficient Lighting Market Estimates and Forecasts, by Installation (2020-2032) (USD Billion)
10.4.12.3 Australia Solid-State & Other Energy-Efficient Lighting Market Estimates and Forecasts, by Application (2020-2032) (USD Billion)
10.4.13 Rest of Asia-Pacific
10.4.13.1 Rest of Asia-Pacific Solid-State & Other Energy-Efficient Lighting Market Estimates and Forecasts, by Technology (2020-2032) (USD Billion)
10.4.13.2 Rest of Asia-Pacific Solid-State & Other Energy-Efficient Lighting Market Estimates and Forecasts, by Installation (2020-2032) (USD Billion)
10.4.13.3 Rest of Asia-Pacific Solid-State & Other Energy-Efficient Lighting Market Estimates and Forecasts, by Application (2020-2032) (USD Billion)
10.5 Middle East and Africa
10.5.1 Middle East
10.5.1.1 Trends Analysis
10.5.1.2 Middle East Solid-State & Other Energy-Efficient Lighting Market Estimates and Forecasts, by Country (2020-2032) (USD Billion)
10.5.1.3 Middle East Solid-State & Other Energy-Efficient Lighting Market Estimates and Forecasts, by Technology (2020-2032) (USD Billion)
10.5.1.4 Middle East Solid-State & Other Energy-Efficient Lighting Market Estimates and Forecasts, by Installation (2020-2032) (USD Billion)
10.5.1.5 Middle East Solid-State & Other Energy-Efficient Lighting Market Estimates and Forecasts, by Application (2020-2032) (USD Billion)
10.5.1.6 UAE
10.5.1.6.1 UAE Solid-State & Other Energy-Efficient Lighting Market Estimates and Forecasts, by Technology (2020-2032) (USD Billion)
10.5.1.6.2 UAE Solid-State & Other Energy-Efficient Lighting Market Estimates and Forecasts, by Installation (2020-2032) (USD Billion)
10.5.1.6.3 UAE Solid-State & Other Energy-Efficient Lighting Market Estimates and Forecasts, by Application (2020-2032) (USD Billion)
10.5.1.7 Egypt
10.5.1.7.1 Egypt Solid-State & Other Energy-Efficient Lighting Market Estimates and Forecasts, by Technology (2020-2032) (USD Billion)
10.5.1.7.2 Egypt Solid-State & Other Energy-Efficient Lighting Market Estimates and Forecasts, by Installation (2020-2032) (USD Billion)
10.5.1.7.3 Egypt Solid-State & Other Energy-Efficient Lighting Market Estimates and Forecasts, by Application (2020-2032) (USD Billion)
10.5.1.8 Saudi Arabia
10.5.1.8.1 Saudi Arabia Solid-State & Other Energy-Efficient Lighting Market Estimates and Forecasts, by Technology (2020-2032) (USD Billion)
10.5.1.8.2 Saudi Arabia Solid-State & Other Energy-Efficient Lighting Market Estimates and Forecasts, by Installation (2020-2032) (USD Billion)
10.5.1.8.3 Saudi Arabia Solid-State & Other Energy-Efficient Lighting Market Estimates and Forecasts, by Application (2020-2032) (USD Billion)
10.5.1.9 Qatar
10.5.1.9.1 Qatar Solid-State & Other Energy-Efficient Lighting Market Estimates and Forecasts, by Technology (2020-2032) (USD Billion)
10.5.1.9.2 Qatar Solid-State & Other Energy-Efficient Lighting Market Estimates and Forecasts, by Installation (2020-2032) (USD Billion)
10.5.1.9.3 Qatar Solid-State & Other Energy-Efficient Lighting Market Estimates and Forecasts, by Application (2020-2032) (USD Billion)
10.5.1.10 Rest of Middle East
10.5.1.10.1 Rest of Middle East Solid-State & Other Energy-Efficient Lighting Market Estimates and Forecasts, by Technology (2020-2032) (USD Billion)
10.5.1.10.2 Rest of Middle East Solid-State & Other Energy-Efficient Lighting Market Estimates and Forecasts, by Installation (2020-2032) (USD Billion)
10.5.1.10.3 Rest of Middle East Solid-State & Other Energy-Efficient Lighting Market Estimates and Forecasts, by Application (2020-2032) (USD Billion)
10.5.2 Africa
10.5.2.1 Trends Analysis
10.5.2.2 Africa Solid-State & Other Energy-Efficient Lighting Market Estimates and Forecasts, by Country (2020-2032) (USD Billion)
10.5.2.3 Africa Solid-State & Other Energy-Efficient Lighting Market Estimates and Forecasts, by Technology (2020-2032) (USD Billion)
10.5.2.4 Africa Solid-State & Other Energy-Efficient Lighting Market Estimates and Forecasts, by Installation (2020-2032) (USD Billion)
10.5.2.5 Africa Solid-State & Other Energy-Efficient Lighting Market Estimates and Forecasts, by Application (2020-2032) (USD Billion)
10.5.2.6 South Africa
10.5.2.6.1 South Africa Solid-State & Other Energy-Efficient Lighting Market Estimates and Forecasts, by Technology (2020-2032) (USD Billion)
10.5.2.6.2 South Africa Solid-State & Other Energy-Efficient Lighting Market Estimates and Forecasts, by Installation (2020-2032) (USD Billion)
10.5.2.6.3 South Africa Solid-State & Other Energy-Efficient Lighting Market Estimates and Forecasts, by Application (2020-2032) (USD Billion)
10.5.2.7 Nigeria
10.5.2.7.1 Nigeria Solid-State & Other Energy-Efficient Lighting Market Estimates and Forecasts, by Technology (2020-2032) (USD Billion)
10.5.2.7.2 Nigeria Solid-State & Other Energy-Efficient Lighting Market Estimates and Forecasts, by Installation (2020-2032) (USD Billion)
10.5.2.7.3 Nigeria Solid-State & Other Energy-Efficient Lighting Market Estimates and Forecasts, by Application (2020-2032) (USD Billion)
10.5.2.8 Rest of Africa
10.5.2.8.1 Rest of Africa Solid-State & Other Energy-Efficient Lighting Market Estimates and Forecasts, by Technology (2020-2032) (USD Billion)
10.5.2.8.2 Rest of Africa Solid-State & Other Energy-Efficient Lighting Market Estimates and Forecasts, by Installation (2020-2032) (USD Billion)
10.5.2.8.3 Rest of Africa Solid-State & Other Energy-Efficient Lighting Market Estimates and Forecasts, by Application (2020-2032) (USD Billion)
10.6 Latin America
10.6.1 Trends Analysis
10.6.2 Latin America Solid-State & Other Energy-Efficient Lighting Market Estimates and Forecasts, by Country (2020-2032) (USD Billion)
10.6.3 Latin America Solid-State & Other Energy-Efficient Lighting Market Estimates and Forecasts, by Technology (2020-2032) (USD Billion)
10.6.4 Latin America Solid-State & Other Energy-Efficient Lighting Market Estimates and Forecasts, by Installation (2020-2032) (USD Billion)
10.6.5 Latin America Solid-State & Other Energy-Efficient Lighting Market Estimates and Forecasts, by Application (2020-2032) (USD Billion)
10.6.6 Brazil
10.6.6.1 Brazil Solid-State & Other Energy-Efficient Lighting Market Estimates and Forecasts, by Technology (2020-2032) (USD Billion)
10.6.6.2 Brazil Solid-State & Other Energy-Efficient Lighting Market Estimates and Forecasts, by Installation (2020-2032) (USD Billion)
10.6.6.3 Brazil Solid-State & Other Energy-Efficient Lighting Market Estimates and Forecasts, by Application (2020-2032) (USD Billion)
10.6.7 Argentina
10.6.7.1 Argentina Solid-State & Other Energy-Efficient Lighting Market Estimates and Forecasts, by Technology (2020-2032) (USD Billion)
10.6.7.2 Argentina Solid-State & Other Energy-Efficient Lighting Market Estimates and Forecasts, by Installation (2020-2032) (USD Billion)
10.6.7.3 Argentina Solid-State & Other Energy-Efficient Lighting Market Estimates and Forecasts, by Application (2020-2032) (USD Billion)
10.6.8 Colombia
10.6.8.1 Colombia Solid-State & Other Energy-Efficient Lighting Market Estimates and Forecasts, by Technology (2020-2032) (USD Billion)
10.6.8.2 Colombia Solid-State & Other Energy-Efficient Lighting Market Estimates and Forecasts, by Installation (2020-2032) (USD Billion)
10.6.8.3 Colombia Solid-State & Other Energy-Efficient Lighting Market Estimates and Forecasts, by Application (2020-2032) (USD Billion)
10.6.9 Rest of Latin America
10.6.9.1 Rest of Latin America Solid-State & Other Energy-Efficient Lighting Market Estimates and Forecasts, by Technology (2020-2032) (USD Billion)
10.6.9.2 Rest of Latin America Solid-State & Other Energy-Efficient Lighting Market Estimates and Forecasts, by Installation (2020-2032) (USD Billion)
10.6.9.3 Rest of Latin America Solid-State & Other Energy-Efficient Lighting Market Estimates and Forecasts, by Application (2020-2032) (USD Billion)
11. Company Profiles
11.1 Wolfspeed Inc.
11.1.1 Company Overview
11.1.2 Financial
11.1.3 Products/ Services Offered
11.1.4 SWOT Analysis
11.2 Energy Focus Inc.
11.2.1 Company Overview
11.2.2 Financial
11.2.3 Products/ Services Offered
11.2.4 SWOT Analysis
11.3 GE Lighting
11.3.1 Company Overview
11.3.2 Financial
11.3.3 Products/ Services Offered
11.3.4 SWOT Analysis
11.4 Koninklijke Philips N.V.
11.4.1 Company Overview
11.4.2 Financial
11.4.3 Products/ Services Offered
11.4.4 SWOT Analysis
11.5 Mitsubishi Electric Corporation
11.5.1 Company Overview
11.5.2 Financial
11.5.3 Products/ Services Offered
11.5.4 SWOT Analysis
11.6 Osram Licht AG
11.6.1 Company Overview
11.6.2 Financial
11.6.3 Products/ Services Offered
11.6.4 SWOT Analysis
11.7 Samsung Electronics Co. Ltd.
11.7.1 Company Overview
11.7.2 Financial
11.7.3 Products/ Services Offered
11.7.4 SWOT Analysis
11.8 Seoul Semiconductor Co. Ltd.
11.8.1 Company Overview
11.8.2 Financial
11.8.3 Products/ Services Offered
11.8.4 SWOT Analysis
11.9 Sharp Corporation
11.9.1 Company Overview
11.9.2 Financial
11.9.3 Products/ Services Offered
11.9.4 SWOT Analysis
11.10 Toshiba Corporation
11.10.1 Company Overview
11.10.2 Financial
11.10.3 Products/ Services Offered
11.10.4 SWOT Analysis
12. Use Cases and Best Practices
13. Conclusion
An accurate research report requires proper strategizing as well as implementation. There are multiple factors involved in the completion of good and accurate research report and selecting the best methodology to compete the research is the toughest part. Since the research reports we provide play a crucial role in any company’s decision-making process, therefore we at SNS Insider always believe that we should choose the best method which gives us results closer to reality. This allows us to reach at a stage wherein we can provide our clients best and accurate investment to output ratio.
Each report that we prepare takes a timeframe of 350-400 business hours for production. Starting from the selection of titles through a couple of in-depth brain storming session to the final QC process before uploading our titles on our website we dedicate around 350 working hours. The titles are selected based on their current market cap and the foreseen CAGR and growth.
The 5 steps process:
Step 1: Secondary Research:
Secondary Research or Desk Research is as the name suggests is a research process wherein, we collect data through the readily available information. In this process we use various paid and unpaid databases which our team has access to and gather data through the same. This includes examining of listed companies’ annual reports, Journals, SEC filling etc. Apart from this our team has access to various associations across the globe across different industries. Lastly, we have exchange relationships with various university as well as individual libraries.

Step 2: Primary Research
When we talk about primary research, it is a type of study in which the researchers collect relevant data samples directly, rather than relying on previously collected data. This type of research is focused on gaining content specific facts that can be sued to solve specific problems. Since the collected data is fresh and first hand therefore it makes the study more accurate and genuine.
We at SNS Insider have divided Primary Research into 2 parts.
Part 1 wherein we interview the KOLs of major players as well as the upcoming ones across various geographic regions. This allows us to have their view over the market scenario and acts as an important tool to come closer to the accurate market numbers. As many as 45 paid and unpaid primary interviews are taken from both the demand and supply side of the industry to make sure we land at an accurate judgement and analysis of the market.
This step involves the triangulation of data wherein our team analyses the interview transcripts, online survey responses and observation of on filed participants. The below mentioned chart should give a better understanding of the part 1 of the primary interview.

Part 2: In this part of primary research the data collected via secondary research and the part 1 of the primary research is validated with the interviews from individual consultants and subject matter experts.
Consultants are those set of people who have at least 12 years of experience and expertise within the industry whereas Subject Matter Experts are those with at least 15 years of experience behind their back within the same space. The data with the help of two main processes i.e., FGDs (Focused Group Discussions) and IDs (Individual Discussions). This gives us a 3rd party nonbiased primary view of the market scenario making it a more dependable one while collation of the data pointers.
Step 3: Data Bank Validation
Once all the information is collected via primary and secondary sources, we run that information for data validation. At our intelligence centre our research heads track a lot of information related to the market which includes the quarterly reports, the daily stock prices, and other relevant information. Our data bank server gets updated every fortnight and that is how the information which we collected using our primary and secondary information is revalidated in real time.

Step 4: QA/QC Process
After all the data collection and validation our team does a final level of quality check and quality assurance to get rid of any unwanted or undesired mistakes. This might include but not limited to getting rid of the any typos, duplication of numbers or missing of any important information. The people involved in this process include technical content writers, research heads and graphics people. Once this process is completed the title gets uploader on our platform for our clients to read it.
Step 5: Final QC/QA Process:
This is the last process and comes when the client has ordered the study. In this process a final QA/QC is done before the study is emailed to the client. Since we believe in giving our clients a good experience of our research studies, therefore, to make sure that we do not lack at our end in any way humanly possible we do a final round of quality check and then dispatch the study to the client.
By Technology
Hid Lighting
Plasma
Induction Lighting
Solid-State Lighting
Fluorescent Lighting
By Installation
New Installation
Retrofit Installation
By Application
Oil and Gas
Chemical, Mining
Request for Segment Customization as per your Business Requirement: Segment Customization Request
Regional Coverage:
North America
US
Canada
Mexico
Europe
Eastern Europe
Poland
Romania
Hungary
Turkey
Rest of Eastern Europe
Western Europe
Germany
France
UK
Italy
Spain
Netherlands
Switzerland
Austria
Rest of Western Europe
Asia Pacific
China
India
Japan
South Korea
Vietnam
Singapore
Australia
Rest of Asia Pacific
Middle East & Africa
Middle East
UAE
Egypt
Saudi Arabia
Qatar
Rest of Middle East
Africa
Nigeria
South Africa
Rest of Africa
Latin America
Brazil
Argentina
Colombia
Rest of Latin America
Request for Country Level Research Report: Country Level Customization Request
Available Customization
With the given market data, SNS Insider offers customization as per the company’s specific needs. The following customization options are available for the report:
Detailed Volume Analysis
Criss-Cross segment analysis (e.g. Product X Application)
Competitive Product Benchmarking
Geographic Analysis
Additional countries in any of the regions
Customized Data Representation
Detailed analysis and profiling of additional market players
The Facial Recognition Market Size was valued at USD 6.2 Billion in 2023 and is expecting to grow at a CAGR of 15.91% to reach USD 23.4 Billion by 2032.
The Integrated Microwave Assembly Market was valued at USD 1.95 billion in 2023 and is expected to reach USD 3.49 billion by 2032, growing at a CAGR of 6.71% over the forecast period 2024-2032.
The Smart Motors Market Size was valued at USD 1.98 billion in 2023 and is expected to grow at a CAGR of 6.58% to reach USD 3.51 billion by 2032.
The AI Chip Market Size was valued at USD 61.45 Billion in 2023 and is estimated to reach USD 621.15 Billion by 2032, at a CAGR of 29.4% from 2024 to 2032.
The Autonomous Mobile Manipulator Robots (AMMR) market was valued at USD 431.36 million in 2023 and is projected to reach USD 2,509.69 million by 2032, growing at a robust CAGR of 21.77% from 2024 to 2032.
The Soil Moisture Sensor Market size was valued at USD 337 Million in 2023 and is expected to reach USD 1124.30 Million by 2032 at a CAGR of 14.33% during the forecast period of 2024-2032.

Hi! Click one of our member below to chat on Phone
© 2025 All Rights Reserved by SNS Insider Pvt Ltd


