Software Defined Perimeter Market Size & Overview:
To Get More Information on Software Defined Perimeter Market - Request Sample Report
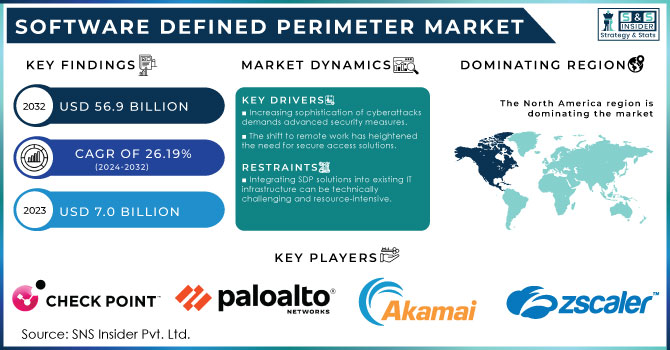
Software Defined Perimeter Market was valued at USD 7.0 billion in 2023 and is expected to reach USD 56.9 Billion by 2032, growing at a CAGR of 26.19% from 2024-2032.
The Software Defined Perimeter (SDP) market is witnessing significant growth due to the growing need for secure remote access and cloud adoption. The SDP technology wraps the users and devices in a type of dynamic perimeter, providing organizations with the ability to permit access to their networks only when you have been identified both by the user and device. Some key growth drivers include the increasing sophistication of cyber threats that require more robust security solutions. Plus, new working dynamic where remote work options became much more popular, and this also prompted the transition to SDP solutions as organizations needed to protect their digital products but also support remote working environments. SDP frameworks have already been adopted by many companies such as Google to safeguard their cloud services, providing an example of the approach being used to protect sensitive information.
Additionally, the increasing adoption of Internet of Things (IoT) devices is driving the need for SDP solutions because such endpoints often create security gaps that traditional models are not able to address. Till now, recent statistics show that connected IoT devices will surpass 30 billion in either by 2030 only where SDP can play a prominent role with great security framework so, the growing demand for it.
Furthermore, regulation on data protection and privacy continue to push organizations towards more secure infrastructures. SDP becomes a feasible way to keep data secure yet accessible as firms deal with extensive compliance environments. In conclusion, the Software Defined Perimeter market is experiencing an accelerated growth phase driven by the combination of remote work trends, increasing cyber threats, IoT proliferation, and regulatory pressures with a significant portion of organizations aiming to invest in this space to strengthen their Cyber Security posture.
| Metric | Before SDP Adoption | After SDP Adoption |
|
Breach Incidence |
High (>70% of organizations breached) |
Reduced significantly |
|
Attack Surface |
Broad exposure of network infrastructure |
Drastically reduced exposure |
|
Unauthorized Access |
Common due to less effective perimeters |
Less common; perimeter access tightly controlled |
|
Internal Data Leaks |
Frequent due to lateral movement |
Reduced; better control of internal networks |
|
Compliance |
Challenges in meeting compliance standards |
Easier compliance with stringent standards |
Market dynamics
Drivers
-
Increasing sophistication of cyberattacks demands advanced security measures.
-
The shift to remote work has heightened the need for secure access solutions.
-
SDP solutions offer a more economical way to manage security compared to traditional methods.
SDP solutions offer a cost-effective, user-centric approach to security management using on-demand resources instead of burdening infrastructure with traditional perimeter defenses. The traditional security approaches often rely on a lot of hardware at the edge like firewalls and intrusion detection systems; scaling this with growth is expensive. On the other hand, SDP uses software-driven architecture that means more flexibility and scalability without investing heavily in hardware.
With the implementation of SDP, organizations are able to bring down the operational costs involved with security management. By controlling who, what, and when someone accesses a resource that costs anything to keep operational (money, person power), SDP solutions allow for granular access controls based on the user/device identity so that only authenticated users and devices are able to connect to resources reducing the risk of costly security. By targeting a small amount of data, the risk of it being lost decreases which will save an organization from its hefty financial penalties and tarnished reputation.
Additionally, SDP solutions are typically compatible with the native cloud architecture in simplifying implementation and management. Such integration lessens the requirement for extensive training and resources which helps to reduce costs even more. Furthermore, since SDP bolsters security using dynamic configuration based on contextual changes in user/state and growing threat landscapes, organizations can better utilize their security budgets by freeing funds to proactively invest as opposed to reactively defending. In closing, SDP is more cost-effective than traditional systems in providing strong security without the operational and capital expense while also bringing agility to face changing threats and business needs.
Remote work has rapidly accelerated the need for secure remote access, driving explosive growth in Software Defined Perimeter (SDP) market. With the new remote work arrangements, employees started accessing corporate resources from anywhere — even outside of the enterprise network. While this transition opened the door to new levels of efficiency and productivity, it also introduced a host of new vulnerabilities that must be mitigated through careful and secure access management over sensitive information.
To overcome these challenges, SDP technology creates a security perimeter around users, devices and applications, Unlike a typical security model. SDP enables organizations to authenticate the identity of users and devices before they can access specific resources. Not only do we protect sensitive data, but this user-centric approach also improves overall security by reducing the available attack surface.
Furthermore, the trend of work from home has resulted in a surge in cloud services where employees necessitate access for applications and data that is seamless yet secure. SDP is another widely used security framework that integrates nicely with cloud environments, and provides a secure gateway which can dynamically adjust according to user context adjustments and risk levels. With this adaptability, critical resources are only accessible to authorized users even if they are in different locations. While SDP has been in demand even before the pandemic, we believe as remote work remains a long-term strategy for most organizations then the need to have secure access solutions such as SDP will see its high growing rise. This feature facilitates secure and productive work for employees who need to access the network on-the-go but want security by ensuring that corporate data will remain safe while providing flexible access. The result is that the SDP market stands to do quite well in this changing environment.
Restraints
-
Integrating SDP solutions into existing IT infrastructure can be technically challenging and resource-intensive.
-
SDP solutions may face compatibility challenges with legacy systems, complicating deployment.
-
Potential latency issues during access can arise if not properly configured, affecting user experience.
The Software Defined Perimeter (SDP) market is one such example where latencies can adversely impact the user experience, if not optimized correctly. SDP is a security-centric approach which builds end to end encrypted and dynamic connections between user(s) and resources however this increased security comes at the cost of longer time spent verifying identities for access. Misconfiguration like suboptimal routing, bad placement of servers, inadequate bandwidth causes noticeable latency for users accessing corporate resources remotely. Such delays can irritate users, lower their performance and ruin the point of working remotely. For example, employees can experience slow access to applications or files, disrupting their workflow.
Any latency can lead to a disaster in time-critical industries, such as finance or healthcare. Users, especially those new to password managers, might look elsewhere for a solution with lower security if the system feels sluggish or unwieldy. Organizations can avoid such problems by configuring their SDP properly, monitoring them continually, and tuning the systems. This helps businesses achieve the benefits of SDP technology by being able to provide a strong user experience while stronger security, their system can handle and work well if it is done right.
SDP has its own set of challenges, with many SDP solutions being incompatible with existing legacy systems which makes deployment complicated in the Software Defined Perimeter (SDP) market. However, despite the advantages, many organizations still rely on older traditional IT infrastructure whilst at the same time SDP focuses heavily on software-based access control and network security.
Legacy systems were often designed around more static, perimeter-based security models whereas SDP relies on more flexible identity-centered security protocols. Legacy systems tend to be more rigid in their design, which may necessitate heavy customization, new middleware setup, or the updating of old infrastructure just to connect SDP with these legacy systems — and that can take a long time and cost quite a bit. For industries such as manufacturing, finance, or government where operations are critical and legacy systems common due to regulatory requirements for decades that created the prototype operational need, these challenges put SDP adoption on hold.
Also, some older systems may not have the required application programming interfaces (APIs) or other communication interfaces to talk nicely with SDP platforms. IT resources can be strained when the transition requires the technical implementation of specialized expertise to manage these issues, which can further raise operational risks in a transitional period. To solve such compatibility issues, organizations might have to adopt phased upgrades or hybrid solutions that incorporate legacy systems alongside SDP technology. This method can ease the evolution by preserving vital legacy capabilities while slowly advancing protection using SDP’s innovation. But the intricacy of these kinds of integrations continues to be a primary factor in determining whether organizations adopt SDP options.
Segment Analysis
By Deployment
Cloud deployment dominated the market and hold the significant revenue share in 2023, owing to rising demand for flexible and scalable security solutions along with secure options. The shift to cloud-based services has increased the demand for protecting remote access to sensitive data in a new perimeter-less world. Helpful growth bullets include soaring demand for remote work, rising cloud adoption in various sectors, and expanding cyber threats targeting cloud environments. Moreover, the elasticity and affordability of cloud-based SDP solutions continue to appeal even more to enterprises of all sizes. It could be the fastest growing segment, because with the increasing demand for identity-based dynamic security controls specific for cloud spaces.
The on-premise segment of the Software Defined Perimeter (SDP) market is expected to maintain steady growth, especially in government, finance and healthcare, where data security and compliance regulations are stringent. Various drivers for growth involve a tighter grip on network security and sensitive data with the preference of enterprises to keep security infrastructure on-premise. Similarly, organizations with legacy systems also turn to on-premise SDP solutions in order to ensure that their existing IT environment remains compatible and under control. Nonetheless, the segment is under pressure from the increasing popularity of cloud-based solutions due to their scalability and cost benefits. Although slower than that of the cloud, on-premise SDP solutions will continue to play a major role in the ability for businesses wishing to have control and flexibility.
By End- User
The IT and telecommunications segment of the Software Defined Perimeter (SDP) market is poised for strong growth, driven by increasing demand for secure, scalable remote access and cloud services. As these industries handle vast amounts of sensitive data and manage complex networks, they face heightened cyber threats, pushing the adoption of advanced security solutions like SDP. Key growth drivers include the expansion of 5G networks, increased cloud migration, and the rise of remote work, all of which require robust, identity-based security protocols. Additionally, the need for low-latency, flexible network access boosts the demand for SDP solutions. This segment is expected to experience rapid growth as telecom companies seek to secure their infrastructure and services against evolving cyber threats.
The government segment is set for significant growth due to rising concerns about national security, cyber espionage, and data breaches. Governments handle highly sensitive information and are frequently targeted by sophisticated cyberattacks, driving the need for robust, advanced security solutions like SDP. Growth factors include increasing adoption of digital transformation initiatives, secure remote access for government employees, and the need to protect critical infrastructure. The implementation of strict data privacy regulations and compliance requirements further fuels SDP adoption in this sector. As governments worldwide invest in modernizing their IT infrastructure, the demand for SDP solutions is expected to grow, helping secure networks and safeguard confidential data from evolving cyber threats.
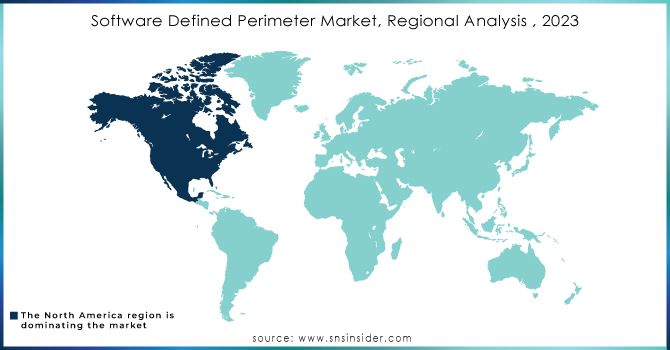
Regional Analysis
North America leads the Software Defined Perimeter (SDP) market and is expected to retain its dominance in the coming years, driven by advancements in technology, increased cloud adoption, and emerging trends. The rising demand for secure access to cloud resources, particularly as businesses embrace cloud-based services, is fueling SDP adoption. The growth of the remote workforce also boosts the market, with Forbes predicting over 32.6 million Americans, or about 22% of the workforce, will work remotely by 2025.
The presence of major U.S. market players and growing cybersecurity investments further bolster North America's position. In contrast, the Asia-Pacific region is expected to achieve the highest CAGR, with countries like China, Japan, India, and South Korea adopting SDP solutions for enhanced security, simplified operations, and greater agility.
Do You Need any Customization Research on Software Defined Perimeter Market - Enquire Now
Key Players
The Major key players are
-
Cisco Systems, Inc. - Cisco
-
Check Point Software Technologies Ltd. - Check Point
-
Palo Alto Networks, Inc. - Palo Alto Networks
-
Akamai Technologies, Inc. - Akamai
-
Zscaler, Inc. - Zscaler
-
Broadcom Inc. (Symantec Corporation) - Broadcom
-
Fortinet, Inc. - Fortinet
-
Juniper Networks, Inc. - Juniper Networks
-
IBM Corporation - IBM
-
Cloudflare, Inc. - Cloudflare
-
Google LLC (BeyondCorp) - Google
-
Microsoft Corporation (Azure AD Conditional Access) - Microsoft
-
Intel Corporation - Intel
-
Okta, Inc. - Okta
-
Forcepoint LLC - Forcepoint
-
Unisys Corporation - Unisys
-
AppGate, Inc. - AppGate
-
F5 Networks, Inc. - F5
-
Perimeter 81 - Perimeter 81
-
Centrify Corporation (now Delinea) - Delinea
Hardware Supplier
-
Brocade Communications Systems
-
Dell Technologies
-
NVIDIA Corporation
-
Hewlett Packard Enterprise (HPE)
-
Arista Networks
-
Qualcomm Incorporated
-
Supermicro Computer, Inc.
-
Arista Networks
-
Lenovo Group Limited
-
Supermicro Computer, Inc.
-
NVIDIA Corporation
-
Dell Technologies
-
Advanced Micro Devices (AMD)
-
Cisco Systems, Inc.
-
IBM Corporation
-
Hewlett Packard Enterprise (HPE)
-
Supermicro Computer, Inc.
-
Arista Networks
-
Hewlett Packard Enterprise (HPE)
-
Cisco Systems, Inc.
Recent Developments
September 2024: Cisco announced new features for its Webex platform, enhancing collaboration capabilities with AI-driven tools to improve user experience.
August 2024: Check Point introduced new features in its Harmony Endpoint security solution, including improved threat detection capabilities powered by AI.
April 2024: Akamai reported strong financial results for Q1 2024, driven by increased demand for its cloud security services.
| Report Attributes | Details |
| Market Size in 2023 | USD 7.0 billion |
| Market Size by 2032 | USD 56.9 Billion |
| CAGR | CAGR of 26.19% From 2024 to 2032 |
| Base Year | 2023 |
| Forecast Period | 2024-2032 |
| Historical Data | 2020-2022 |
| Report Scope & Coverage | Market Size, Segments Analysis, Competitive Landscape, Regional Analysis, DROC & SWOT Analysis, Forecast Outlook |
| Key Segments | • By Deployment Mode (On-Premises, Cloud) • By Organization Size (Large Enterprise, Small and Medium Enterprise) • By End Type (Government, IT & Telecom, Banking, Financial Services, Education, Manufacturing, Healthcare, Retail, Others) |
| Regional Analysis/Coverage | North America (US, Canada, Mexico), Europe (Eastern Europe [Poland, Romania, Hungary, Turkey, Rest of Eastern Europe] Western Europe] Germany, France, UK, Italy, Spain, Netherlands, Switzerland, Austria, Rest of Western Europe]), Asia Pacific (China, India, Japan, South Korea, Vietnam, Singapore, Australia, Rest of Asia Pacific), Middle East & Africa (Middle East [UAE, Egypt, Saudi Arabia, Qatar, Rest of Middle East], Africa [Nigeria, South Africa, Rest of Africa], Latin America (Brazil, Argentina, Colombia Rest of Latin America) |
| Company Profiles |
Cisco Systems, Inc., Check Point Software Technologies Ltd., Palo Alto Networks, Inc., Akamai Technologies, Inc., Zscaler, Inc., Broadcom Inc. (Symantec Corporation), Fortinet, Inc, Juniper Networks, Inc., IBM Corporation, Cloudflare, Inc., Google LLC (BeyondCorp) |
| Key Drivers | •Increasing sophistication of cyberattacks demands advanced security measures. •The shift to remote work has heightened the need for secure access solutions. •SDP solutions offer a more economical way to manage security compared to traditional methods. |
| Market Opportunity | •Integrating SDP solutions into existing IT infrastructure can be technically challenging and resource-intensive. •SDP solutions may face compatibility challenges with legacy systems, complicating deployment. •Potential latency issues during access can arise if not properly configured, affecting user experience. |
