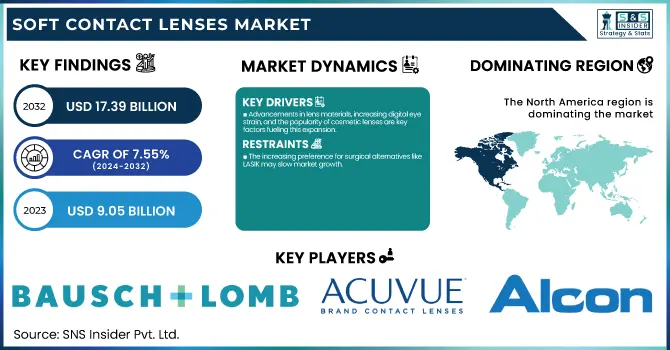
The Soft Contact Lenses Market size was valued at USD 9.05 billion in 2023 and is projected to reach USD 17.39 billion by 2032 and grow at a CAGR of 7.55% over the forecast period 2024-2032. This report examines demographic trends and usage patterns, highlighting the growing prevalence of vision problems and the increasing demand for corrective eyewear, particularly among younger consumers. The study delves into the adoption of new technologies, such as advanced lens materials, smart contact lenses, and innovative manufacturing techniques, which are transforming the market. Pricing trends and consumer spending are also analyzed, with a focus on the affordability of lenses and the influence of healthcare insurance on product accessibility. Additionally, the report explores environmental impact and sustainability trends, noting the rising demand for eco-friendly, reusable lenses and sustainable packaging options.
To Get more information on Soft Contact Lenses Market - Request Free Sample Report
Drivers
Advancements in lens materials, increasing digital eye strain, and the popularity of cosmetic lenses are key factors fueling this expansion.
The main cause for this trend is the increased rate of refractive vision disorders. In 2023, it was estimated that more than 35% of the global population suffered from myopia. Soon, the cases are going to increase at an alarming rate. As people started demanding corrective eyewear, comfort, and convenience made soft contact lenses a preferable choice over glasses. Technological developments in lens material and design have also driven this growth. The silicone hydrogel lenses of the early 2000s provide a significantly higher oxygen-permeable solution, thereby accommodating longer wear time and decreased irritation. Several research studies have determined that silicone hydrogel lenses carry a highly statistically significant decrease in dryness and irritation as opposed to traditional hydrogel lenses. Furthermore, advancement in specialty lens types such as toric lenses for astigmatism and multifocal lenses for presbyopia has also provided the opportunity for increased market capture by leading firms.
Increased demand has been fueled by the shift in lifestyle towards greater use of digital devices. Recent surveys show that more than 70% of adults have reported screen-related eye strain, creating a rising demand for products that alleviate discomfort. Clear, uninterrupted vision is an attractive feature in soft contact lenses to users looking at addressing digital eye strain. The popularity of cosmetic contact lenses has also mushroomed in market expansion. Brands offering a range of colored and cosmetic lenses appeal to fashion-forward consumers. All these factors are expected to keep the Soft Contact Lenses market growing in the coming years.
Restraints
The increasing preference for surgical alternatives like LASIK may slow market growth.
The most significant restraint in the Soft Contact Lenses market is the risk of eye infections and complications resulting from improper care of the lenses. Health professionals or eye specialists note that improper cleaning and storage of the lens may lead to serious issues, such as keratitis, thereby deterring some consumers from acquiring contact lenses. This challenges the use of premium lenses. Premium lenses would include silicone hydrogel or specialty lenses for cases of astigmatism and presbyopia, among others. These are significantly more expensive compared to the general lenses, making it harder to reach a wide population in case of lens replacements, cleaning solutions, and even routine eye examinations.
Opportunities
The development of advanced lens materials, such as biocompatible silicone hydrogel lenses, which offer greater oxygen permeability and comfort.
This technology could be more appealing to a broader audience, particularly those with sensitive eyes, due to extended wear times and decreased dryness and irritation. It includes specialty lenses that have exceptionally high growth prospects, such as toric lenses for patients with astigmatism and multifocal lenses for presbyopia. Furthermore, this growing age group will increasingly require customized vision correction solutions, thus paving the way for new product innovations and further market expansion. Additionally, increasing awareness over eye health as well as preventative care will increase the scope to raise awareness via educational campaigns, and contact lens manufacturers can collaborate with optometrists and offer them more affordable care packages to boost adoption.
Challenges
The lack of consumer education regarding proper lens care, leading to misuse and health complications.
Many users, particularly first-timers, may not fully understand the importance of regular cleaning, replacement schedules, and hygiene practices, which can result in discomfort or infections like conjunctivitis. This can contribute to negative perceptions and reluctance toward using contact lenses. Another challenge is the increasing market competition from corrective eye surgeries, such as LASIK. As the popularity of these procedures grows, many individuals prefer opting for a permanent solution to vision correction instead of relying on temporary contact lenses. This trend could hinder the long-term adoption of soft contact lenses in certain regions. Additionally, the availability of low-cost disposable lenses may create price sensitivity among consumers. While premium lenses offer superior comfort and quality, the affordability of basic lenses makes it difficult for some customers to justify investing in higher-end alternatives.
By Material
The silicone hydrogel segment dominated the Soft Contact Lenses market in 2023, accounting for more than 66.9% of the total revenue. This dominance is driven by the superior benefits of silicone hydrogel lenses, including increased oxygen permeability, which enhances comfort and reduces the risk of eye infections, allowing for longer wear times. These lenses are specially designed for keeping the eyes healthy and comfortable during the day. The hydrogel segment, while growing, will experience a lesser growth rate as compared to the silicone hydrogel lenses, considering the latter possess more advanced features.
By Design
The spherical soft contact lenses were the most widely used design, accounting for the largest market share in 2023. Their popularity is mainly attributed to their simplicity and effectiveness in correcting common vision issues such as myopia and hyperopia. These lenses are easier to manufacture and more affordable, making them a preferred option for the majority of contact lens users. The toric lens segment is expected to expand the most, based on the fact that astigmatism prevalence is increasing. The strong CAGR in the market is expected to be attributed to its increasing awareness among the population.
By Usage
The daily disposable lens segment accounted for the largest share of revenue, over 29.8%, in 2023. Their convenience, hygiene benefits, and reduced risk of eye infections make them a popular choice among consumers, particularly those with active lifestyles. The disposable nature eliminates the need for cleaning and storage, appealing to younger and tech-savvy individuals. On the other hand, disposable lenses are likely to demonstrate an enormous growth rate because consumers increasingly choose lenses that are flexible in terms of their wear schedules.
By Application
The corrective lens application was the dominant in 2023, representing more than 42.6% of the market share. The primary reason is the high penetration of contact lenses in correcting various refractive errors like near-sightedness, farsightedness, and astigmatism. As an increasing number of people opt for contact lenses due to aesthetic considerations and comfort reasons, corrective lenses remain the most sought-after category. However, the cosmetic lenses segment is expected to grow at a higher CAGR on account of increasing interest in fashion and novelty lenses, particularly among youths as well as patrons who are seeking colored or themed lenses.
By Distribution Channel
In 2023, the retail segment accounted for the largest revenue share, more than 45.2%. The retail channels of both physical stores and optical clinics allow consumers to try on lenses in person and receive professional advice from eye care experts. Such trust in in-person consultations continues to be a strong driver for the retail segment. The e-commerce segment, on the other hand, is anticipated to witness a strong CAGR, with growing online shopping penetration and increased preference for buying contact lenses from home.
North America held a 37.9% share of the market in 2023, led by the high adoption rate of contact lenses, especially in the U.S., where over 45 million people wear contact lenses. Demand is driven by advances in lens technology, growing prevalence of vision disorders, and strong retail and e-commerce distribution channels. Lifestyle-oriented and cosmetic contact lenses also increasingly contribute to North America's dominant position.
Asia-Pacific is anticipated to be the fastest growing due to spurred growing awareness on eye health, growing disposable incomes, and having the largest population affected by refractive vision disorders. The increased urbanization rates in countries like China, India, and Japan have further stimulated the demand for contact lenses along with the current rising trend in digital eye strain.

Get Customized Report as per Your Business Requirement - Enquiry Now
Bausch + Lomb Inc. - UltraSoft, SofLens, BioTrue ONEday, PureVision
Acuvue (Johnson & Johnson) - Acuvue Oasys, Acuvue 1-Day Moist, Acuvue Oasys for Astigmatism
Alcon Vision LLC - Air Optix, Dailies, FreshLook, Precision1
Carl Zeiss AG - Zeiss Contact Lenses
CooperVision Inc. - Biofinity, Proclear, Clariti
Essilor International - Varilux, Crizal (focused on eyewear, some contact lens offerings)
Hoya Corporation - Hoya Contact Lenses
Menicon Co., Ltd. - Menicon Z, Menicon PremiO, Menicon Soft
SEED Co., Ltd. - SEED 1day Pure, SEED Toric
Contamac Ltd. - Zen Lens, Optimum
Ciba Vision (now part of Alcon) - Focus Dailies, Focus Night & Day, AirOptix
Ginko International Co., Ltd. - Ginko Color Contact Lenses
SynergEyes, Inc. - Duette Hybrid Lenses
In July 2024, UK researchers received a USD 2.604 million grant to develop a "bandage" contact lens designed to aid in eye damage repair. This innovative lens will transfer corneal epithelial cells directly to the eye’s surface, providing a new method for treating eye injuries using soft contact lenses.
In June 2024, Bausch + Lomb launched its INFUSE for Astigmatism daily disposable contact lenses in the U.S. The company plans to begin shipping these lenses to eye care professionals in July 2024, marking a significant addition to its product lineup.
| Report Attributes | Report Attributes |
|---|---|
|
Market Size in 2023 |
USD 9.05 Billion |
|
Market Size by 2032 |
USD 17.39 Billion |
|
CAGR |
CAGR of 7.55% From 2024 to 2032 |
|
Base Year |
2023 |
|
Forecast Period |
2024-2032 |
|
Historical Data |
2020-2022 |
|
Report Scope & Coverage |
Market Size, Segments Analysis, Competitive Landscape, Regional Analysis, DROC & SWOT Analysis, Forecast Outlook |
|
Key Segments |
•By Material (Silicone Hydrogel, Hydrogel) |
|
Regional Analysis/Coverage |
North America (US, Canada, Mexico), Europe (Eastern Europe [Poland, Romania, Hungary, Turkey, Rest of Eastern Europe] Western Europe] Germany, France, UK, Italy, Spain, Netherlands, Switzerland, Austria, Rest of Western Europe]), Asia Pacific (China, India, Japan, South Korea, Vietnam, Singapore, Australia, Rest of Asia Pacific), Middle East & Africa (Middle East [UAE, Egypt, Saudi Arabia, Qatar, Rest of Middle East], Africa [Nigeria, South Africa, Rest of Africa], Latin America (Brazil, Argentina, Colombia, Rest of Latin America) |
|
Company Profiles |
Bausch + Lomb Inc., Acuvue (Johnson & Johnson), Alcon Vision LLC, Carl Zeiss AG, CooperVision Inc., Essilor International, Hoya Corporation, Menicon Co., Ltd., SEED Co., Ltd., Contamac Ltd., Ciba Vision (now part of Alcon), Ginko International Co., Ltd., SynergEyes, Inc., and UltraVision CLPL. |
Ans: The Soft Contact Lenses market is projected to grow at a CAGR of 7.55% during the forecast period.
Ans: By 2032, the Soft Contact Lenses market is expected to reach USD 17.39 billion, up from USD 9.05 billion in 2023.
Ans: Advancements in lens materials, increasing digital eye strain, and the popularity of cosmetic lenses are key factors fueling this expansion.
Ans: The increasing preference for surgical alternatives like LASIK may slow market growth.
Ans: North America is the dominant region in the Soft Contact Lenses market.
1. Introduction
1.1 Market Definition
1.2 Scope (Inclusion and Exclusions)
1.3 Research Assumptions
2. Executive Summary
2.1 Market Overview
2.2 Regional Synopsis
2.3 Competitive Summary
3. Research Methodology
3.1 Top-Down Approach
3.2 Bottom-up Approach
3.3. Data Validation
3.4 Primary Interviews
4. Market Dynamics Impact Analysis
4.1 Market Driving Factors Analysis
4.1.1 Drivers
4.1.2 Restraints
4.1.3 Opportunities
4.1.4 Challenges
4.2 PESTLE Analysis
4.3 Porter’s Five Forces Model
5. Statistical Insights and Trends Reporting
5.1 Demographic Trends and Usage Patterns (2023)
5.2 Adoption of New Technologies (2023)
5.3 Pricing Trends and Consumer Spending (2023)
5.4 Environmental Impact and Sustainability Trends (2023)
6. Competitive Landscape
6.1 List of Major Companies, By Region
6.2 Market Share Analysis, By Region
6.3 Product Benchmarking
6.3.1 Product specifications and features
6.3.2 Pricing
6.4 Strategic Initiatives
6.4.1 Marketing and promotional activities
6.4.2 Distribution and Supply Chain Strategies
6.4.3 Expansion plans and new product launches
6.4.4 Strategic partnerships and collaborations
6.5 Technological Advancements
6.6 Market Positioning and Branding
7. Soft Contact Lenses Market Segmentation, by Material
7.1 Chapter Overview
7.2 Silicone Hydrogel
7.2.1 Silicone Hydrogel Market Trends Analysis (2020-2032)
7.2.2 Silicone Hydrogel Market Size Estimates and Forecasts to 2032 (USD Billion)
7.3 Hydrogel
7.3.1 Hydrogel Market Trends Analysis (2020-2032)
7.3.2 Hydrogel Market Size Estimates and Forecasts to 2032 (USD Billion)
8. Soft Contact Lenses Market Segmentation, By Design
8.1 Chapter Overview
8.2 Spherical Lens
8.2.1 Spherical Lens Market Trends Analysis (2020-2032)
8.2.2 Spherical Lens Market Size Estimates And Forecasts To 2032 (USD Billion)
8.3 Toric Lens
8.3.1 Toric Lens Market Trends Analysis (2020-2032)
8.3.2 Toric Lens Market Size Estimates And Forecasts To 2032 (USD Billion)
8.4 Multifocal Lens
8.4.1 Multifocal Lens Market Trends Analysis (2020-2032)
8.4.2 Multifocal Lens Market Size Estimates And Forecasts To 2032 (USD Billion)
8.5 Other Lens
8.5.1 Other Lens Market Trends Analysis (2020-2032)
8.5.2 Other Lens Market Size Estimates And Forecasts To 2032 (USD Billion)
9. Soft Contact Lenses Market Segmentation, By Usage
9.1 Chapter Overview
9.2 Daily Disposable
9.2.1 Daily Disposable Market Trends Analysis (2020-2032)
9.2.2 Daily Disposable Market Size Estimates And Forecasts To 2032 (USD Billion)
9.3 Disposable
9.3.1 Disposable Market Trends Analysis (2020-2032)
9.3.2 Disposable Market Size Estimates And Forecasts To 2032 (USD Billion)
9.4 Frequently Disposable
9.4.1 Frequently Disposable Market Trends Analysis (2020-2032)
9.4.2 Frequently Disposable Market Size Estimates And Forecasts To 2032 (USD Billion)
9.5 Traditional (Reusable) lenses
9.5.1 Traditional (Reusable) Lenses Market Trends Analysis (2020-2032)
9.5.2 Traditional (Reusable) Lenses Market Size Estimates And Forecasts To 2032 (USD Billion)
10. Soft Contact Lenses Market Segmentation, By Application
10.1 Chapter Overview
10.2 Corrective
10.2.1 Corrective Market Trends Analysis (2020-2032)
10.2.2 Corrective Market Size Estimates And Forecasts To 2032 (USD Billion)
10.3 Therapeutic
10.3.1 Therapeutic Market Trends Analysis (2020-2032)
10.3.2 Therapeutic Market Size Estimates And Forecasts To 2032 (USD Billion)
10.4 Cosmetic
10.4.1 Cosmetic Market Trends Analysis (2020-2032)
10.4.2 Cosmetic Market Size Estimates And Forecasts To 2032 (USD Billion)
10.5 Prosthetic
10.5.1 Prosthetic Market Trends Analysis (2020-2032)
10.5.2 Prosthetic Market Size Estimates And Forecasts To 2032 (USD Billion)
10.6 Lifestyle-oriented
10.6.1 Lifestyle-oriented Market Trends Analysis (2020-2032)
10.6.2 Lifestyle-oriented Market Size Estimates And Forecasts To 2032 (USD Billion)
11. Soft Contact Lenses Market Segmentation, By Distribution Channel
11.2 E-commerce
11.2.1 E-commerce Market Trends Analysis (2020-2032)
11.2.2 E-commerce Market Size Estimates And Forecasts To 2032 (USD Billion)
11.3 Eye Care Professionals
11.3.1 Eye Care Professionals Market Trends Analysis (2020-2032)
11.3.2 Eye Care Professionals Market Size Estimates And Forecasts To 2032 (USD Billion)
11.4 18 Retail
11.4.1 18 Retail Market Trends Analysis (2020-2032)
11.4.2 18 Retail Market Size Estimates And Forecasts To 2032 (USD Billion)
12. Regional Analysis
12.1 Chapter Overview
12.2 North America
12.2.1 Trends Analysis
12.2.2 North America Soft Contact Lenses Market Estimates And Forecasts, By Country (2020-2032) (USD Billion)
12.2.3 North America Soft Contact Lenses Market Estimates And Forecasts, By Material (2020-2032) (USD Billion)
12.2.4 North America Soft Contact Lenses Market Estimates And Forecasts, By Design (2020-2032) (USD Billion)
12.2.5 North America Soft Contact Lenses Market Estimates And Forecasts, By Usage (2020-2032) (USD Billion)
12.2.6 North America Soft Contact Lenses Market Estimates And Forecasts, By Application (2020-2032) (USD Billion)
12.2.7 North America Soft Contact Lenses Market Estimates And Forecasts, By Distribution Channel (2020-2032) (USD Billion)
12.2.8 USA
12.2.8.1 USA Soft Contact Lenses Market Estimates And Forecasts, By Material (2020-2032) (USD Billion)
12.2.8.2 USA Soft Contact Lenses Market Estimates And Forecasts, By Design (2020-2032) (USD Billion)
12.2.8.3 USA Soft Contact Lenses Market Estimates And Forecasts, By Usage (2020-2032) (USD Billion)
12.2.8.4 USA Soft Contact Lenses Market Estimates And Forecasts, By Application(2020-2032) (USD Billion)
12.2.8.5 USA Soft Contact Lenses Market Estimates And Forecasts, By Distribution Channel (2020-2032) (USD Billion)
12.2.9 Canada
12.2.9.1 Canada Soft Contact Lenses Market Estimates And Forecasts, By Material(2020-2032) (USD Billion)
12.2.9.2 Canada Soft Contact Lenses Market Estimates And Forecasts, By Design (2020-2032) (USD Billion)
12.2.9.3 Canada Soft Contact Lenses Market Estimates And Forecasts, By Usage (2020-2032) (USD Billion)
12.2.9.4 Canada Soft Contact Lenses Market Estimates And Forecasts, By Application(2020-2032) (USD Billion)
12.2.9.5 Canada Soft Contact Lenses Market Estimates And Forecasts, By Distribution Channel (2020-2032) (USD Billion)
12.2.10 Mexico
12.2.10.1 Mexico Soft Contact Lenses Market Estimates And Forecasts, By Material(2020-2032) (USD Billion)
12.2.10.2 Mexico Soft Contact Lenses Market Estimates And Forecasts, By Design (2020-2032) (USD Billion)
12.2.10.3 Mexico Soft Contact Lenses Market Estimates And Forecasts, By Usage (2020-2032) (USD Billion)
12.2.10.4 Mexico Soft Contact Lenses Market Estimates And Forecasts, By Application(2020-2032) (USD Billion)
12.2.10.5 Mexico Soft Contact Lenses Market Estimates And Forecasts, By Distribution Channel (2020-2032) (USD Billion)
12.3 Europe
12.3.1 Eastern Europe
12.3.1.1 Trends Analysis
12.3.1.2 Eastern Europe Soft Contact Lenses Market Estimates And Forecasts, By Country (2020-2032) (USD Billion)
12.3.1.3 Eastern Europe Soft Contact Lenses Market Estimates And Forecasts, By Material(2020-2032) (USD Billion)
12.3.1.4 Eastern Europe Soft Contact Lenses Market Estimates And Forecasts, By Design(2020-2032) (USD Billion)
12.3.1.5 Eastern Europe Soft Contact Lenses Market Estimates And Forecasts, By Usage (2020-2032) (USD Billion)
12.3.1.6 Eastern Europe Soft Contact Lenses Market Estimates And Forecasts, By Application(2020-2032) (USD Billion)
12.3.1.7 Eastern Europe Soft Contact Lenses Market Estimates And Forecasts, By Distribution Channel (2020-2032) (USD Billion)
12.3.1.8 Poland
12.3.1.8.1 Poland Soft Contact Lenses Market Estimates And Forecasts, By Material(2020-2032) (USD Billion)
12.3.1.8.2 Poland Soft Contact Lenses Market Estimates And Forecasts, By Design(2020-2032) (USD Billion)
12.3.1.8.3 Poland Soft Contact Lenses Market Estimates And Forecasts, By Usage (2020-2032) (USD Billion)
12.3.1.8.4 Poland Soft Contact Lenses Market Estimates And Forecasts, By Application(2020-2032) (USD Billion)
12.3.1.8.5 Poland Soft Contact Lenses Market Estimates And Forecasts, By Distribution Channel (2020-2032) (USD Billion)
12.3.1.9 Romania
12.3.1.9.1 Romania Soft Contact Lenses Market Estimates And Forecasts, By Material(2020-2032) (USD Billion)
12.3.1.9.2 Romania Soft Contact Lenses Market Estimates And Forecasts, By Design(2020-2032) (USD Billion)
12.3.1.9.3 Romania Soft Contact Lenses Market Estimates And Forecasts, By Usage (2020-2032) (USD Billion)
12.3.1.9.4 Romania Soft Contact Lenses Market Estimates And Forecasts, By Application(2020-2032) (USD Billion)
12.3.1.9.5 Romania Soft Contact Lenses Market Estimates And Forecasts, By Distribution Channel (2020-2032) (USD Billion)
12.3.1.10 Hungary
12.3.1.10.1 Hungary Soft Contact Lenses Market Estimates And Forecasts, By Material(2020-2032) (USD Billion)
12.3.1.10.2 Hungary Soft Contact Lenses Market Estimates And Forecasts, By Design(2020-2032) (USD Billion)
12.3.1.10.3 Hungary Soft Contact Lenses Market Estimates And Forecasts, By Usage (2020-2032) (USD Billion)
12.3.1.10.4 Hungary Soft Contact Lenses Market Estimates And Forecasts, By Application(2020-2032) (USD Billion)
12.3.1.10.5 Hungary Soft Contact Lenses Market Estimates And Forecasts, By Distribution Channel (2020-2032) (USD Billion)
12.3.1.11 Turkey
12.3.1.11.1 Turkey Soft Contact Lenses Market Estimates And Forecasts, By Material(2020-2032) (USD Billion)
12.3.1.11.2 Turkey Soft Contact Lenses Market Estimates And Forecasts, By Design(2020-2032) (USD Billion)
12.3.1.11.3 Turkey Soft Contact Lenses Market Estimates And Forecasts, By Usage (2020-2032) (USD Billion)
12.3.1.11.4 Turkey Soft Contact Lenses Market Estimates And Forecasts, By Application(2020-2032) (USD Billion)
12.3.1.11.5 Turkey Soft Contact Lenses Market Estimates And Forecasts, By Distribution Channel (2020-2032) (USD Billion)
12.3.1.12 Rest Of Eastern Europe
12.3.1.12.1 Rest Of Eastern Europe Soft Contact Lenses Market Estimates And Forecasts, By Material(2020-2032) (USD Billion)
12.3.1.12.2 Rest Of Eastern Europe Soft Contact Lenses Market Estimates And Forecasts, By Design(2020-2032) (USD Billion)
12.3.1.12.3 Rest Of Eastern Europe Soft Contact Lenses Market Estimates And Forecasts, By Usage (2020-2032) (USD Billion)
12.3.1.12.4 Rest Of Eastern Europe Soft Contact Lenses Market Estimates And Forecasts, By Application(2020-2032) (USD Billion)
12.3.1.12.5 Rest Of Eastern Europe Soft Contact Lenses Market Estimates And Forecasts, By Distribution Channel (2020-2032) (USD Billion)
12.3.2 Western Europe
12.3.2.1 Trends Analysis
12.3.2.2 Western Europe Soft Contact Lenses Market Estimates And Forecasts, By Country (2020-2032) (USD Billion)
12.3.2.3 Western Europe Soft Contact Lenses Market Estimates And Forecasts, By Material(2020-2032) (USD Billion)
12.3.2.4 Western Europe Soft Contact Lenses Market Estimates And Forecasts, By Design(2020-2032) (USD Billion)
12.3.2.5 Western Europe Soft Contact Lenses Market Estimates And Forecasts, By Usage (2020-2032) (USD Billion)
12.3.2.6 Western Europe Soft Contact Lenses Market Estimates And Forecasts, By Application(2020-2032) (USD Billion)
12.3.2.7 Western Europe Soft Contact Lenses Market Estimates And Forecasts, By Distribution Channel (2020-2032) (USD Billion)
12.3.2.8 Germany
12.3.2.8.1 Germany Soft Contact Lenses Market Estimates And Forecasts, By Material(2020-2032) (USD Billion)
12.3.2.8.2 Germany Soft Contact Lenses Market Estimates And Forecasts, By Design(2020-2032) (USD Billion)
12.3.2.8.3 Germany Soft Contact Lenses Market Estimates And Forecasts, By Usage (2020-2032) (USD Billion)
12.3.2.8.4 Germany Soft Contact Lenses Market Estimates And Forecasts, By Application(2020-2032) (USD Billion)
12.3.2.8.5 Germany Soft Contact Lenses Market Estimates And Forecasts, By Distribution Channel (2020-2032) (USD Billion)
12.3.2.9 France
12.3.2.9.1 France Soft Contact Lenses Market Estimates And Forecasts, By Material(2020-2032) (USD Billion)
12.3.2.9.2 France Soft Contact Lenses Market Estimates And Forecasts, By Design(2020-2032) (USD Billion)
12.3.2.9.3 France Soft Contact Lenses Market Estimates And Forecasts, By Usage (2020-2032) (USD Billion)
12.3.2.9.4 France Soft Contact Lenses Market Estimates And Forecasts, By Application(2020-2032) (USD Billion)
12.3.2.9.5 France Soft Contact Lenses Market Estimates And Forecasts, By Distribution Channel (2020-2032) (USD Billion)
12.3.2.10 UK
12.3.2.10.1 UK Soft Contact Lenses Market Estimates And Forecasts, By Material(2020-2032) (USD Billion)
12.3.2.10.2 UK Soft Contact Lenses Market Estimates And Forecasts, By Design(2020-2032) (USD Billion)
12.3.2.10.3 UK Soft Contact Lenses Market Estimates And Forecasts, By Usage (2020-2032) (USD Billion)
12.3.2.10.4 UK Soft Contact Lenses Market Estimates And Forecasts, By Application(2020-2032) (USD Billion)
12.3.2.10.5 UK Soft Contact Lenses Market Estimates And Forecasts, By Distribution Channel (2020-2032) (USD Billion)
12.3.2.11 Italy
12.3.2.11.1 Italy Soft Contact Lenses Market Estimates And Forecasts, By Material(2020-2032) (USD Billion)
12.3.2.11.2 Italy Soft Contact Lenses Market Estimates And Forecasts, By Design(2020-2032) (USD Billion)
12.3.2.11.3 Italy Soft Contact Lenses Market Estimates And Forecasts, By Usage (2020-2032) (USD Billion)
12.3.2.11.4 Italy Soft Contact Lenses Market Estimates And Forecasts, By Application(2020-2032) (USD Billion)
12.3.2.11.5 Italy Soft Contact Lenses Market Estimates And Forecasts, By Distribution Channel (2020-2032) (USD Billion)
12.3.2.12 Spain
12.3.2.12.1 Spain Soft Contact Lenses Market Estimates And Forecasts, By Material(2020-2032) (USD Billion)
12.3.2.12.2 Spain Soft Contact Lenses Market Estimates And Forecasts, By Design(2020-2032) (USD Billion)
12.3.2.12.3 Spain Soft Contact Lenses Market Estimates And Forecasts, By Usage (2020-2032) (USD Billion)
12.3.2.12.4 Spain Soft Contact Lenses Market Estimates And Forecasts, By Application(2020-2032) (USD Billion)
12.3.2.12.5 Spain Soft Contact Lenses Market Estimates And Forecasts, By Distribution Channel (2020-2032) (USD Billion)
12.3.2.13 Netherlands
12.3.2.13.1 Netherlands Soft Contact Lenses Market Estimates And Forecasts, By Material (2020-2032) (USD Billion)
12.3.2.13.2 Netherlands Soft Contact Lenses Market Estimates And Forecasts, By Design(2020-2032) (USD Billion)
12.3.2.13.3 Netherlands Soft Contact Lenses Market Estimates And Forecasts, By Usage (2020-2032) (USD Billion)
12.3.2.13.4 Netherlands Soft Contact Lenses Market Estimates And Forecasts, By Application(2020-2032) (USD Billion)
12.3.2.13.5 Netherlands Soft Contact Lenses Market Estimates And Forecasts, By Distribution Channel (2020-2032) (USD Billion)
12.3.2.14 Switzerland
12.3.2.14.1 Switzerland Soft Contact Lenses Market Estimates And Forecasts, By Material (2020-2032) (USD Billion)
12.3.2.14.2 Switzerland Soft Contact Lenses Market Estimates And Forecasts, By Design (2020-2032) (USD Billion)
12.3.2.14.3 Switzerland Soft Contact Lenses Market Estimates And Forecasts, By Usage (2020-2032) (USD Billion)
12.3.2.14.4 Switzerland Soft Contact Lenses Market Estimates And Forecasts, By Application(2020-2032) (USD Billion)
12.3.2.12.5 Switzerland Soft Contact Lenses Market Estimates And Forecasts, By Distribution Channel (2020-2032) (USD Billion)
12.3.2.15 Austria
12.3.2.15.1 Austria Soft Contact Lenses Market Estimates And Forecasts, By Material (2020-2032) (USD Billion)
12.3.2.15.2 Austria Soft Contact Lenses Market Estimates And Forecasts, By Design (2020-2032) (USD Billion)
12.3.2.15.3 Austria Soft Contact Lenses Market Estimates And Forecasts, By Usage (2020-2032) (USD Billion)
12.3.2.15.4 Austria Soft Contact Lenses Market Estimates And Forecasts, By Application(2020-2032) (USD Billion)
12.3.2.15.5 Austria Soft Contact Lenses Market Estimates And Forecasts, By Distribution Channel (2020-2032) (USD Billion)
12.3.2.16 Rest Of Western Europe
12.3.2.16.1 Rest Of Western Europe Soft Contact Lenses Market Estimates And Forecasts, By Material (2020-2032) (USD Billion)
12.3.2.16.2 Rest Of Western Europe Soft Contact Lenses Market Estimates And Forecasts, By Design (2020-2032) (USD Billion)
12.3.2.16.3 Rest Of Western Europe Soft Contact Lenses Market Estimates And Forecasts, By Usage (2020-2032) (USD Billion)
12.3.2.16.4 Rest Of Western Europe Soft Contact Lenses Market Estimates And Forecasts, By Application(2020-2032) (USD Billion)
12.3.2.16.5 Rest Of Western Europe Soft Contact Lenses Market Estimates And Forecasts, By Distribution Channel (2020-2032) (USD Billion)
12.4 Asia Pacific
12.4.1 Trends Analysis
12.4.2 Asia Pacific Soft Contact Lenses Market Estimates And Forecasts, By Country (2020-2032) (USD Billion)
12.4.3 Asia Pacific Soft Contact Lenses Market Estimates And Forecasts, By Material (2020-2032) (USD Billion)
12.4.4 Asia Pacific Soft Contact Lenses Market Estimates And Forecasts, By Design (2020-2032) (USD Billion)
12.4.5 Asia Pacific Soft Contact Lenses Market Estimates And Forecasts, By Usage (2020-2032) (USD Billion)
12.4.6 Asia Pacific Soft Contact Lenses Market Estimates And Forecasts, By Application (2020-2032) (USD Billion)
12.4.7 Asia Pacific Soft Contact Lenses Market Estimates And Forecasts, By Distribution Channel (2020-2032) (USD Billion)
12.4.8 China
12.4.8.1 China Soft Contact Lenses Market Estimates And Forecasts, By Material (2020-2032) (USD Billion)
12.4.8.2 China Soft Contact Lenses Market Estimates And Forecasts, By Design (2020-2032) (USD Billion)
12.4.8.3 China Soft Contact Lenses Market Estimates And Forecasts, By Usage (2020-2032) (USD Billion)
12.4.8.4 China Soft Contact Lenses Market Estimates And Forecasts, By Application (2020-2032) (USD Billion)
12.4.8.5 China Soft Contact Lenses Market Estimates And Forecasts, By Distribution Channel (2020-2032) (USD Billion)
12.4.9 India
12.4.9.1 India Soft Contact Lenses Market Estimates And Forecasts, By Material (2020-2032) (USD Billion)
12.4.9.2 India Soft Contact Lenses Market Estimates And Forecasts, By Design (2020-2032) (USD Billion)
12.4.9.3 India Soft Contact Lenses Market Estimates And Forecasts, By Usage (2020-2032) (USD Billion)
12.4.9.4 India Soft Contact Lenses Market Estimates And Forecasts, By Application (2020-2032) (USD Billion)
12.4.9.5 India Soft Contact Lenses Market Estimates And Forecasts, By Distribution Channel (2020-2032) (USD Billion)
12.4.10 Japan
12.4.10.1 Japan Soft Contact Lenses Market Estimates And Forecasts, By Material (2020-2032) (USD Billion)
12.4.10.2 Japan Soft Contact Lenses Market Estimates And Forecasts, By Design (2020-2032) (USD Billion)
12.4.10.3 Japan Soft Contact Lenses Market Estimates And Forecasts, By Usage (2020-2032) (USD Billion)
12.4.10.4 Japan Soft Contact Lenses Market Estimates And Forecasts, By Application (2020-2032) (USD Billion)
12.4.10.5 Japan Soft Contact Lenses Market Estimates And Forecasts, By Distribution Channel (2020-2032) (USD Billion)
12.4.11 South Korea
12.4.11.1 South Korea Soft Contact Lenses Market Estimates And Forecasts, By Material (2020-2032) (USD Billion)
12.4.11.2 South Korea Soft Contact Lenses Market Estimates And Forecasts, By Design (2020-2032) (USD Billion)
12.4.11.3 South Korea Soft Contact Lenses Market Estimates And Forecasts, By Usage (2020-2032) (USD Billion)
12.4.11.4 South Korea Soft Contact Lenses Market Estimates And Forecasts, By Application(2020-2032) (USD Billion)
12.4.11.5 South Korea Soft Contact Lenses Market Estimates And Forecasts, By Distribution Channel (2020-2032) (USD Billion)
12.4.12 Vietnam
12.4.12.1 Vietnam Soft Contact Lenses Market Estimates And Forecasts, By Material (2020-2032) (USD Billion)
12.4.12.2 Vietnam Soft Contact Lenses Market Estimates And Forecasts, By Design (2020-2032) (USD Billion)
12.4.12.3 Vietnam Soft Contact Lenses Market Estimates And Forecasts, By Usage(2020-2032) (USD Billion)
12.4.12.4 Vietnam Soft Contact Lenses Market Estimates And Forecasts, By Application(2020-2032) (USD Billion)
12.4.12.5 Vietnam Soft Contact Lenses Market Estimates And Forecasts, By Distribution Channel (2020-2032) (USD Billion)
12.4.13 Singapore
12.4.13.1 Singapore Soft Contact Lenses Market Estimates And Forecasts, By Material (2020-2032) (USD Billion)
12.4.13.2 Singapore Soft Contact Lenses Market Estimates And Forecasts, By Design (2020-2032) (USD Billion)
12.4.13.3 Singapore Soft Contact Lenses Market Estimates And Forecasts, By Usage (2020-2032) (USD Billion)
12.4.13.4 Singapore Soft Contact Lenses Market Estimates And Forecasts, By Application(2020-2032) (USD Billion)
12.4.13.5 Singapore Soft Contact Lenses Market Estimates And Forecasts, By Distribution Channel (2020-2032) (USD Billion)
12.4.14 Australia
12.4.14.1 Australia Soft Contact Lenses Market Estimates And Forecasts, By Material (2020-2032) (USD Billion)
12.4.14.2 Australia Soft Contact Lenses Market Estimates And Forecasts, By Design (2020-2032) (USD Billion)
12.4.14.3 Australia Soft Contact Lenses Market Estimates And Forecasts, By Usage(2020-2032) (USD Billion)
12.4.14.4 Australia Soft Contact Lenses Market Estimates And Forecasts, By Application(2020-2032) (USD Billion)
12.4.14.5 Australia Soft Contact Lenses Market Estimates And Forecasts, By Distribution Channel (2020-2032) (USD Billion)
12.4.15 Rest Of Asia Pacific
12.4.15.1 Rest Of Asia Pacific Soft Contact Lenses Market Estimates And Forecasts, By Material (2020-2032) (USD Billion)
12.4.15.2 Rest Of Asia Pacific Soft Contact Lenses Market Estimates And Forecasts, By Design(2020-2032) (USD Billion)
12.4.15.3 Rest Of Asia Pacific Soft Contact Lenses Market Estimates And Forecasts, By Usage (2020-2032) (USD Billion)
12.4.15.4 Rest Of Asia Pacific Soft Contact Lenses Market Estimates And Forecasts, By Application(2020-2032) (USD Billion)
12.4.15.5 Rest Of Asia Pacific Soft Contact Lenses Market Estimates And Forecasts, By Distribution Channel (2020-2032) (USD Billion)
12.5 Middle East And Africa
12.5.1 Middle East
12.5.1.1 Trends Analysis
12.5.1.2 Middle East Soft Contact Lenses Market Estimates And Forecasts, By Country (2020-2032) (USD Billion)
12.5.1.3 Middle East Soft Contact Lenses Market Estimates And Forecasts, By Material (2020-2032) (USD Billion)
12.5.1.4 Middle East Soft Contact Lenses Market Estimates And Forecasts, By Design (2020-2032) (USD Billion)
12.5.1.5 Middle East Soft Contact Lenses Market Estimates And Forecasts, By Usage (2020-2032) (USD Billion)
12.5.1.6 Middle East Soft Contact Lenses Market Estimates And Forecasts, By Application(2020-2032) (USD Billion)
12.5.1.7 Middle East Soft Contact Lenses Market Estimates And Forecasts, By Distribution Channel (2020-2032) (USD Billion)
12.5.1.8 UAE
12.5.1.8.1 UAE Soft Contact Lenses Market Estimates And Forecasts, By Material(2020-2032) (USD Billion)
12.5.1.8.2 UAE Soft Contact Lenses Market Estimates And Forecasts, By Design (2020-2032) (USD Billion)
12.5.1.8.3 UAE Soft Contact Lenses Market Estimates And Forecasts, By Usage (2020-2032) (USD Billion)
12.5.1.8.4 UAE Soft Contact Lenses Market Estimates And Forecasts, By Application(2020-2032) (USD Billion)
12.5.1.8.5 UAE Soft Contact Lenses Market Estimates And Forecasts, By Distribution Channel (2020-2032) (USD Billion)
12.5.1.9 Egypt
12.5.1.9.1 Egypt Soft Contact Lenses Market Estimates And Forecasts, By Material (2020-2032) (USD Billion)
12.5.1.9.2 Egypt Soft Contact Lenses Market Estimates And Forecasts, By Design (2020-2032) (USD Billion)
12.5.1.9.3 Egypt Soft Contact Lenses Market Estimates And Forecasts, By Usage (2020-2032) (USD Billion)
12.5.1.9.4 Egypt Soft Contact Lenses Market Estimates And Forecasts, By Application(2020-2032) (USD Billion)
12.5.1.9.5 Egypt Soft Contact Lenses Market Estimates And Forecasts, By Distribution Channel (2020-2032) (USD Billion)
12.5.1.10 Saudi Arabia
12.5.1.10.1 Saudi Arabia Soft Contact Lenses Market Estimates And Forecasts, By Material (2020-2032) (USD Billion)
12.5.1.10.2 Saudi Arabia Soft Contact Lenses Market Estimates And Forecasts, By Design (2020-2032) (USD Billion)
12.5.1.10.3 Saudi Arabia Soft Contact Lenses Market Estimates And Forecasts, By Usage (2020-2032) (USD Billion)
12.5.1.10.4 Saudi Arabia Soft Contact Lenses Market Estimates And Forecasts, By Application(2020-2032) (USD Billion)
12.5.1.10.5 Saudi Arabia Soft Contact Lenses Market Estimates And Forecasts, By Distribution Channel (2020-2032) (USD Billion)
12.5.1.11 Qatar
12.5.1.11.1 Qatar Soft Contact Lenses Market Estimates And Forecasts, By Material (2020-2032) (USD Billion)
12.5.1.11.2 Qatar Soft Contact Lenses Market Estimates And Forecasts, By Design (2020-2032) (USD Billion)
12.5.1.11.3 Qatar Soft Contact Lenses Market Estimates And Forecasts, By Usage (2020-2032) (USD Billion)
12.5.1.11.4 Qatar Soft Contact Lenses Market Estimates And Forecasts, By Application (2020-2032) (USD Billion)
12.5.1.11.5 Qatar Soft Contact Lenses Market Estimates And Forecasts, By Distribution Channel (2020-2032) (USD Billion)
12.5.1.12 Rest Of Middle East
12.5.1.12.1 Rest Of Middle East Soft Contact Lenses Market Estimates And Forecasts, By Material (2020-2032) (USD Billion)
12.5.1.12.2 Rest Of Middle East Soft Contact Lenses Market Estimates And Forecasts, By Design (2020-2032) (USD Billion)
12.5.1.12.3 Rest Of Middle East Soft Contact Lenses Market Estimates And Forecasts, By Usage (2020-2032) (USD Billion)
12.5.1.12.4 Rest Of Middle East Soft Contact Lenses Market Estimates And Forecasts, By Application(2020-2032) (USD Billion)
12.5.1.12.5 Rest Of Middle East Soft Contact Lenses Market Estimates And Forecasts, By Distribution Channel (2020-2032) (USD Billion)
12.5.2 Africa
12.5.2.1 Trends Analysis
12.5.2.2 Africa Soft Contact Lenses Market Estimates And Forecasts, By Country (2020-2032) (USD Billion)
12.5.2.3 Africa Soft Contact Lenses Market Estimates And Forecasts, By Material (2020-2032) (USD Billion)
12.5.2.4 Africa Soft Contact Lenses Market Estimates And Forecasts, By Design (2020-2032) (USD Billion)
12.5.2.5 Africa Soft Contact Lenses Market Estimates And Forecasts, By Usage (2020-2032) (USD Billion)
12.5.2.6 Africa Soft Contact Lenses Market Estimates And Forecasts, By Application(2020-2032) (USD Billion)
12.5.2.7 Africa Soft Contact Lenses Market Estimates And Forecasts, By Distribution Channel (2020-2032) (USD Billion)
12.5.2.8 South Africa
12.5.2.8.1 South Africa Soft Contact Lenses Market Estimates And Forecasts, By Material (2020-2032) (USD Billion)
12.5.2.8.2 South Africa Soft Contact Lenses Market Estimates And Forecasts, By Design (2020-2032) (USD Billion)
12.5.2.8.3 South Africa Soft Contact Lenses Market Estimates And Forecasts, By Usage (2020-2032) (USD Billion)
12.5.2.8.4 South Africa Soft Contact Lenses Market Estimates And Forecasts, By Application(2020-2032) (USD Billion)
12.5.2.8.5 South Africa Soft Contact Lenses Market Estimates And Forecasts, By Distribution Channel (2020-2032) (USD Billion)
12.5.2.9 Nigeria
12.5.2.9.1 Nigeria Soft Contact Lenses Market Estimates And Forecasts, By Material (2020-2032) (USD Billion)
12.5.2.9.2 Nigeria Soft Contact Lenses Market Estimates And Forecasts, By Design (2020-2032) (USD Billion)
12.5.2.9.3 Nigeria Soft Contact Lenses Market Estimates And Forecasts, By Usage (2020-2032) (USD Billion)
12.5.2.9.4 Nigeria Soft Contact Lenses Market Estimates And Forecasts, By Application (2020-2032) (USD Billion)
12.5.2.9.5 Nigeria Soft Contact Lenses Market Estimates And Forecasts, By Distribution Channel (2020-2032) (USD Billion)
12.5.2.10 Rest Of Africa
12.5.2.10.1 Rest Of Africa Soft Contact Lenses Market Estimates And Forecasts, By Material (2020-2032) (USD Billion)
12.5.2.10.2 Rest Of Africa Soft Contact Lenses Market Estimates And Forecasts, By Design (2020-2032) (USD Billion)
12.5.2.10.3 Rest Of Africa Soft Contact Lenses Market Estimates And Forecasts, By Usage (2020-2032) (USD Billion)
12.5.2.10.4 Rest Of Africa Soft Contact Lenses Market Estimates And Forecasts, By Application(2020-2032) (USD Billion)
12.5.2.10.5 Rest Of Africa Soft Contact Lenses Market Estimates And Forecasts, By Distribution Channel (2020-2032) (USD Billion)
12.6 Latin America
12.6.1 Trends Analysis
12.6.2 Latin America Soft Contact Lenses Market Estimates And Forecasts, By Country (2020-2032) (USD Billion)
12.6.3 Latin America Soft Contact Lenses Market Estimates And Forecasts, By Material (2020-2032) (USD Billion)
12.6.4 Latin America Soft Contact Lenses Market Estimates And Forecasts, By Design (2020-2032) (USD Billion)
12.6.5 Latin America Soft Contact Lenses Market Estimates And Forecasts, By Usage (2020-2032) (USD Billion)
12.6.6 Latin America Soft Contact Lenses Market Estimates And Forecasts, By Application(2020-2032) (USD Billion)
12.6.7 Latin America Soft Contact Lenses Market Estimates And Forecasts, By Distribution Channel (2020-2032) (USD Billion)
12.6.8 Brazil
12.6.8.1 Brazil Soft Contact Lenses Market Estimates And Forecasts, By Material (2020-2032) (USD Billion)
12.6.8.2 Brazil Soft Contact Lenses Market Estimates And Forecasts, By Design (2020-2032) (USD Billion)
12.6.8.3 Brazil Soft Contact Lenses Market Estimates And Forecasts, By Usage (2020-2032) (USD Billion)
12.6.8.4 Brazil Soft Contact Lenses Market Estimates And Forecasts, By Application(2020-2032) (USD Billion)
12.6.8.5 Brazil Soft Contact Lenses Market Estimates And Forecasts, By Distribution Channel (2020-2032) (USD Billion)
12.6.9 Argentina
12.6.9.1 Argentina Soft Contact Lenses Market Estimates And Forecasts, By Material (2020-2032) (USD Billion)
12.6.9.2 Argentina Soft Contact Lenses Market Estimates And Forecasts, By Design (2020-2032) (USD Billion)
12.6.9.3 Argentina Soft Contact Lenses Market Estimates And Forecasts, By Usage (2020-2032) (USD Billion)
12.6.9.4 Argentina Soft Contact Lenses Market Estimates And Forecasts, By Application (2020-2032) (USD Billion)
12.6.9.5 Argentina Soft Contact Lenses Market Estimates And Forecasts, By Distribution Channel (2020-2032) (USD Billion)
12.6.10 Colombia
12.6.10.1 Colombia Soft Contact Lenses Market Estimates And Forecasts, By Material (2020-2032) (USD Billion)
12.6.10.2 Colombia Soft Contact Lenses Market Estimates And Forecasts, By Design (2020-2032) (USD Billion)
12.6.10.3 Colombia Soft Contact Lenses Market Estimates And Forecasts, By Usage (2020-2032) (USD Billion)
12.6.10.4 Colombia Soft Contact Lenses Market Estimates And Forecasts, By Application(2020-2032) (USD Billion)
12.6.10.5 Colombia Soft Contact Lenses Market Estimates And Forecasts, By Distribution Channel (2020-2032) (USD Billion)
12.6.11 Rest Of Latin America
12.6.11.1 Rest Of Latin America Soft Contact Lenses Market Estimates And Forecasts, By Material(2020-2032) (USD Billion)
12.6.11.2 Rest Of Latin America Soft Contact Lenses Market Estimates And Forecasts, By Design (2020-2032) (USD Billion)
12.6.11.3 Rest Of Latin America Soft Contact Lenses Market Estimates And Forecasts, By Usage (2020-2032) (USD Billion)
12.6.11.4 Rest Of Latin America Soft Contact Lenses Market Estimates And Forecasts, By Application(2020-2032) (USD Billion)
12.6.11.5 Rest Of Latin America Soft Contact Lenses Market Estimates And Forecasts, By Distribution Channel (2020-2032) (USD Billion)
13. Company Profiles
13.1 Bausch + Lomb Inc.
13.1.1 Company Overview
13.1.2 Financial
13.1.3 Products/ Services Offered
13.1.4 SWOT Analysis
13.2 Acuvue (Johnson & Johnson)
13.2.1 Company Overview
13.2.2 Financial
13.2.3 Products/ Services Offered
13.2.4 SWOT Analysis
13.3 Alcon Vision LLC
13.3.1 Company Overview
13.3.2 Financial
13.3.3 Products/ Services Offered
13.3.4 SWOT Analysis
13.4 Carl Zeiss AG
13.4.1 Company Overview
13.4.2 Financial
13.4.3 Products/ Services Offered
13.4.4 SWOT Analysis
13.5 CooperVision Inc.
13.5.1 Company Overview
13.5.2 Financial
13.5.3 Products/ Services Offered
13.5.4 SWOT Analysis
13.6 Essilor International
13.6.1 Company Overview
13.6.2 Financial
13.6.3 Products/ Services Offered
13.6.4 SWOT Analysis
13.7 Menicon Co., Ltd.
13.7.1 Company Overview
13.7.2 Financial
13.7.3 Products/ Services Offered
13.7.4 SWOT Analysis
13.8 SEED Co., Ltd.
13.8.1 Company Overview
13.8.2 Financial
13.8.3 Products/ Services Offered
13.8.4 SWOT Analysis
13.9 Contamac Ltd.
13.9.1 Company Overview
13.9.2 Financial
13.9.3 Products/ Services Offered
13.9.4 SWOT Analysis
13.10 Ginko International Co., Ltd.
13.12.1 Company Overview
13.12.2 Financial
13.12.3 Products/ Services Offered
13.12.4 SWOT Analysis
14. Use Cases and Best Practices
15. Conclusion
An accurate research report requires proper strategizing as well as implementation. There are multiple factors involved in the completion of good and accurate research report and selecting the best methodology to compete the research is the toughest part. Since the research reports we provide play a crucial role in any company’s decision-making process, therefore we at SNS Insider always believe that we should choose the best method which gives us results closer to reality. This allows us to reach at a stage wherein we can provide our clients best and accurate investment to output ratio.
Each report that we prepare takes a timeframe of 350-400 business hours for production. Starting from the selection of titles through a couple of in-depth brain storming session to the final QC process before uploading our titles on our website we dedicate around 350 working hours. The titles are selected based on their current market cap and the foreseen CAGR and growth.
The 5 steps process:
Step 1: Secondary Research:
Secondary Research or Desk Research is as the name suggests is a research process wherein, we collect data through the readily available information. In this process we use various paid and unpaid databases which our team has access to and gather data through the same. This includes examining of listed companies’ annual reports, Journals, SEC filling etc. Apart from this our team has access to various associations across the globe across different industries. Lastly, we have exchange relationships with various university as well as individual libraries.

Step 2: Primary Research
When we talk about primary research, it is a type of study in which the researchers collect relevant data samples directly, rather than relying on previously collected data. This type of research is focused on gaining content specific facts that can be sued to solve specific problems. Since the collected data is fresh and first hand therefore it makes the study more accurate and genuine.
We at SNS Insider have divided Primary Research into 2 parts.
Part 1 wherein we interview the KOLs of major players as well as the upcoming ones across various geographic regions. This allows us to have their view over the market scenario and acts as an important tool to come closer to the accurate market numbers. As many as 45 paid and unpaid primary interviews are taken from both the demand and supply side of the industry to make sure we land at an accurate judgement and analysis of the market.
This step involves the triangulation of data wherein our team analyses the interview transcripts, online survey responses and observation of on filed participants. The below mentioned chart should give a better understanding of the part 1 of the primary interview.

Part 2: In this part of primary research the data collected via secondary research and the part 1 of the primary research is validated with the interviews from individual consultants and subject matter experts.
Consultants are those set of people who have at least 12 years of experience and expertise within the industry whereas Subject Matter Experts are those with at least 15 years of experience behind their back within the same space. The data with the help of two main processes i.e., FGDs (Focused Group Discussions) and IDs (Individual Discussions). This gives us a 3rd party nonbiased primary view of the market scenario making it a more dependable one while collation of the data pointers.
Step 3: Data Bank Validation
Once all the information is collected via primary and secondary sources, we run that information for data validation. At our intelligence centre our research heads track a lot of information related to the market which includes the quarterly reports, the daily stock prices, and other relevant information. Our data bank server gets updated every fortnight and that is how the information which we collected using our primary and secondary information is revalidated in real time.

Step 4: QA/QC Process
After all the data collection and validation our team does a final level of quality check and quality assurance to get rid of any unwanted or undesired mistakes. This might include but not limited to getting rid of the any typos, duplication of numbers or missing of any important information. The people involved in this process include technical content writers, research heads and graphics people. Once this process is completed the title gets uploader on our platform for our clients to read it.
Step 5: Final QC/QA Process:
This is the last process and comes when the client has ordered the study. In this process a final QA/QC is done before the study is emailed to the client. Since we believe in giving our clients a good experience of our research studies, therefore, to make sure that we do not lack at our end in any way humanly possible we do a final round of quality check and then dispatch the study to the client.
By Material
Silicone Hydrogel
Hydrogel
By Design
Spherical Lens
Toric Lens
Multifocal Lens
Other Lens
By Usage
Daily Disposable
Disposable
Frequently Disposable
Traditional (Reusable) lenses
By Application
Corrective
Therapeutic
Cosmetic
Prosthetic
Lifestyle-oriented
By Distribution Channel
E-commerce
Eye Care Professionals
Retail
Request for Segment Customization as per your Business Requirement: Segment Customization Request
Regional Coverage:
North America
US
Canada
Mexico
Europe
Eastern Europe
Poland
Romania
Hungary
Turkey
Rest of Eastern Europe
Western Europe
Germany
France
UK
Italy
Spain
Netherlands
Switzerland
Austria
Rest of Western Europe
Asia Pacific
China
India
Japan
South Korea
Vietnam
Singapore
Australia
Rest of Asia Pacific
Middle East & Africa
Middle East
UAE
Egypt
Saudi Arabia
Qatar
Rest of Middle East
Africa
Nigeria
South Africa
Rest of Africa
Latin America
Brazil
Argentina
Colombia
Rest of Latin America
Request for Country Level Research Report: Country Level Customization Request
Available Customization
With the given market data, SNS Insider offers customization as per the company’s specific needs. The following customization options are available for the report:
Detailed Volume Analysis
Criss-Cross segment analysis (e.g. Product X Application)
Competitive Product Benchmarking
Geographic Analysis
Additional countries in any of the regions
Customized Data Representation
Detailed analysis and profiling of additional market players
The Pharmaceutical Contract Manufacturing Market size was USD 161.76 billion in 2023, projected to hit USD 300.34 billion by 2032, growing at 7.15% CAGR.
The Molecular Biology Enzymes, Reagents, and Kits Market was valued at USD 23.01 billion in 2023 and is expected to reach USD 52.78 billion by 2032, growing at a CAGR of 9.68% over the forecast period of 2024-2032.
The Endoscopes Market Size was valued at USD 24.00 Billion in 2023 and is expected to reach USD 36.93 Billion by 2032 and grow at a CAGR of 4.93% over the forecast period 2024-2032.
The Inhalable Drug Delivery Systems Market was valued at USD 2.37 billion in 2023, expected to reach USD 3.81 billion by 2032 growing at a CAGR of 4.95%.
The High Throughput Screening Market Size was valued at USD 25.80 billion in 2023 and is witnessed to reach USD 69.46 Billion by 2032 and grow at a CAGR of 12.18% over the forecast period 2024-2032.
The Wellness Supplements Market was valued at USD 245.41 billion in 2023 and is expected to reach USD 470.93 billion by 2032, growing at a CAGR of 7.51% from 2024 to 2032.

Hi! Click one of our member below to chat on Phone
© 2025 All Rights Reserved by SNS Insider Pvt Ltd


