image

Sodium Nitrate Market Report Scope & Overview

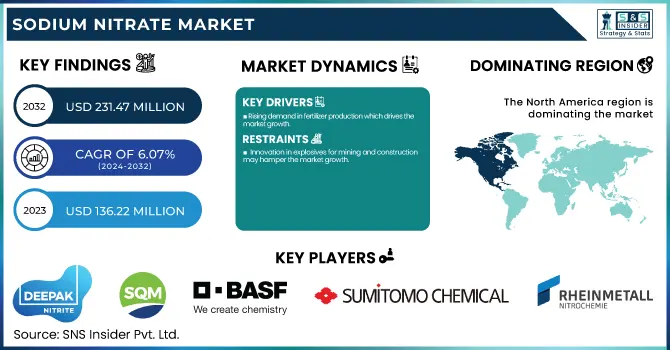
The Sodium Nitrate Market size was USD 136.22 Million in 2023 and is expected to reach USD 231.47 Million by 2032 and grow at a CAGR of 6.07 % over the forecast period of 2024-2032. The sodium nitrate market report provides an in-depth analysis of global production capacity and utilization by country and grade, highlighting key manufacturing hubs. It examines feedstock price fluctuations, their impact on production costs, and regulatory policies and trade restrictions shaping market dynamics. The report also assesses environmental metrics, including emissions, waste management, and sustainability initiatives. Additionally, it explores application demand trends across industries such as fertilizers, explosives, and pharmaceuticals, while tracking innovation and R&D investments in advanced sodium nitrate formulations. This comprehensive study offers valuable data for strategic decision-making.

Market Dynamics

Drivers

  • Rising demand in fertilizer production which drives the market growth.  

One of the most important nitrogen sources in fertilizers is sodium nitrate which is essential to improve soil fertility and crop production. As the world population expands, the need for efficient fertilizers to produce food and guarantee food security has increased dramatically. More, being quick soluble, sodium nitrate is a good source of nitrogen at first, so it is more advantageous for high-value crops such as fruits and vegetables. Its adoption has also been fueled by government initiatives encouraging sustainable agriculture and green fertilizers. The compound also aids in enhancing the metabolism of plants, which guarantees the growth of quicker and healthier crops. In countries with soil depleted of nutrients–which currently includes parts of Africa and Asia–the use of sodium nitrate is rising to help drive productivity from the land. Moreover, controlled-release fertilizer technologies are driving the expansion of sodium nitrate application, allowing for sustainable crop growth and effective nutrient utility without environmental effects.

Restraint

  •   Innovation in explosives for mining and construction may hamper the market growth.

Sodium nitrate has been commonly used for a long time for preserved meats and canned foods to save the meat preserve bacteria growth and prolong shelf life. Still, increasing worries about possible associations with several diseases, including cancer and vascular disease, have brought tougher food safety regulations. With regulatory bodies like the U.S. Food and Drug Administration (FDA) and European Food Safety Authority (EFSA) restricting the limits of nitrates in food, food manufacturers have made a necessity of online purchases of organic and natural preservatives. Moreover, changing trends towards clean-label and nitrate-free food products further decrease the market demand for sodium nitrate in food applications. Hence, the decreasing trend for the usage of sodium nitrate in food preservation is likely to affect the overall sodium nitrate market size and the extent its application is used in other many applications.

Opportunity

  • Increasing adoption of carbon capture, utilization & storage creates an opportunity in the market.  

The explosives sector has historically been a strong driver of sodium nitrate demand, primarily in mining, quarrying, and construction applications. Nevertheless, explosive technology has developed a lot since then, and much safer and more effective explosives have been developed that rely less on sodium nitrate. Emulsion explosives and new-generation AMFO blends are prime examples of modern explosives with superior stability, higher energy content, and environmentally favorable performance characteristics that provide a more competitive alternative to industry. Moreover, the rise in governmental regulations on the handling of hazardous chemicals and explosive materials is making the usage of conventional sodium nitrate-based explosives more difficult. The use of sodium nitrate in the mining and construction industries has been falling as operators turn to establish safer, more affordable, and less tightly regulated alternatives. This change can create a roadblock to market growth, forcing manufacturers to find new applications and industries to sustain demand.

Challenges

  • Raw material price volatility may create a challenge for the market.

Sodium nitrate is a product of key raw materials namely Sodium carbonate (soda ash) & nitric acid, prices of which are consistently fluctuating with the global supply chain balancing challenges, energy prices spike along with the geopolitical challenges. Manufacturing costs for sodium nitrate are significantly affected by rapidly increasing energy prices, especially in places that are heavily reliant on fossil fuels. Moreover, ongoing supply chain issues such as bottlenecks in transportation & bans on trading raw materials may lead to sporadic availability of raw materials, and house pricing for raw materials again. Regulatory policies restricting environmental outcomes in raw material extraction and processing similarly affect chemical production inputs. The uncertainties regarding pricing make it challenging for manufacturers to stick with competitive price points and in turn profit margins and stability in the market. In such cases, the players in sodium nitrate market will have to adopt raw material price volatility mitigation mechanisms like supply chain diversification and low-cost production strategies for their profitability.

 Segmentation Analysis

By Grade

The industrial segment held the largest market share around 55% in 2023. Industrial-grade sodium nitrate is used as a nitrogen source in the fertilizer industry, and the agricultural sector is a prominent driver of the industrial-grade sodium nitrate market. Also, its use as an oxidizing agent in explosives, makes it an in-demand product in mining, quarrying and construction applications, which is another factor driving its dominance in the market. Industrial-grade sodium nitrate is also used in the glass industry for decolorizing and refining during the production of high-quality glass, such as optical and solar glass. In addition, the focus on sewage treatment and industrial effluent management has increased the usage of sodium nitrate in biological treatment processes for its purposes. These factors, coupled with its cost-effectiveness and versatility, have made industrial-grade sodium nitrate the largest segment in the market.

By Application

Fertilizer held the largest market share around 32% in 2023. It is owing to the important functioning of sodium nitrate as a Nitrogen-rich soil nutrient used in agricultural applications. Sodium nitrate is primarily used as a fast-acting nitrogen fertilizer. Sodium nitrate is one of the most commonly used fast-acting nitrogen fertilizers used on crops like fruit, vegetables, and other leafy greens because it provides a readily available source of nitrogen for plant growth. The increasing global need for high-yield crops to meet food security and population growth demands blueprints the requirement for sodium nitrate-based fertilizers. Moreover, growing government initiatives in sustainable agriculture and nitrogen-based fertilizers across the regions including Asia-Pacific and Latin America is also projected to drive the market scenario.

Regional Analysis

North America held the largest market share around 42% in 2023.  Nitrogen-based fertilizers are essential to big agriculture commercial farming in the U.S. and Canada leading to high demand in the region propelling the market. Furthermore, the well-established mining sediment and construction industry increases sodium nitrate consumption in explosives and blasting agents. North American sodium nitrate market also finds its rise in the pharmaceutical sector as it is used in the manufacturing of many medical as well as chemical applications. In addition, stringent environmental regulations have also encouraged increased usage of sodium nitrate in wastewater treatment and industrial effluent management which is further supporting the growth of the market. Due to the support of strong infrastructural development, developed chemical manufacturing facilities, and continued R&D investments, the region accounts for a leading market for sodium nitrate.

Asia Pacific held a significant market share. Growing industrialization, demand from the agriculture sector, and chemical industries industry bounds the Asia Pacific sodium nitrate market significant share. China, India, and Indonesia are some of the largest consumers of sodium nitrate, primarily due to its use in fertilizers, as the large crop production levels and government measures for promoting nitrogen-based fertilizers, tend to compel the demand for sodium nitrate. The sodium nitrate market is also driven by the significant demands in the booming mining and construction industries in the region especially where the global leaders in the mining sector China and Australia are driving the demand for sodium nitrate for use in explosives. Furthermore, the rising specialty glass, pharmaceuticals, and wastewater treatment chemicals are also contributing to the market growth.

Key Players

  • Deepak Nitrite Limited: (Sodium Nitrite, Nitro Toluenes)

  • SQM S.A.: (Potassium Nitrate, Iodine)

  • BASF SE: (Ammonium Nitrate, Nitric Acid)

  • Weifang Haiye Chemistry and Industry Co.: (Sodium Nitrite, Calcium Ammonium Nitrate)

  • Acf Nitratos S.A.: (Sodium Nitrite, Potassium Nitrate)

  • Quality Chemicals S.L.: (Sodium Nitrite, Potassium Nitrate)

  • Shijiazhuang Fengshan Chemical Co. Ltd.: (Sodium Nitrite, Sodium Metabisulfite)

  • Uralchem JSC: (Ammonium Nitrate, Urea)

  • Alfa Aesar: (Sodium Nitrite, Silver Nitrate)

  • American Elements: (Sodium Nitrite, Barium Nitrate)

  • Huaqiang Chemical Group Co. Ltd.: (Sodium Nitrite, Ammonium Chloride)

  • Liuzhou Chemical Industry Co. Ltd.: (Sodium Nitrite, Sodium Sulfate)

  • Rashtriya Chemicals and Fertilizers Ltd.: (Ammonium Nitrate, Urea)

  • Seth Nandram Daulatram Biyani (SNDB): (Sodium Nitrite, Potassium Nitrate)

  • Sinkiang Nitrate Minerals Co. Ltd.: (Sodium Nitrite, Potassium Nitrate)

  • Sumitomo Chemical Co. Ltd.: (Sodium Nitrite, Methionine)

  • Sumitomo Corporation: (Sodium Nitrite, Fertilizers)

  • Nitrochemie: (Sodium Nitrite, Nitrocellulose)

  • Shandong Haihua Group Co., Ltd.: (Sodium Nitrite, Soda Ash)

  • Liuzhou Chemical Industry Co., Ltd.: (Sodium Nitrite, Ammonium Bicarbonate)

Recent Development:

  • In October 2023, SQM proposed a bid of approximately USD 900 million to acquire all remaining shares of Azure Minerals Limited, aiming to strengthen its presence in the lithium industry.

  • In July 2023, NovaAir Technologies unveiled plans to establish a medical and Sodium Nitrate plant in Karnataka, India. The initiative aims to address the rising demand for medical gases in the healthcare sector. This expansion reinforces the company's commitment to enhancing gas supply infrastructure.

  • In 2023, BASF SE increased its sodium nitrite production capacity in Germany to address the rising demand for high-purity applications in the pharmaceutical and food sectors.

Sodium Nitrate Market Report Scope:

Report Attributes Details
Market Size in 2023 USD 136.22 Million
Market Size by 2032 USD 231.47 Million
CAGR CAGR of6.07%  From 2024 to 2032
Base Year 2023
Forecast Period 2024-2032
Historical Data 2020-2022
Report Scope & Coverage Market Size, Segments Analysis, Competitive  Landscape, Regional Analysis, DROC & SWOT Analysis, Forecast Outlook
Key Segments • By Grade (Industrial, Pharmaceutical, Food)
• By Application Chemicals, Fertilizers, Explosives, Glass, Pharmaceuticals, Food & Beverages, Others) 
Regional Analysis/Coverage North America (US, Canada, Mexico), Europe (Eastern Europe [Poland, Romania, Hungary, Turkey, Rest of Eastern Europe] Western Europe] Germany, France, UK, Italy, Spain, Netherlands, Switzerland, Austria, Rest of Western Europe]), Asia Pacific (China, India, Japan, South Korea, Vietnam, Singapore, Australia, Rest of Asia Pacific), Middle East & Africa (Middle East [UAE, Egypt, Saudi Arabia, Qatar, Rest of Middle East], Africa [Nigeria, South Africa, Rest of Africa], Latin America (Brazil, Argentina, Colombia, Rest of Latin America)
Company Profiles Deepak Nitrite Limited, SQM S.A., BASF SE, Weifang Haiye Chemistry and Industry Co., Acf Nitratos S.A., Quality Chemicals S.L., Shijiazhuang Fengshan Chemical Co. Ltd., Uralchem JSC, Alfa Aesar, American Elements, Huaqiang Chemical Group Co. Ltd., Liuzhou Chemical Industry Co. Ltd., Rashtriya Chemicals and Fertilizers Ltd., Seth Nandram Daulatram Biyani (SNDB), Sinkiang Nitrate Minerals Co. Ltd., Sumitomo Chemical Co. Ltd., Sumitomo Corporation, Nitrochemie, Shandong Haihua Group Co., Ltd., Liuzhou Chemical Industry Co., Ltd.

Frequently Asked Questions

Ans: The Sodium Nitrate Market was valued at USD 136.22 Million in 2023.

Ans: The expected CAGR of the global Sodium Nitrate Market during the forecast period is 6.07%

Ans: The Industrial will grow rapidly in the Sodium Nitrate Market from 2024-2032.

Ans:   Rising demand in fertilizer production drives market growth.

Ans: North America led the Sodium Nitrate Market in the region with the highest revenue share in 2023.

Table of Content

1. Introduction

1.1 Market Definition

1.2 Scope (Inclusion and Exclusions)

1.3 Research Assumptions

2. Executive Summary

2.1 Market Overview

2.2 Regional Synopsis

2.3 Competitive Summary

3. Research Methodology

3.1 Top-Down Approach

3.2 Bottom-up Approach

3.3. Data Validation

3.4 Primary Interviews

4. Market Dynamics Impact Analysis

4.1 Market Driving Factors Analysis

4.1.2 Drivers

4.1.2 Restraints

4.1.3 Opportunities

4.1.4 Challenges

4.2 PESTLE Analysis

4.3 Porter’s Five Forces Model

5. Statistical Insights and Trends Reporting

5.1 Production Capacity and Utilization, by Country, By Type, 2023

5.2 Feedstock Prices, by Country, By Type, 2023

5.3 Regulatory Impact, by Country, By Type 2023.

5.4 Environmental Metrics: Emissions Data, Waste Management Practices, and Sustainability Initiatives, by Region

5.5 Innovation and R&D, Type, 2023

6. Competitive Landscape

6.1 List of Major Companies, By Region

6.2 Market Share Analysis, By Region

6.3 Product Benchmarking

6.3.1 Product specifications and features

6.3.2 Pricing

6.4 Strategic Initiatives

6.4.1 Marketing and promotional activities

6.4.2 Distribution and Supply Chain Strategies

6.4.3 Expansion Plans and New Product Launches

6.4.4 Strategic partnerships and collaborations

6.5 Technological Advancements

6.6 Market Positioning and Branding

7. Sodium Nitrate Market Segmentation, By Grade

7.1 Chapter Overview

7.2 Industrial

        7.2.1 Industrial Trends Analysis (2020-2032)

7.2.2 Industrial Market Size Estimates and Forecasts to 2032 (USD Million)

7.3 Pharmaceutical

       7.3.1 Pharmaceutical Market Trends Analysis (2020-2032)

       7.3.2 Pharmaceutical Market Size Estimates and Forecasts to 2032 (USD Million)

7.4 Food

        7.4.1 Food Trends Analysis (2020-2032)

7.4.2 Food Market Size Estimates and Forecasts to 2032 (USD Million)

8. Sodium Nitrate Market Segmentation, by Application

8.1 Chapter Overview

8.2 Chemicals

        8.2.1 Chemicals Market Trends Analysis (2020-2032)

8.2.2 Chemicals Market Size Estimates and Forecasts to 2032 (USD Million)

8.3 Fertilizers

      8.3.1 Fertilizers Market Trends Analysis (2020-2032)

      8.3.2 Fertilizers Market Size Estimates and Forecasts to 2032 (USD Million)

8.4 Explosives

        8.4.1 Explosives Market Trends Analysis (2020-2032)

8.4.2 Explosives Market Size Estimates and Forecasts to 2032 (USD Million)

8.5 Glass

        8.5.1 Glass Market Trends Analysis (2020-2032)

8.5.2 Glass Market Size Estimates and Forecasts to 2032 (USD Million)

8.6 Pharmaceuticals

        8.6.1 Pharmaceuticals Market Trends Analysis (2020-2032)

8.6.2 Pharmaceuticals Market Size Estimates and Forecasts to 2032 (USD Million)

8.7 Food & Beverages

        8.7.1 Food & Beverages Market Trends Analysis (2020-2032)

8.7.2 Food & Beverages Market Size Estimates and Forecasts to 2032 (USD Million)

8.8 Others

        8.8.1 Others Market Trends Analysis (2020-2032)

8.8.2 Others Market Size Estimates and Forecasts to 2032 (USD Million)

9. Regional Analysis

9.1 Chapter Overview

9.2 North America

9.2.1 Trends Analysis

9.2.2 North America Sodium Nitrate Market Estimates and Forecasts, by Country (2020-2032) (USD Million)

9.2.3 North America Sodium Nitrate Market Estimates and Forecasts, By Grade (2020-2032) (USD Million)  

9.2.4 North America Sodium Nitrate Market Estimates and Forecasts, by Application (2020-2032) (USD Million)

9.2.5 USA

9.2.5.1 USA Sodium Nitrate Market Estimates and Forecasts, By Grade (2020-2032) (USD Million)

9.2.5.2 USA Sodium Nitrate Market Estimates and Forecasts, by Application (2020-2032) (USD Million)

9.2.6 Canada

9.2.6.1 Canada Sodium Nitrate Market Estimates and Forecasts, By Grade (2020-2032) (USD Million)

9.2.6.2 Canada Sodium Nitrate Market Estimates and Forecasts, by Application (2020-2032) (USD Million)

9.2.7 Mexico

9.2.7.1 Mexico Sodium Nitrate Market Estimates and Forecasts, By Grade (2020-2032) (USD Million)

9.2.7.2 Mexico Sodium Nitrate Market Estimates and Forecasts, by Application (2020-2032) (USD Million)

9.3 Europe

9.3.1 Eastern Europe

9.3.1.1 Trends Analysis

9.3.1.2 Eastern Europe Sodium Nitrate Market Estimates and Forecasts, by Country (2020-2032) (USD Million)

9.3.1.3 Eastern Europe Sodium Nitrate Market Estimates and Forecasts, By Grade (2020-2032) (USD Million)  

9.3.1.4 Eastern Europe Sodium Nitrate Market Estimates and Forecasts, by Application (2020-2032) (USD Million)

9.3.1.5 Poland

9.3.1.5.1 Poland Sodium Nitrate Market Estimates and Forecasts, By Grade (2020-2032) (USD Million)

9.3.1.5.2 Poland Sodium Nitrate Market Estimates and Forecasts, by Application (2020-2032) (USD Million)

9.3.1.6 Romania

9.3.1.6.1 Romania Sodium Nitrate Market Estimates and Forecasts, By Grade (2020-2032) (USD Million)

9.3.1.6.2 Romania Sodium Nitrate Market Estimates and Forecasts, by Application (2020-2032) (USD Million)

9.3.1.7 Hungary

9.3.1.7.1 Hungary Sodium Nitrate Market Estimates and Forecasts, By Grade (2020-2032) (USD Million)

9.3.1.7.2 Hungary Sodium Nitrate Market Estimates and Forecasts, by Application (2020-2032) (USD Million)

9.3.1.8 Turkey

9.3.1.8.1 Turkey Sodium Nitrate Market Estimates and Forecasts, By Grade (2020-2032) (USD Million)

9.3.1.8.2 Turkey Sodium Nitrate Market Estimates and Forecasts, by Application (2020-2032) (USD Million)

9.3.1.9 Rest of Eastern Europe

9.3.1.9.1 Rest of Eastern Europe Sodium Nitrate Market Estimates and Forecasts, By Grade (2020-2032) (USD Million)

9.3.1.9.2 Rest of Eastern Europe Sodium Nitrate Market Estimates and Forecasts, by Application (2020-2032) (USD Million)

9.3.2 Western Europe

9.3.2.1 Trends Analysis

9.3.2.2 Western Europe Sodium Nitrate Market Estimates and Forecasts, by Country (2020-2032) (USD Million)

9.3.2.3 Western Europe Sodium Nitrate Market Estimates and Forecasts, By Grade (2020-2032) (USD Million)  

9.3.2.4 Western Europe Sodium Nitrate Market Estimates and Forecasts, by Application (2020-2032) (USD Million)

9.3.2.5 Germany

9.3.2.5.1 Germany Sodium Nitrate Market Estimates and Forecasts, By Grade (2020-2032) (USD Million)

9.3.2.5.2 Germany Sodium Nitrate Market Estimates and Forecasts, by Application (2020-2032) (USD Million)

9.3.2.6 France

9.3.2.6.1 France Sodium Nitrate Market Estimates and Forecasts, By Grade (2020-2032) (USD Million)

9.3.2.6.2 France Sodium Nitrate Market Estimates and Forecasts, by Application (2020-2032) (USD Million)

9.3.2.7 UK

9.3.2.7.1 UK Sodium Nitrate Market Estimates and Forecasts, By Grade (2020-2032) (USD Million)

9.3.2.7.2 UK Sodium Nitrate Market Estimates and Forecasts, by Application (2020-2032) (USD Million)

9.3.2.8 Italy

9.3.2.8.1 Italy Sodium Nitrate Market Estimates and Forecasts, By Grade (2020-2032) (USD Million)

9.3.2.8.2 Italy Sodium Nitrate Market Estimates and Forecasts, by Application (2020-2032) (USD Million)

9.3.2.9 Spain

9.3.2.9.1 Spain Sodium Nitrate Market Estimates and Forecasts, By Grade (2020-2032) (USD Million)

9.3.2.9.2 Spain Sodium Nitrate Market Estimates and Forecasts, by Application (2020-2032) (USD Million)

9.3.2.10 Netherlands

9.3.2.10.1 Netherlands Sodium Nitrate Market Estimates and Forecasts, By Grade (2020-2032) (USD Million)

9.3.2.10.2 Netherlands Sodium Nitrate Market Estimates and Forecasts, by Application (2020-2032) (USD Million)

9.3.2.11 Switzerland

9.3.2.11.1 Switzerland Sodium Nitrate Market Estimates and Forecasts, By Grade (2020-2032) (USD Million)

9.3.2.11.2 Switzerland Sodium Nitrate Market Estimates and Forecasts, by Application (2020-2032) (USD Million)

9.3.2.12 Austria

9.3.2.12.1 Austria Sodium Nitrate Market Estimates and Forecasts, By Grade (2020-2032) (USD Million)

9.3.2.12.2 Austria Sodium Nitrate Market Estimates and Forecasts, by Application (2020-2032) (USD Million)

9.3.2.13 Rest of Western Europe

9.3.2.13.1 Rest of Western Europe Sodium Nitrate Market Estimates and Forecasts, By Grade (2020-2032) (USD Million)

9.3.2.13.2 Rest of Western Europe Sodium Nitrate Market Estimates and Forecasts, by Application (2020-2032) (USD Million)

9.4 Asia Pacific

9.4.1 Trends Analysis

9.4.2 Asia Pacific Sodium Nitrate Market Estimates and Forecasts, by Country (2020-2032) (USD Million)

9.4.3 Asia Pacific Sodium Nitrate Market Estimates and Forecasts, By Grade (2020-2032) (USD Million)  

9.4.4 Asia Pacific Sodium Nitrate Market Estimates and Forecasts, by Application (2020-2032) (USD Million)

9.4.5 China

9.4.5.1 China Sodium Nitrate Market Estimates and Forecasts, By Grade (2020-2032) (USD Million)

9.4.5.2 China Sodium Nitrate Market Estimates and Forecasts, by Application (2020-2032) (USD Million)

9.4.6 India

9.4.5.1 India Sodium Nitrate Market Estimates and Forecasts, By Grade (2020-2032) (USD Million)

9.4.5.2 India Sodium Nitrate Market Estimates and Forecasts, by Application (2020-2032) (USD Million)

9.4.5 Japan

9.4.5.1 Japan Sodium Nitrate Market Estimates and Forecasts, By Grade (2020-2032) (USD Million)

9.4.5.2 Japan Sodium Nitrate Market Estimates and Forecasts, by Application (2020-2032) (USD Million)

9.4.6 South Korea

9.4.6.1 South Korea Sodium Nitrate Market Estimates and Forecasts, By Grade (2020-2032) (USD Million)

9.4.6.2 South Korea Sodium Nitrate Market Estimates and Forecasts, by Application (2020-2032) (USD Million)

9.4.7 Vietnam

9.4.7.1 Vietnam Sodium Nitrate Market Estimates and Forecasts, By Grade (2020-2032) (USD Million)

9.2.7.2 Vietnam Sodium Nitrate Market Estimates and Forecasts, by Application (2020-2032) (USD Million)

9.4.8 Singapore

9.4.8.1 Singapore Sodium Nitrate Market Estimates and Forecasts, By Grade (2020-2032) (USD Million)

9.4.8.2 Singapore Sodium Nitrate Market Estimates and Forecasts, by Application (2020-2032) (USD Million)

9.4.9 Australia

9.4.9.1 Australia Sodium Nitrate Market Estimates and Forecasts, By Grade (2020-2032) (USD Million)

9.4.9.2 Australia Sodium Nitrate Market Estimates and Forecasts, by Application (2020-2032) (USD Million)

9.4.10 Rest of Asia Pacific

9.4.10.1 Rest of Asia Pacific Sodium Nitrate Market Estimates and Forecasts, By Grade (2020-2032) (USD Million)

9.4.10.2 Rest of Asia Pacific Sodium Nitrate Market Estimates and Forecasts, by Application (2020-2032) (USD Million)

9.5 Middle East and Africa

9.5.1 Middle East

9.5.1.1 Trends Analysis

9.5.1.2 Middle East Sodium Nitrate Market Estimates and Forecasts, by Country (2020-2032) (USD Million)

9.5.1.3 Middle East Sodium Nitrate Market Estimates and Forecasts, By Grade (2020-2032) (USD Million)  

9.5.1.4 Middle East Sodium Nitrate Market Estimates and Forecasts, by Application (2020-2032) (USD Million)

9.5.1.5 UAE

9.5.1.5.1 UAE Sodium Nitrate Market Estimates and Forecasts, By Grade (2020-2032) (USD Million)

9.5.1.5.2 UAE Sodium Nitrate Market Estimates and Forecasts, by Application (2020-2032) (USD Million)

9.5.1.6 Egypt

9.5.1.6.1 Egypt Sodium Nitrate Market Estimates and Forecasts, By Grade (2020-2032) (USD Million)

9.5.1.6.2 Egypt Sodium Nitrate Market Estimates and Forecasts, by Application (2020-2032) (USD Million)

9.5.1.7 Saudi Arabia

9.5.1.7.1 Saudi Arabia Sodium Nitrate Market Estimates and Forecasts, By Grade (2020-2032) (USD Million)

9.5.1.7.2 Saudi Arabia Sodium Nitrate Market Estimates and Forecasts, by Application (2020-2032) (USD Million)

9.5.1.8 Qatar

9.5.1.8.1 Qatar Sodium Nitrate Market Estimates and Forecasts, By Grade (2020-2032) (USD Million)

9.5.1.8.2 Qatar Sodium Nitrate Market Estimates and Forecasts, by Application (2020-2032) (USD Million)

9.5.1.9 Rest of Middle East

9.5.1.9.1 Rest of Middle East Sodium Nitrate Market Estimates and Forecasts, By Grade (2020-2032) (USD Million)

9.5.1.9.2 Rest of Middle East Sodium Nitrate Market Estimates and Forecasts, by Application (2020-2032) (USD Million)

9.5.2 Africa

9.5.2.1 Trends Analysis

9.5.2.2 Africa Sodium Nitrate Market Estimates and Forecasts, by Country (2020-2032) (USD Million)

9.5.2.3 Africa Sodium Nitrate Market Estimates and Forecasts, By Grade (2020-2032) (USD Million)  

9.5.2.4 Africa Sodium Nitrate Market Estimates and Forecasts, by Application (2020-2032) (USD Million)

9.5.2.5 South Africa

9.5.2.5.1 South Africa Sodium Nitrate Market Estimates and Forecasts, By Grade (2020-2032) (USD Million)

9.5.2.5.2 South Africa Sodium Nitrate Market Estimates and Forecasts, by Application (2020-2032) (USD Million)

9.5.2.6 Nigeria

9.5.2.6.1 Nigeria Sodium Nitrate Market Estimates and Forecasts, By Grade (2020-2032) (USD Million)

9.5.2.6.2 Nigeria Sodium Nitrate Market Estimates and Forecasts, by Application (2020-2032) (USD Million)

9.6 Latin America

9.6.1 Trends Analysis

9.6.2 Latin America Sodium Nitrate Market Estimates and Forecasts, by Country (2020-2032) (USD Million)

9.6.3 Latin America Sodium Nitrate Market Estimates and Forecasts, By Grade (2020-2032) (USD Million)  

9.6.4 Latin America Sodium Nitrate Market Estimates and Forecasts, by Application (2020-2032) (USD Million)

9.6.5 Brazil

9.6.5.1 Brazil Sodium Nitrate Market Estimates and Forecasts, By Grade (2020-2032) (USD Million)

9.6.5.2 Brazil Sodium Nitrate Market Estimates and Forecasts, by Application (2020-2032) (USD Million)

9.6.6 Argentina

9.6.6.1 Argentina Sodium Nitrate Market Estimates and Forecasts, By Grade (2020-2032) (USD Million)

9.6.6.2 Argentina Sodium Nitrate Market Estimates and Forecasts, by Application (2020-2032) (USD Million)

9.6.7 Colombia

9.6.7.1 Colombia Sodium Nitrate Market Estimates and Forecasts, By Grade (2020-2032) (USD Million)

9.6.7.2 Colombia Sodium Nitrate Market Estimates and Forecasts, by Application (2020-2032) (USD Million)

9.6.8 Rest of Latin America

9.6.8.1 Rest of Latin America Sodium Nitrate Market Estimates and Forecasts, By Grade (2020-2032) (USD Million)

9.6.8.2 Rest of Latin America Sodium Nitrate Market Estimates and Forecasts, by Application (2020-2032) (USD Million)

10. Company Profiles

           10.1 Deepak Nitrite Limited

                          10.1.1 Company Overview

10.1.2 Financial

10.1.3 Product / Services Offered

10.1.4 SWOT Analysis

           10.2 SQM S.A.

                           10.2.1 Company Overview

10.2.2 Financial

10.2.3 Product/ Services Offered

10.2.4 SWOT Analysis

10.3 BASF SE

              10.3.1 Company Overview

10.3.2 Financial

10.3.3 Product/ Services Offered

10.3.4 SWOT Analysis

10.4 Weifang Haiye Chemistry and Industry Co.

             10.4.1 Company Overview

10.4.2 Financial

10.4.3 Product/ Services Offered

10.4.4 SWOT Analysis

10.5 Acf Nitratos S.A.

             10.5.1 Company Overview

10.5.2 Financial

10.5.3 Product/ Services Offered

10.5.4 SWOT Analysis

10.6 Quality Chemicals S.L.

             10.6.1 Company Overview

10.6.2 Financial

10.6.3 Product/ Services Offered

10.6.4 SWOT Analysis

10.7 American Elements

             10.7.1 Company Overview

10.7.2 Financial

10.7.3 Product/ Services Offered

10.7.4 SWOT Analysis

10.8 Liuzhou Chemical Industry Co. Ltd.

             10.8.1 Company Overview

10.8.2 Financial

10.8.3 Product/ Services Offered

10.8.4 SWOT Analysis

10.9 Sinkiang Nitrate Minerals Co. Ltd.

             10.9.1 Company Overview

10.9.2 Financial

10.9.3 Product/ Services Offered

10.9.4 SWOT Analysis

10.10 Shandong Haihua Group Co., Ltd.

             10.10.1 Company Overview

10.10.2 Financial

10.10.3 Product/ Services Offered

10.10.4 SWOT Analysis

11. Use Cases and Best Practices

12. Conclusion

An accurate research report requires proper strategizing as well as implementation. There are multiple factors involved in the completion of good and accurate research report and selecting the best methodology to compete the research is the toughest part. Since the research reports we provide play a crucial role in any company’s decision-making process, therefore we at SNS Insider always believe that we should choose the best method which gives us results closer to reality. This allows us to reach at a stage wherein we can provide our clients best and accurate investment to output ratio.

Each report that we prepare takes a timeframe of 350-400 business hours for production. Starting from the selection of titles through a couple of in-depth brain storming session to the final QC process before uploading our titles on our website we dedicate around 350 working hours. The titles are selected based on their current market cap and the foreseen CAGR and growth.


The 5 steps process:

Step 1: Secondary Research:

Secondary Research or Desk Research is as the name suggests is a research process wherein, we collect data through the readily available information. In this process we use various paid and unpaid databases which our team has access to and gather data through the same. This includes examining of listed companies’ annual reports, Journals, SEC filling etc. Apart from this our team has access to various associations across the globe across different industries. Lastly, we have exchange relationships with various university as well as individual libraries.

Secondary Research

Step 2: Primary Research

When we talk about primary research, it is a type of study in which the researchers collect relevant data samples directly, rather than relying on previously collected data.  This type of research is focused on gaining content specific facts that can be sued to solve specific problems. Since the collected data is fresh and first hand therefore it makes the study more accurate and genuine.

We at SNS Insider have divided Primary Research into 2 parts.

Part 1 wherein we interview the KOLs of major players as well as the upcoming ones across various geographic regions. This allows us to have their view over the market scenario and acts as an important tool to come closer to the accurate market numbers. As many as 45 paid and unpaid primary interviews are taken from both the demand and supply side of the industry to make sure we land at an accurate judgement and analysis of the market.

This step involves the triangulation of data wherein our team analyses the interview transcripts, online survey responses and observation of on filed participants. The below mentioned chart should give a better understanding of the part 1 of the primary interview.

Primary Research

Part 2: In this part of primary research the data collected via secondary research and the part 1 of the primary research is validated with the interviews from individual consultants and subject matter experts.

Consultants are those set of people who have at least 12 years of experience and expertise within the industry whereas Subject Matter Experts are those with at least 15 years of experience behind their back within the same space. The data with the help of two main processes i.e., FGDs (Focused Group Discussions) and IDs (Individual Discussions). This gives us a 3rd party nonbiased primary view of the market scenario making it a more dependable one while collation of the data pointers.

Step 3: Data Bank Validation

Once all the information is collected via primary and secondary sources, we run that information for data validation. At our intelligence centre our research heads track a lot of information related to the market which includes the quarterly reports, the daily stock prices, and other relevant information. Our data bank server gets updated every fortnight and that is how the information which we collected using our primary and secondary information is revalidated in real time.

Data Bank Validation

Step 4: QA/QC Process

After all the data collection and validation our team does a final level of quality check and quality assurance to get rid of any unwanted or undesired mistakes. This might include but not limited to getting rid of the any typos, duplication of numbers or missing of any important information. The people involved in this process include technical content writers, research heads and graphics people. Once this process is completed the title gets uploader on our platform for our clients to read it.

Step 5: Final QC/QA Process:

This is the last process and comes when the client has ordered the study. In this process a final QA/QC is done before the study is emailed to the client. Since we believe in giving our clients a good experience of our research studies, therefore, to make sure that we do not lack at our end in any way humanly possible we do a final round of quality check and then dispatch the study to the client.

Key Segments:

By Grade

  • Industrial

  • Pharmaceutical

  • Food

By Application

  • Chemicals

  • Fertilizers

  • Explosives

  • Glass

  • Pharmaceuticals

  • Food & Beverages

  • Others

Request for Segment Customization as per your Business Requirement: Segment Customization Request

Regional Coverage:

North America

  • US

  • Canada

  • Mexico

Europe

  • Eastern Europe

    • Poland

    • Romania

    • Hungary

    • Turkey

    • Rest of Eastern Europe

  • Western Europe

    • Germany

    • France

    • UK

    • Italy

    • Spain

    • Netherlands

    • Switzerland

    • Austria

    • Rest of Western Europe

Asia Pacific

  • China

  • India

  • Japan

  • South Korea

  • Vietnam

  • Singapore

  • Australia

  • Rest of Asia Pacific

Middle East & Africa

  • Middle East

    • UAE

    • Egypt

    • Saudi Arabia

    • Qatar

    • Rest of Middle East

  • Africa

    • Nigeria

    • South Africa

    • Rest of Africa

Latin America

  • Brazil

  • Argentina

  • Colombia

  • Rest of Latin America

Request for Country Level Research Report: Country Level Customization Request

Available Customization

With the given market data, SNS Insider offers customization as per the company’s specific needs. The following customization options are available for the report:

  • Detailed Volume Analysis

  • Criss-Cross segment analysis (e.g. Product X Application)

  • Competitive Product Benchmarking

  • Geographic Analysis

  • Additional countries in any of the regions

  • Customized Data Representation

  • Detailed analysis and profiling of additional market players


  •            5000 (33% Discount)


  •            8950 (40% Discount)


  •            3050 (23% Discount)

Start a Conversation

Hi! Click one of our member below to chat on Phone