image

Social Gaming Market Report Scope & Overview:

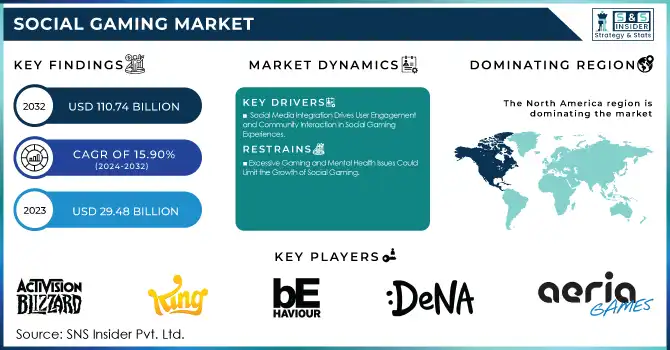
The Social Gaming Market was valued at USD 29.48 billion in 2023 and is expected to reach USD 110.74 billion by 2032, growing at a CAGR of 15.90% from 2024-2032.

Social Gaming Market Revenue Analysis

To Get More Information on Social Gaming Market - Request Sample Report

The social gaming market has experienced significant growth in recent years, fueled by the rising popularity of mobile gaming, online communities, and the incorporation of social media elements in games. With an increasing number of consumers desiring interactive and immersive experiences, the need for games that provide social interaction—like multiplayer modes, virtual economies, and social networking features—has skyrocketed. Sites such as Facebook, Instagram, and Discord have played a role in this trend, enabling gamers to share experiences, connect with friends, and even compete in online communities. The convenience offered by smartphones and tablets has integrated social gaming into daily entertainment for a wide range of users, from casual gamers to more serious ones. Indeed, by 2023, more than 2.8 billion individuals across the globe are engaged gamers, with a significant portion taking part in multiplayer online games. EA’s new social application for iOS and Android, centered on global football, highlights the increasing need for engaging, social gaming experiences.

Looking ahead, the interest in social gaming is anticipated to maintain its upward trend. With advancements in technology like augmented reality, virtual reality, and cloud gaming, developers have fresh opportunities to further improve social gaming experiences. These advancements offer even more engaging environments where players can engage in real-time, crafting virtual realms that integrate smoothly with the real world. In the United States, around 58.9 million individuals are anticipated to engage with VR at least once per month in 2023, underscoring the increasing incorporation of immersive technologies. Moreover, the growth of esports and live-streaming services such as Twitch and YouTube Gaming has sparked enthusiasm for competitive social gaming, transforming it into a desirable sector for investment and growth.

Future opportunities in the social gaming market will probably surround expansion of monetization strategies and improvement of user engagement. Revenue will continue to be influenced by microtransactions, in-game purchases, and subscription models. Other potential integration might be in deeper virtual goods and digital currencies for further improvement in the social gaming experience in allowing players to have more customizations and control over their virtual assets. In November 2024, Etermax launched Trivia Crack World on Meta Quest VR, providing a fully immersive trivia experience in a virtual amusement park, further indicating the growing adoption of VR in social gaming. Along with this maturation, cross-platform experiences where players can connect across different devices and gaming ecosystems will also start to gain greater importance.

Market Dynamics

Drivers

  • Social Media Integration Drives User Engagement and Community Interaction in Social Gaming Experiences

The smooth incorporation of social media platforms into games has transformed how players engage, share, and compete within virtual spaces. By linking social gaming experiences to platforms such as Facebook, Twitter, and Instagram, players can effortlessly share their accomplishments, invite friends, or participate in real-time contests. This connection not only amplifies the enjoyment and competitive spirit of games but also fosters a sense of community, allowing players to cooperate, build teams, or compete against one another. Social elements, like leaderboards, gifting, and event invites, enhance user engagement and retention even more. As games develop to incorporate these social aspects, they grow increasingly captivating, drawing in a wider, more interconnected audience. The integration provides players with a lively, social environment that goes beyond the game, encouraging them to return repeatedly.

  • The Rise of Esports Fuels the Growth of Social Gaming Through Competitive Play and Live Streaming

Esports has emerged as a significant driver in the social gaming arena, merging competitive gameplay with a dynamic community aspect. Numerous games are currently created with esports consideration, providing structured competitions, live broadcasts, and chances for players to connect with worldwide viewers. The attraction of viewing professional athletes and teams battle in live streams on platforms such as Twitch, YouTube, and Facebook has propelled esports into mainstream popularity. These occasions frequently involve social engagement among fans, thereby strengthening the community feeling associated with gaming. The growth of esports enhances the appeal of competitive gaming and encourages players to participate, creating teams and engaging in ranked competitions. With the rising popularity of esports, an environment is formed where social gaming flourishes through collaboration, competition, and real-time content engagement.

Restraints

  • Excessive Gaming and Mental Health Issues Could Limit the Growth of Social Gaming

The possibility of addiction and mental health problems from excessive gaming has increasingly raised concerns among both gamers and authorities. Social gaming, characterized by its interactive multiplayer experiences and ongoing engagement, may cause certain individuals to devote excessive time online, adversely affecting their well-being. This has caused concern among parents, healthcare experts, and gaming groups, leading to demands for stricter regulations. The need to remain competitive or maintain connections with friends in social games can lead players to overlook their physical health, relationships, and other obligations. With growing awareness of mental health issues related to gaming addiction, regulatory agencies might enforce limits on playtime, in-game purchases, or age suitability, potentially impacting the growth of the social gaming industry. This matter emphasizes the importance of a balanced strategy to guarantee player safety and welfare.

Segment Analysis

By Game Type

The Casual Games segment dominated the Social Gaming Market in 2023, capturing the highest revenue share of approximately 45%. This dominance can be attributed to the broad appeal and accessibility of casual games, which require minimal time investment and are easy to understand. Their simple gameplay mechanics, combined with engaging social features like multiplayer modes and in-game rewards, attract a wide range of players across various age groups. Additionally, the rise of mobile gaming has made these games highly accessible, further driving their popularity.

The Strategy Games segment is expected to grow at the fastest compound annual growth rate of 18.95% from 2024 to 2032. This growth is driven by an increasing demand for more complex and engaging gaming experiences that challenge players’ cognitive skills. With the rise of competitive esports and the social nature of strategy games, which often involve team-based play and real-time decision-making, more players are drawn to these games. As gaming communities become more interconnected, the strategic depth and social interaction in these games are becoming key drivers for their expanding popularity.

By Platform

The Mobile Devices segment, encompassing smartphones and tablets, dominated the Social Gaming Market in 2023, accounting for approximately 62% of the total revenue share. This dominance is primarily due to the widespread adoption of mobile devices, which provide users with convenient, on-the-go access to a vast array of social games. Mobile games are often free-to-play with in-app purchases, further lowering the barrier for entry and attracting a broad, diverse audience. Additionally, the growing availability of high-speed internet and app stores makes it easier for players to discover and engage with new games.

The Consoles segment is expected to grow at the fastest compound annual growth rate of 18.53% from 2024 to 2032. This surge can be attributed to the increasing popularity of high-performance gaming consoles, which offer enhanced graphics, immersive experiences, and exclusive game titles. As gaming communities and social interactions continue to expand, consoles provide a more robust platform for multiplayer games, fostering stronger social connections and competitive play. The growing integration of online gaming services and cloud-based gaming options is also expected to boost the growth of this segment, attracting both new and seasoned gamers.

By Revenue Model

The Virtual Goods segment dominated the Social Gaming Market in 2023, capturing the largest revenue share of approximately 37%. This dominance is largely due to the growing popularity of in-game purchases, where players spend real money on digital items such as skins, costumes, and upgrades. Virtual goods enhance the gaming experience by allowing for personalization and progression, which significantly boosts player engagement. Additionally, the rise of free-to-play models with microtransactions has made virtual goods a key revenue driver, as players are increasingly willing to invest in enhancing their in-game experience.

The Advertisements segment is expected to grow at the fastest compound annual growth rate of 18.14% from 2024 to 2032. This growth is driven by the increasing integration of in-game advertisements, which offer a non-intrusive method for brands to reach large audiences. As more players engage in mobile and social games, advertising opportunities within these games such as video ads, banners, and sponsored content—have become more lucrative for developers. The expansion of programmatic advertising and targeted marketing based on player behavior is further accelerating this segment's growth, making it a key revenue stream for the gaming industry.

Regional Analysis

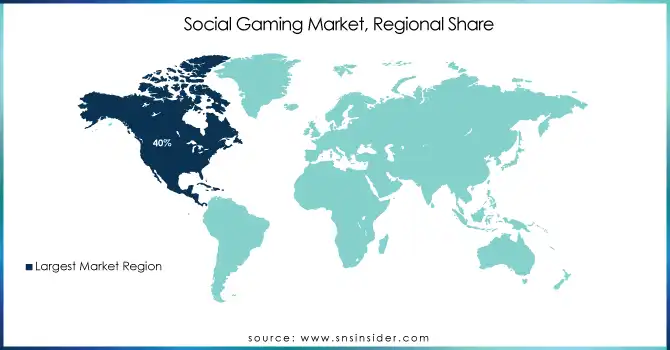
North America dominated the Social Gaming Market in 2023, holding the largest revenue share of approximately 40%. This dominance is attributed to the region’s high internet penetration, widespread use of mobile devices, and established gaming infrastructure. Additionally, North America is home to many leading game developers and publishers, which further contributes to its market leadership. The region's strong focus on technological advancements and the adoption of new gaming trends, such as augmented reality and virtual reality, also significantly bolstered its position in the market.

Asia Pacific is expected to grow at the fastest compound annual growth rate of 17.25% from 2024 to 2032. This rapid growth is driven by the region’s large, tech-savvy population and increasing access to mobile gaming platforms. With countries like China, India, and Japan leading the way, the growing interest in mobile gaming, coupled with expanding internet connectivity and digital payment systems, fosters a dynamic gaming environment. Moreover, the region’s cultural affinity for gaming and the rising popularity of esports contribute to its impressive growth potential, positioning Asia Pacific as a key driver in the future of social gaming.

Social-Gaming-Market-Regional-Share

Do You Need any Customization Research on Social Gaming Market - Enquire Now

 Key Players

  • Aeria Games GmbH (Grand Fantasia, Aura Kingdom)

  • Activision Blizzard, Inc. (Call of Duty, World of Warcraft)

  • King Digital Entertainment plc (Candy Crush Saga, Bubble Witch Saga)

  • Behaviour Interactive, Inc. (Dead by Daylight, Friday the 13th: The Game)

  • DeNA Co., Ltd. (Final Fantasy Record Keeper, MARVEL: Mighty Heroes)

  • Electronic Arts, Inc. (The Sims, FIFA)

  • PopCap Games, Inc. (Bejeweled, Plants vs. Zombies)

  • Etermax (Trivia Crack, Apalabrados)

  • GREE, Inc. (Monster Strike, Dragon Collection)

  • Miniclip SA (8 Ball Pool, Agar.io)

  • Peak Games (Toon Blast, Toy Blast)

  • Playtech plc (Age of the Gods, Gladiator Jackpot)

  • Pretty Simple (The Crimes of the Century, Criminal Case)

  • Social Point (Dragon City, Monster Legends)

  • Supercell (Clash of Clans, Brawl Stars)

  • SYBO Games (Subway Surfers, Subway Surfers Tag)

  • Wooga GmbH (June's Journey, Pearl's Peril)

  • Zynga, Inc. (FarmVille, Words With Friends)

Recent Developments:

  • In 2024, former Supercell and King developers launched Antihero Studios, aiming to create socially engaging multiplayer games that inspire players, with a focus on organic growth and brand loyalty. The studio seeks to disrupt mobile gaming by focusing on games worth sharing, targeting Gen Z players.

  • In September 2024, Behaviour Interactive acquired Red Hook Studios, the creators of the acclaimed horror RPG Darkest Dungeon. This move follows their earlier acquisitions in 2023 of Codeglue and SockMonkey Studios. The acquisitions reflect Behaviour’s strategy to expand its portfolio in PC and mobile gaming.

Social Gaming Market Report Scope:

Report Attributes Details
Market Size in 2023 USD 29.48 Billion
Market Size by 2032 USD 110.74 Billion
CAGR CAGR of 15.90% From 2024 to 2032
Base Year 2023
Forecast Period 2024-2032
Historical Data 2020-2022
Report Scope & Coverage Market Size, Segments Analysis, Competitive  Landscape, Regional Analysis, DROC & SWOT Analysis, Forecast Outlook
Key Segments • By Game Type (Casual Games, Strategy Games, Simulation Games, Role-Playing Games (RPGs), Other Game Types)
• By Platform (Mobile Devices, PCs/Laptops, Consoles)
• By Revenue Model (Advertisements, Virtual Goods, Lead Generation, Subscription Services, In-App Purchases)
• By Age Group (13 to 18 Years, 19 to 25 Years, 26 to 35 Years, Above 35 Years)
Regional Analysis/Coverage North America (US, Canada, Mexico), Europe (Eastern Europe [Poland, Romania, Hungary, Turkey, Rest of Eastern Europe] Western Europe] Germany, France, UK, Italy, Spain, Netherlands, Switzerland, Austria, Rest of Western Europe]), Asia Pacific (China, India, Japan, South Korea, Vietnam, Singapore, Australia, Rest of Asia Pacific), Middle East & Africa (Middle East [UAE, Egypt, Saudi Arabia, Qatar, Rest of Middle East], Africa [Nigeria, South Africa, Rest of Africa], Latin America (Brazil, Argentina, Colombia, Rest of Latin America)
Company Profiles Aeria Games GmbH, Activision Blizzard, Inc., King Digital Entertainment plc, Behaviour Interactive, Inc., DeNA Co., Ltd., Electronic Arts, Inc., PopCap Games, Inc., Etermax, GREE, Inc., Miniclip SA, Peak Games, Playtech plc, Pretty Simple, Social Point, Supercell, SYBO Games, Wooga GmbH, Zynga, Inc.
Key Drivers • Social Media Integration Drives User Engagement and Community Interaction in Social Gaming Experiences
• The Rise of Esports Fuels the Growth of Social Gaming Through Competitive Play and Live Streaming
RESTRAINTS • Excessive Gaming and Mental Health Issues Could Limit the Growth of Social Gaming


Frequently Asked Questions

Ans. Social Gaming Market was valued at USD 29.48 billion in 2023 and is expected to reach USD 110.74 billion by 2032, growing at a CAGR of 15.90% from 2024-2032.

Ans: Casual games captured the highest revenue share in 2023, at approximately 45%, due to their broad appeal and accessibility.

Ans: Mobile devices, including smartphones and tablets, dominated with 62% of the total revenue share in 2023.

Ans. Asia Pacific is expected to grow at a CAGR of 17.25% from 2024 to 2032, driven by mobile gaming growth and esports popularity.

Ans.Social media integration, esports, mobile gaming, and the rise of in-game purchases are key drivers fueling market expansion.

Table of Contents

1. Introduction

1.1 Market Definition

1.2 Scope (Inclusion and Exclusions)

1.3 Research Assumptions

2. Executive Summary

2.1 Market Overview

2.2 Regional Synopsis

2.3 Competitive Summary

3. Research Methodology

3.1 Top-Down Approach

3.2 Bottom-up Approach

3.3. Data Validation

3.4 Primary Interviews

4. Market Dynamics Impact Analysis

4.1 Market Driving Factors Analysis

4.1.1 Drivers

4.1.2 Restraints

4.2 PESTLE Analysis

4.3 Porter’s Five Forces Model

5. Statistical Insights and Trends Reporting

5.1 Adoption Rates of Emerging Technologies

5.2 Player Engagement Metrics

5.3 User Demographics

5.4 Game Type Popularity

6. Competitive Landscape

6.1 List of Major Companies, By Region

6.2 Market Share Analysis, By Region

6.3 Product Benchmarking

6.3.1 Product specifications and features

6.3.2 Pricing

6.4 Strategic Initiatives

6.4.1 Marketing and promotional activities

6.4.2 Distribution and supply chain strategies

6.4.3 Expansion plans and new product launches

6.4.4 Strategic partnerships and collaborations

6.5 Technological Advancements

6.6 Market Positioning and Branding

7. Social Gaming Market Segmentation, By Game Type

7.1 Chapter Overview

7.2 Casual Games

7.2.1 Casual Games Market Trends Analysis (2020-2032)

7.2.2 Casual Games Market Size Estimates and Forecasts to 2032 (USD Billion)

7.3 Strategy Games

7.3.1 Strategy Games Market Trends Analysis (2020-2032)

7.3.2 Strategy Games Market Size Estimates and Forecasts to 2032 (USD Billion)

7.4 Simulation Games

7.4.1 Simulation Games Market Trends Analysis (2020-2032)

7.4.2 Simulation Games Market Size Estimates and Forecasts to 2032 (USD Billion)

7.5 Role-Playing Games (RPGs)

7.5.1 Role-Playing Games (RPGs) Market Trends Analysis (2020-2032)

7.5.2 Role-Playing Games (RPGs) Market Size Estimates and Forecasts to 2032 (USD Billion)

7.6 Other Game Types

7.6.1 Other Game Types Market Trends Analysis (2020-2032)

7.6.2 Other Game Types Market Size Estimates and Forecasts to 2032 (USD Billion)

8. Social Gaming Market Segmentation, By Platform

8.1 Chapter Overview

8.2 Mobile Devices (Smartphones, Tablets)

8.2.1 Mobile Devices (Smartphones, Tablets) Market Trends Analysis (2020-2032)

8.2.2 Mobile Devices (Smartphones, Tablets) Market Size Estimates and Forecasts to 2032 (USD Billion)

8.3 PCs/Laptops

8.3.1 PCs/Laptops Market Trends Analysis (2020-2032)

8.3.2 PCs/Laptops Market Size Estimates and Forecasts to 2032 (USD Billion)

8.4 Consoles

8.4.1 Consoles Market Trends Analysis (2020-2032)

8.4.2 Consoles Market Size Estimates and Forecasts to 2032 (USD Billion)

9. Social Gaming Market Segmentation, By Revenue Model

9.1 Chapter Overview

9.2 Advertisements

9.2.1 Advertisements Market Trends Analysis (2020-2032)

9.2.2 Advertisements Market Size Estimates and Forecasts to 2032 (USD Billion)

9.3 Virtual Goods

9.3.1 Virtual Goods Market Trends Analysis (2020-2032)

9.3.2 Virtual Goods Market Size Estimates and Forecasts to 2032 (USD Billion)

9.4 Lead Generation

               9.4.1 Lead Generation Market Trends Analysis (2020-2032)

9.4.2 Lead Generation Market Size Estimates and Forecasts to 2032 (USD Billion)

9.5 Subscription Services

9.5.1 Subscription Services Market Trends Analysis (2020-2032)

9.5.2 Subscription Services Market Size Estimates and Forecasts to 2032 (USD Billion)

9.6 In-App Purchases

9.6.1 In-App Purchases Market Trends Analysis (2020-2032)

9.6.2 In-App Purchases Market Size Estimates and Forecasts to 2032 (USD Billion)

10. Social Gaming Market Segmentation, By Age Group

10.1 Chapter Overview

10.2 13 to 18 Years

10.2.1 13 to 18 Years Market Trends Analysis (2020-2032)

10.2.2 13 to 18 Years Market Size Estimates and Forecasts to 2032 (USD Billion)

10.3 19 to 25 Years

10.3.1 19 to 25 Years Market Trends Analysis (2020-2032)

10.3.2 19 to 25 Years Market Size Estimates and Forecasts to 2032 (USD Billion)

10.4 26 to 35 Years

               10.4.1 26 to 35 Years Market Trends Analysis (2020-2032)

10.4.2 26 to 35 Years Market Size Estimates and Forecasts to 2032 (USD Billion)

10.5 Above 35 Years

10.5.1 Above 35 Years Market Trends Analysis (2020-2032)

10.5.2 Above 35 Years Market Size Estimates and Forecasts to 2032 (USD Billion)

11. Regional Analysis

11.1 Chapter Overview

11.2 North America

11.2.1 Trends Analysis

11.2.2 North America Social Gaming Market Estimates and Forecasts, by Country (2020-2032) (USD Billion)

11.2.3 North America Social Gaming Market Estimates and Forecasts, By Game Type (2020-2032) (USD Billion) 

11.2.4 North America Social Gaming Market Estimates and Forecasts, By Platform (2020-2032) (USD Billion)

11.2.5 North America Social Gaming Market Estimates and Forecasts, By Revenue Model (2020-2032) (USD Billion)

11.2.6 North America Social Gaming Market Estimates and Forecasts, By Age Group (2020-2032) (USD Billion)

11.2.7 USA

11.2.7.1 USA Social Gaming Market Estimates and Forecasts, By Game Type (2020-2032) (USD Billion)

11.2.7.2 USA Social Gaming Market Estimates and Forecasts, By Platform (2020-2032) (USD Billion)

11.2.7.3 USA Social Gaming Market Estimates and Forecasts, By Revenue Model (2020-2032) (USD Billion)

11.2.7.4 USA Social Gaming Market Estimates and Forecasts, By Age Group (2020-2032) (USD Billion)

11.2.8 Canada

11.2.8.1 Canada Social Gaming Market Estimates and Forecasts, By Game Type (2020-2032) (USD Billion)

11.2.8.2 Canada Social Gaming Market Estimates and Forecasts, By Platform (2020-2032) (USD Billion)

11.2.8.3 Canada Social Gaming Market Estimates and Forecasts, By Revenue Model (2020-2032) (USD Billion)

11.2.8.4 Canada Social Gaming Market Estimates and Forecasts, By Age Group (2020-2032) (USD Billion)

11.2.9 Mexico

11.2.9.1 Mexico Social Gaming Market Estimates and Forecasts, By Game Type (2020-2032) (USD Billion)

11.2.9.2 Mexico Social Gaming Market Estimates and Forecasts, By Platform (2020-2032) (USD Billion)

11.2.9.3 Mexico Social Gaming Market Estimates and Forecasts, By Revenue Model (2020-2032) (USD Billion)

11.2.9.4 Mexico Social Gaming Market Estimates and Forecasts, By Age Group (2020-2032) (USD Billion)

11.3 Europe

11.3.1 Eastern Europe

11.3.1.1 Trends Analysis

11.3.1.2 Eastern Europe Social Gaming Market Estimates and Forecasts, by Country (2020-2032) (USD Billion)

11.3.1.3 Eastern Europe Social Gaming Market Estimates and Forecasts, By Game Type (2020-2032) (USD Billion) 

11.3.1.4 Eastern Europe Social Gaming Market Estimates and Forecasts, By Platform (2020-2032) (USD Billion)

11.3.1.5 Eastern Europe Social Gaming Market Estimates and Forecasts, By Revenue Model (2020-2032) (USD Billion)

11.3.1.6 Eastern Europe Social Gaming Market Estimates and Forecasts, By Age Group (2020-2032) (USD Billion)

11.3.1.7 Poland

11.3.1.7.1 Poland Social Gaming Market Estimates and Forecasts, By Game Type (2020-2032) (USD Billion)

11.3.1.7.2 Poland Social Gaming Market Estimates and Forecasts, By Platform (2020-2032) (USD Billion)

11.3.1.7.3 Poland Social Gaming Market Estimates and Forecasts, By Revenue Model (2020-2032) (USD Billion)

11.3.1.7.4 Poland Social Gaming Market Estimates and Forecasts, By Age Group (2020-2032) (USD Billion)

11.3.1.8 Romania

11.3.1.8.1 Romania Social Gaming Market Estimates and Forecasts, By Game Type (2020-2032) (USD Billion)

11.3.1.8.2 Romania Social Gaming Market Estimates and Forecasts, By Platform (2020-2032) (USD Billion)

11.3.1.8.3 Romania Social Gaming Market Estimates and Forecasts, By Revenue Model (2020-2032) (USD Billion)

11.3.1.8.4 Romania Social Gaming Market Estimates and Forecasts, By Age Group (2020-2032) (USD Billion)

11.3.1.9 Hungary

11.3.1.9.1 Hungary Social Gaming Market Estimates and Forecasts, By Game Type (2020-2032) (USD Billion)

11.3.1.9.2 Hungary Social Gaming Market Estimates and Forecasts, By Platform (2020-2032) (USD Billion)

11.3.1.9.3 Hungary Social Gaming Market Estimates and Forecasts, By Revenue Model (2020-2032) (USD Billion)

11.3.1.9.4 Hungary Social Gaming Market Estimates and Forecasts, By Age Group (2020-2032) (USD Billion)

11.3.1.10 Turkey

11.3.1.10.1 Turkey Social Gaming Market Estimates and Forecasts, By Game Type (2020-2032) (USD Billion)

11.3.1.10.2 Turkey Social Gaming Market Estimates and Forecasts, By Platform (2020-2032) (USD Billion)

11.3.1.10.3 Turkey Social Gaming Market Estimates and Forecasts, By Revenue Model (2020-2032) (USD Billion)

11.3.1.10.4 Turkey Social Gaming Market Estimates and Forecasts, By Age Group (2020-2032) (USD Billion)

11.3.1.11 Rest of Eastern Europe

11.3.1.11.1 Rest of Eastern Europe Social Gaming Market Estimates and Forecasts, By Game Type (2020-2032) (USD Billion)

11.3.1.11.2 Rest of Eastern Europe Social Gaming Market Estimates and Forecasts, By Platform (2020-2032) (USD Billion)

11.3.1.11.3 Rest of Eastern Europe Social Gaming Market Estimates and Forecasts, By Revenue Model (2020-2032) (USD Billion)

11.3.1.11.4 Rest of Eastern Europe Social Gaming Market Estimates and Forecasts, By Age Group (2020-2032) (USD Billion)

11.3.2 Western Europe

11.3.2.1 Trends Analysis

11.3.2.2 Western Europe Social Gaming Market Estimates and Forecasts, by Country (2020-2032) (USD Billion)

11.3.2.3 Western Europe Social Gaming Market Estimates and Forecasts, By Game Type (2020-2032) (USD Billion) 

11.3.2.4 Western Europe Social Gaming Market Estimates and Forecasts, By Platform (2020-2032) (USD Billion)

11.3.2.5 Western Europe Social Gaming Market Estimates and Forecasts, By Revenue Model (2020-2032) (USD Billion)

11.3.2.6 Western Europe Social Gaming Market Estimates and Forecasts, By Age Group (2020-2032) (USD Billion)

11.3.2.7 Germany

11.3.2.7.1 Germany Social Gaming Market Estimates and Forecasts, By Game Type (2020-2032) (USD Billion)

11.3.2.7.2 Germany Social Gaming Market Estimates and Forecasts, By Platform (2020-2032) (USD Billion)

11.3.2.7.3 Germany Social Gaming Market Estimates and Forecasts, By Revenue Model (2020-2032) (USD Billion)

11.3.2.7.4 Germany Social Gaming Market Estimates and Forecasts, By Age Group (2020-2032) (USD Billion)

11.3.2.8 France

11.3.2.8.1 France Social Gaming Market Estimates and Forecasts, By Game Type (2020-2032) (USD Billion)

11.3.2.8.2 France Social Gaming Market Estimates and Forecasts, By Platform (2020-2032) (USD Billion)

11.3.2.8.3 France Social Gaming Market Estimates and Forecasts, By Revenue Model (2020-2032) (USD Billion)

11.3.2.8.4 France Social Gaming Market Estimates and Forecasts, By Age Group (2020-2032) (USD Billion)

11.3.2.9 UK

11.3.2.9.1 UK Social Gaming Market Estimates and Forecasts, By Game Type (2020-2032) (USD Billion)

11.3.2.9.2 UK Social Gaming Market Estimates and Forecasts, By Platform (2020-2032) (USD Billion)

11.3.2.9.3 UK Social Gaming Market Estimates and Forecasts, By Revenue Model (2020-2032) (USD Billion)

11.3.2.9.4 UK Social Gaming Market Estimates and Forecasts, By Age Group (2020-2032) (USD Billion)

11.3.2.10 Italy

11.3.2.10.1 Italy Social Gaming Market Estimates and Forecasts, By Game Type (2020-2032) (USD Billion)

11.3.2.10.2 Italy Social Gaming Market Estimates and Forecasts, By Platform (2020-2032) (USD Billion)

11.3.2.10.3 Italy Social Gaming Market Estimates and Forecasts, By Revenue Model (2020-2032) (USD Billion)

11.3.2.10.4 Italy Social Gaming Market Estimates and Forecasts, By Age Group (2020-2032) (USD Billion)

11.3.2.11 Spain

11.3.2.11.1 Spain Social Gaming Market Estimates and Forecasts, By Game Type (2020-2032) (USD Billion)

11.3.2.11.2 Spain Social Gaming Market Estimates and Forecasts, By Platform (2020-2032) (USD Billion)

11.3.2.11.3 Spain Social Gaming Market Estimates and Forecasts, By Revenue Model (2020-2032) (USD Billion)

11.3.2.11.4 Spain Social Gaming Market Estimates and Forecasts, By Age Group (2020-2032) (USD Billion)

11.3.2.12 Netherlands

11.3.2.12.1 Netherlands Social Gaming Market Estimates and Forecasts, By Game Type (2020-2032) (USD Billion)

11.3.2.12.2 Netherlands Social Gaming Market Estimates and Forecasts, By Platform (2020-2032) (USD Billion)

11.3.2.12.3 Netherlands Social Gaming Market Estimates and Forecasts, By Revenue Model (2020-2032) (USD Billion)

11.3.2.12.4 Netherlands Social Gaming Market Estimates and Forecasts, By Age Group (2020-2032) (USD Billion)

11.3.2.13 Switzerland

11.3.2.13.1 Switzerland Social Gaming Market Estimates and Forecasts, By Game Type (2020-2032) (USD Billion)

11.3.2.13.2 Switzerland Social Gaming Market Estimates and Forecasts, By Platform (2020-2032) (USD Billion)

11.3.2.13.3 Switzerland Social Gaming Market Estimates and Forecasts, By Revenue Model (2020-2032) (USD Billion)

11.3.2.13.4 Switzerland Social Gaming Market Estimates and Forecasts, By Age Group (2020-2032) (USD Billion)

11.3.2.14 Austria

11.3.2.14.1 Austria Social Gaming Market Estimates and Forecasts, By Game Type (2020-2032) (USD Billion)

11.3.2.14.2 Austria Social Gaming Market Estimates and Forecasts, By Platform (2020-2032) (USD Billion)

11.3.2.14.3 Austria Social Gaming Market Estimates and Forecasts, By Revenue Model (2020-2032) (USD Billion)

11.3.2.14.4 Austria Social Gaming Market Estimates and Forecasts, By Age Group (2020-2032) (USD Billion)

11.3.2.15 Rest of Western Europe

11.3.2.15.1 Rest of Western Europe Social Gaming Market Estimates and Forecasts, By Game Type (2020-2032) (USD Billion)

11.3.2.15.2 Rest of Western Europe Social Gaming Market Estimates and Forecasts, By Platform (2020-2032) (USD Billion)

11.3.2.15.3 Rest of Western Europe Social Gaming Market Estimates and Forecasts, By Revenue Model (2020-2032) (USD Billion)

11.3.2.15.4 Rest of Western Europe Social Gaming Market Estimates and Forecasts, By Age Group (2020-2032) (USD Billion)

11.4 Asia Pacific

11.4.1 Trends Analysis

11.4.2 Asia Pacific Social Gaming Market Estimates and Forecasts, by Country (2020-2032) (USD Billion)

11.4.3 Asia Pacific Social Gaming Market Estimates and Forecasts, By Game Type (2020-2032) (USD Billion) 

11.4.4 Asia Pacific Social Gaming Market Estimates and Forecasts, By Platform (2020-2032) (USD Billion)

11.4.5 Asia Pacific Social Gaming Market Estimates and Forecasts, By Revenue Model (2020-2032) (USD Billion)

11.4.6 Asia Pacific Social Gaming Market Estimates and Forecasts, By Age Group (2020-2032) (USD Billion)

11.4.7 China

11.4.7.1 China Social Gaming Market Estimates and Forecasts, By Game Type (2020-2032) (USD Billion)

11.4.7.2 China Social Gaming Market Estimates and Forecasts, By Platform (2020-2032) (USD Billion)

11.4.7.3 China Social Gaming Market Estimates and Forecasts, By Revenue Model (2020-2032) (USD Billion)

11.4.7.4 China Social Gaming Market Estimates and Forecasts, By Age Group (2020-2032) (USD Billion)

11.4.8 India

11.4.8.1 India Social Gaming Market Estimates and Forecasts, By Game Type (2020-2032) (USD Billion)

11.4.8.2 India Social Gaming Market Estimates and Forecasts, By Platform (2020-2032) (USD Billion)

11.4.8.3 India Social Gaming Market Estimates and Forecasts, By Revenue Model (2020-2032) (USD Billion)

11.4.8.4 India Social Gaming Market Estimates and Forecasts, By Age Group (2020-2032) (USD Billion)

11.4.9 Japan

11.4.9.1 Japan Social Gaming Market Estimates and Forecasts, By Game Type (2020-2032) (USD Billion)

11.4.9.2 Japan Social Gaming Market Estimates and Forecasts, By Platform (2020-2032) (USD Billion)

11.4.9.3 Japan Social Gaming Market Estimates and Forecasts, By Revenue Model (2020-2032) (USD Billion)

11.4.9.4 Japan Social Gaming Market Estimates and Forecasts, By Age Group (2020-2032) (USD Billion)

11.4.10 South Korea

11.4.10.1 South Korea Social Gaming Market Estimates and Forecasts, By Game Type (2020-2032) (USD Billion)

11.4.10.2 South Korea Social Gaming Market Estimates and Forecasts, By Platform (2020-2032) (USD Billion)

11.4.10.3 South Korea Social Gaming Market Estimates and Forecasts, By Revenue Model (2020-2032) (USD Billion)

11.4.10.4 South Korea Social Gaming Market Estimates and Forecasts, By Age Group (2020-2032) (USD Billion)

11.4.11 Vietnam

11.4.11.1 Vietnam Social Gaming Market Estimates and Forecasts, By Game Type (2020-2032) (USD Billion)

11.4.11.2 Vietnam Social Gaming Market Estimates and Forecasts, By Platform (2020-2032) (USD Billion)

11.4.11.3 Vietnam Social Gaming Market Estimates and Forecasts, By Revenue Model (2020-2032) (USD Billion)

11.4.11.4 Vietnam Social Gaming Market Estimates and Forecasts, By Age Group (2020-2032) (USD Billion)

11.4.12 Singapore

11.4.12.1 Singapore Social Gaming Market Estimates and Forecasts, By Game Type (2020-2032) (USD Billion)

11.4.12.2 Singapore Social Gaming Market Estimates and Forecasts, By Platform (2020-2032) (USD Billion)

11.4.12.3 Singapore Social Gaming Market Estimates and Forecasts, By Revenue Model (2020-2032) (USD Billion)

11.4.12.4 Singapore Social Gaming Market Estimates and Forecasts, By Age Group (2020-2032) (USD Billion)

11.4.13 Australia

11.4.13.1 Australia Social Gaming Market Estimates and Forecasts, By Game Type (2020-2032) (USD Billion)

11.4.13.2 Australia Social Gaming Market Estimates and Forecasts, By Platform (2020-2032) (USD Billion)

11.4.13.3 Australia Social Gaming Market Estimates and Forecasts, By Revenue Model (2020-2032) (USD Billion)

11.4.13.4 Australia Social Gaming Market Estimates and Forecasts, By Age Group (2020-2032) (USD Billion)

11.4.14 Rest of Asia Pacific

11.4.14.1 Rest of Asia Pacific Social Gaming Market Estimates and Forecasts, By Game Type (2020-2032) (USD Billion)

11.4.14.2 Rest of Asia Pacific Social Gaming Market Estimates and Forecasts, By Platform (2020-2032) (USD Billion)

11.4.14.3 Rest of Asia Pacific Social Gaming Market Estimates and Forecasts, By Revenue Model (2020-2032) (USD Billion)

11.4.14.4 Rest of Asia Pacific Social Gaming Market Estimates and Forecasts, By Age Group (2020-2032) (USD Billion)

11.5 Middle East and Africa

11.5.1 Middle East

11.5.1.1 Trends Analysis

11.5.1.2 Middle East Social Gaming Market Estimates and Forecasts, by Country (2020-2032) (USD Billion)

11.5.1.3 Middle East Social Gaming Market Estimates and Forecasts, By Game Type (2020-2032) (USD Billion) 

11.5.1.4 Middle East Social Gaming Market Estimates and Forecasts, By Platform (2020-2032) (USD Billion)

11.5.1.5 Middle East Social Gaming Market Estimates and Forecasts, By Revenue Model (2020-2032) (USD Billion)

11.5.1.6 Middle East Social Gaming Market Estimates and Forecasts, By Age Group (2020-2032) (USD Billion)

11.5.1.7 UAE

11.5.1.7.1 UAE Social Gaming Market Estimates and Forecasts, By Game Type (2020-2032) (USD Billion)

11.5.1.7.2 UAE Social Gaming Market Estimates and Forecasts, By Platform (2020-2032) (USD Billion)

11.5.1.7.3 UAE Social Gaming Market Estimates and Forecasts, By Revenue Model (2020-2032) (USD Billion)

11.5.1.7.4 UAE Social Gaming Market Estimates and Forecasts, By Age Group  (2020-2032) (USD Billion)

11.5.1.8 Egypt

11.5.1.8.1 Egypt Social Gaming Market Estimates and Forecasts, By Game Type (2020-2032) (USD Billion)

11.5.1.8.2 Egypt Social Gaming Market Estimates and Forecasts, By Platform (2020-2032) (USD Billion)

11.5.1.8.3 Egypt Social Gaming Market Estimates and Forecasts, By Revenue Model (2020-2032) (USD Billion)

11.5.1.8.4 Egypt Social Gaming Market Estimates and Forecasts, By Age Group (2020-2032) (USD Billion)

11.5.1.9 Saudi Arabia

11.5.1.9.1 Saudi Arabia Social Gaming Market Estimates and Forecasts, By Game Type (2020-2032) (USD Billion)

11.5.1.9.2 Saudi Arabia Social Gaming Market Estimates and Forecasts, By Platform (2020-2032) (USD Billion)

11.5.1.9.3 Saudi Arabia Social Gaming Market Estimates and Forecasts, By Revenue Model (2020-2032) (USD Billion)

11.5.1.9.4 Saudi Arabia Social Gaming Market Estimates and Forecasts, By Age Group (2020-2032) (USD Billion)

11.5.1.10 Qatar

11.5.1.10.1 Qatar Social Gaming Market Estimates and Forecasts, By Game Type (2020-2032) (USD Billion)

11.5.1.10.2 Qatar Social Gaming Market Estimates and Forecasts, By Platform (2020-2032) (USD Billion)

11.5.1.10.3 Qatar Social Gaming Market Estimates and Forecasts, By Revenue Model (2020-2032) (USD Billion)

11.5.1.10.4 Qatar Social Gaming Market Estimates and Forecasts, By Age Group (2020-2032) (USD Billion)

11.5.1.11 Rest of Middle East

11.5.1.11.1 Rest of Middle East Social Gaming Market Estimates and Forecasts, By Game Type (2020-2032) (USD Billion)

11.5.1.11.2 Rest of Middle East Social Gaming Market Estimates and Forecasts, By Platform (2020-2032) (USD Billion)

11.5.1.11.3 Rest of Middle East Social Gaming Market Estimates and Forecasts, By Revenue Model (2020-2032) (USD Billion)

11.5.1.11.4 Rest of Middle East Social Gaming Market Estimates and Forecasts, By Age Group (2020-2032) (USD Billion)

11.5.2 Africa

11.5.2.1 Trends Analysis

11.5.2.2 Africa Social Gaming Market Estimates and Forecasts, by Country (2020-2032) (USD Billion)

11.5.2.3 Africa Social Gaming Market Estimates and Forecasts, By Game Type (2020-2032) (USD Billion) 

11.5.2.4 Africa Social Gaming Market Estimates and Forecasts, By Platform (2020-2032) (USD Billion)

11.5.2.5 Africa Social Gaming Market Estimates and Forecasts, By Revenue Model (2020-2032) (USD Billion)

11.5.2.6 Africa Social Gaming Market Estimates and Forecasts, By Age Group (2020-2032) (USD Billion)

11.5.2.7 South Africa

11.5.2.7.1 South Africa Social Gaming Market Estimates and Forecasts, By Game Type (2020-2032) (USD Billion)

11.5.2.7.2 South Africa Social Gaming Market Estimates and Forecasts, By Platform (2020-2032) (USD Billion)

11.5.2.7.3 South Africa Social Gaming Market Estimates and Forecasts, By Revenue Model (2020-2032) (USD Billion)

11.5.2.7.4 South Africa Social Gaming Market Estimates and Forecasts, By Age Group (2020-2032) (USD Billion)

11.5.2.8 Nigeria

11.5.2.8.1 Nigeria Social Gaming Market Estimates and Forecasts, By Game Type (2020-2032) (USD Billion)

11.5.2.8.2 Nigeria Social Gaming Market Estimates and Forecasts, By Platform (2020-2032) (USD Billion)

11.5.2.8.3 Nigeria Social Gaming Market Estimates and Forecasts, By Revenue Model (2020-2032) (USD Billion)

11.5.2.8.4 Nigeria Social Gaming Market Estimates and Forecasts, By Age Group (2020-2032) (USD Billion)

11.5.2.9 Rest of Africa

11.5.2.9.1 Rest of Africa Social Gaming Market Estimates and Forecasts, By Game Type (2020-2032) (USD Billion)

11.5.2.9.2 Rest of Africa Social Gaming Market Estimates and Forecasts, By Platform (2020-2032) (USD Billion)

11.5.2.9.3 Rest of Africa Social Gaming Market Estimates and Forecasts, By Revenue Model (2020-2032) (USD Billion)

11.5.2.9.4 Rest of Africa Social Gaming Market Estimates and Forecasts, By Age Group (2020-2032) (USD Billion)

11.6 Latin America

11.6.1 Trends Analysis

11.6.2 Latin America Social Gaming Market Estimates and Forecasts, by Country (2020-2032) (USD Billion)

11.6.3 Latin America Social Gaming Market Estimates and Forecasts, By Game Type (2020-2032) (USD Billion) 

11.6.4 Latin America Social Gaming Market Estimates and Forecasts, By Platform (2020-2032) (USD Billion)

11.6.5 Latin America Social Gaming Market Estimates and Forecasts, By Revenue Model (2020-2032) (USD Billion)

11.6.6 Latin America Social Gaming Market Estimates and Forecasts, By Age Group (2020-2032) (USD Billion)

11.6.7 Brazil

11.6.7.1 Brazil Social Gaming Market Estimates and Forecasts, By Game Type (2020-2032) (USD Billion)

11.6.7.2 Brazil Social Gaming Market Estimates and Forecasts, By Platform (2020-2032) (USD Billion)

11.6.7.3 Brazil Social Gaming Market Estimates and Forecasts, By Revenue Model (2020-2032) (USD Billion)

11.6.7.4 Brazil Social Gaming Market Estimates and Forecasts, By Age Group (2020-2032) (USD Billion)

11.6.8 Argentina

11.6.8.1 Argentina Social Gaming Market Estimates and Forecasts, By Game Type (2020-2032) (USD Billion)

11.6.8.2 Argentina Social Gaming Market Estimates and Forecasts, By Platform (2020-2032) (USD Billion)

11.6.8.3 Argentina Social Gaming Market Estimates and Forecasts, By Revenue Model (2020-2032) (USD Billion)

11.6.8.4 Argentina Social Gaming Market Estimates and Forecasts, By Age Group (2020-2032) (USD Billion)

11.6.9 Colombia

11.6.9.1 Colombia Social Gaming Market Estimates and Forecasts, By Game Type (2020-2032) (USD Billion)

11.6.9.2 Colombia Social Gaming Market Estimates and Forecasts, By Platform (2020-2032) (USD Billion)

11.6.9.3 Colombia Social Gaming Market Estimates and Forecasts, By Revenue Model (2020-2032) (USD Billion)

11.6.9.4 Colombia Social Gaming Market Estimates and Forecasts, By Age Group (2020-2032) (USD Billion)

11.6.10 Rest of Latin America

11.6.10.1 Rest of Latin America Social Gaming Market Estimates and Forecasts, By Game Type (2020-2032) (USD Billion)

11.6.10.2 Rest of Latin America Social Gaming Market Estimates and Forecasts, By Platform (2020-2032) (USD Billion)

11.6.10.3 Rest of Latin America Social Gaming Market Estimates and Forecasts, By Revenue Model (2020-2032) (USD Billion)

11.6.10.4 Rest of Latin America Social Gaming Market Estimates and Forecasts, By Age Group (2020-2032) (USD Billion)

12. Company Profiles

12.1 Aeria Games GmbH

12.1.1 Company Overview

12.1.2 Financial

12.1.3 Products/ Services Offered

12.1.4 SWOT Analysis

12.2 Activision Blizzard, Inc.

12.2.1 Company Overview

12.2.2 Financial

12.2.3 Products/ Services Offered

12.2.4 SWOT Analysis

12.3 Zynga, Inc.

12.3.1 Company Overview

12.3.2 Financial

12.3.3 Products/ Services Offered

12.3.4 SWOT Analysis

12.4 King Digital Entertainment plc

12.4.1 Company Overview

12.4.2 Financial

12.4.3 Products/ Services Offered

12.4.4 SWOT Analysis

12.5 Behaviour Interactive, Inc.

12.5.1 Company Overview

12.5.2 Financial

12.5.3 Products/ Services Offered

12.5.4 SWOT Analysis

12.6 DeNA Co., Ltd.

12.6.1 Company Overview

12.6.2 Financial

12.6.3 Products/ Services Offered

12.6.4 SWOT Analysis

12.7 Electronic Arts, Inc.

12.7.1 Company Overview

12.7.2 Financial

12.7.3 Products/ Services Offered

12.7.4 SWOT Analysis

12.8 PopCap Games, Inc.

12.8.1 Company Overview

12.8.2 Financial

12.8.3 Products/ Services Offered

12.8.4 SWOT Analysis

12.9 Etermax

12.9.1 Company Overview

12.9.2 Financial

12.9.3 Products/ Services Offered

12.9.4 SWOT Analysis

12.10 GREE, Inc.

12.10.1 Company Overview

12.10.2 Financial

12.10.3 Products/ Services Offered

12.10.4 SWOT Analysis

13. Use Cases and Best Practices

14. Conclusion

An accurate research report requires proper strategizing as well as implementation. There are multiple factors involved in the completion of good and accurate research report and selecting the best methodology to compete the research is the toughest part. Since the research reports we provide play a crucial role in any company’s decision-making process, therefore we at SNS Insider always believe that we should choose the best method which gives us results closer to reality. This allows us to reach at a stage wherein we can provide our clients best and accurate investment to output ratio.

Each report that we prepare takes a timeframe of 350-400 business hours for production. Starting from the selection of titles through a couple of in-depth brain storming session to the final QC process before uploading our titles on our website we dedicate around 350 working hours. The titles are selected based on their current market cap and the foreseen CAGR and growth.


The 5 steps process:

Step 1: Secondary Research:

Secondary Research or Desk Research is as the name suggests is a research process wherein, we collect data through the readily available information. In this process we use various paid and unpaid databases which our team has access to and gather data through the same. This includes examining of listed companies’ annual reports, Journals, SEC filling etc. Apart from this our team has access to various associations across the globe across different industries. Lastly, we have exchange relationships with various university as well as individual libraries.

Secondary Research

Step 2: Primary Research

When we talk about primary research, it is a type of study in which the researchers collect relevant data samples directly, rather than relying on previously collected data.  This type of research is focused on gaining content specific facts that can be sued to solve specific problems. Since the collected data is fresh and first hand therefore it makes the study more accurate and genuine.

We at SNS Insider have divided Primary Research into 2 parts.

Part 1 wherein we interview the KOLs of major players as well as the upcoming ones across various geographic regions. This allows us to have their view over the market scenario and acts as an important tool to come closer to the accurate market numbers. As many as 45 paid and unpaid primary interviews are taken from both the demand and supply side of the industry to make sure we land at an accurate judgement and analysis of the market.

This step involves the triangulation of data wherein our team analyses the interview transcripts, online survey responses and observation of on filed participants. The below mentioned chart should give a better understanding of the part 1 of the primary interview.

Primary Research

Part 2: In this part of primary research the data collected via secondary research and the part 1 of the primary research is validated with the interviews from individual consultants and subject matter experts.

Consultants are those set of people who have at least 12 years of experience and expertise within the industry whereas Subject Matter Experts are those with at least 15 years of experience behind their back within the same space. The data with the help of two main processes i.e., FGDs (Focused Group Discussions) and IDs (Individual Discussions). This gives us a 3rd party nonbiased primary view of the market scenario making it a more dependable one while collation of the data pointers.

Step 3: Data Bank Validation

Once all the information is collected via primary and secondary sources, we run that information for data validation. At our intelligence centre our research heads track a lot of information related to the market which includes the quarterly reports, the daily stock prices, and other relevant information. Our data bank server gets updated every fortnight and that is how the information which we collected using our primary and secondary information is revalidated in real time.

Data Bank Validation

Step 4: QA/QC Process

After all the data collection and validation our team does a final level of quality check and quality assurance to get rid of any unwanted or undesired mistakes. This might include but not limited to getting rid of the any typos, duplication of numbers or missing of any important information. The people involved in this process include technical content writers, research heads and graphics people. Once this process is completed the title gets uploader on our platform for our clients to read it.

Step 5: Final QC/QA Process:

This is the last process and comes when the client has ordered the study. In this process a final QA/QC is done before the study is emailed to the client. Since we believe in giving our clients a good experience of our research studies, therefore, to make sure that we do not lack at our end in any way humanly possible we do a final round of quality check and then dispatch the study to the client.

Key Segments:

By Game Type

  • Casual Games

  • Strategy Games

  • Simulation Games

  • Role-Playing Games (RPGs)

  • Other Game Types

By Platform

  • Mobile Devices (Smartphones, Tablets)

  • PCs/Laptops

  • Consoles

By Revenue Model

  • Advertisements

  • Virtual Goods

  • Lead Generation

  • Subscription Services

  • In-App Purchases

By Age Group

  • 13 to 18 Years

  • 19 to 25 Years

  • 26 to 35 Years

  • Above 35 Years

Request for Segment Customization as per your Business Requirement: Segment Customization Request

Regional Coverage:

North America

  • US

  • Canada

  • Mexico

Europe

  • Eastern Europe

    • Poland

    • Romania

    • Hungary

    • Turkey

    • Rest of Eastern Europe

  • Western Europe

    • Germany

    • France

    • UK

    • Italy

    • Spain

    • Netherlands

    • Switzerland

    • Austria

    • Rest of Western Europe

Asia Pacific

  • China

  • India

  • Japan

  • South Korea

  • Vietnam

  • Singapore

  • Australia

  • Rest of Asia Pacific

Middle East & Africa

Middle East

  • UAE

  • Egypt

  • Saudi Arabia

  • Qatar

  • Rest of the Middle East

Africa

  • Nigeria

  • South Africa

  • Rest of Africa

Latin America

  • Brazil

  • Argentina

  • Colombia

  • Rest of Latin America

Request for Country Level Research Report: Country Level Customization Request

Available Customization

With the given market data, SNS Insider offers customization as per the company’s specific needs. The following customization options are available for the report:

  • Product Analysis

  • Criss-Cross segment analysis (e.g. Product X Application)

  • Product Matrix which gives a detailed comparison of the product portfolio of each company

  • Geographic Analysis

  • Additional countries in any of the regions

  • Company Information

  • Detailed analysis and profiling of additional market players (Up to five)


  •            5000 (33% Discount)


  •            8950 (40% Discount)


  •            3050 (23% Discount)

Start a Conversation

Hi! Click one of our member below to chat on Phone