Social Commerce Market Report Scope & Overview:
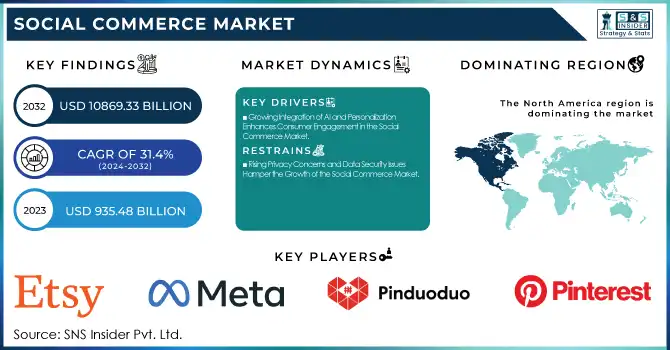
The Social Commerce Market was valued at USD 1229.22 billion in 2024 and is expected to reach USD 10924.28 billion by 2032, growing at a CAGR of 31.4% from 2025-2032.
To get more information on Social Commerce Market - Request Free Sample Report
The Market is rapidly growing, driven by smartphone adoption, influencer marketing, and integrated shopping features on social media platforms. It enables direct buying and selling through social networks, leveraging user engagement, live streaming, and community-driven purchases. Key drivers include interactive shopping experiences, influencer impact, and AI-powered personalization. Platforms like Facebook, Instagram, TikTok, and WeChat have become retail hubs. The market is segmented by business model, product type, and platform type, with trends like live shopping and short-video commerce shaping its future. Social commerce is redefining e-commerce, offering brands new ways to engage and convert customers.
Market Size and Forecast
-
Market Size in 2024: USD 1229.22 Billion
-
Market Size by 2032: USD 10924.28 Billion
-
CAGR: 31.4% from 2025 to 2032
-
Base Year: 2024
-
Forecast Period: 2025–2032
-
Historical Data: 2021–2023
Social Commerce Market Trends
-
Rising social media usage and influencer marketing are driving the social commerce market.
-
Integration of in-app shopping, live streaming, and AI-driven recommendations is enhancing user engagement and sales.
-
Growing adoption by e-commerce platforms, retailers, and brands is boosting market growth.
-
Expansion of mobile payment solutions and digital wallets is facilitating seamless transactions.
-
Increasing focus on personalized shopping experiences and customer retention is shaping market trends.
-
Growth of social networking platforms in emerging economies is widening market reach.
-
Collaborations between social media companies, brands, and technology providers are accelerating innovation and adoption.
Social Commerce Market Growth Drivers:
-
Growing Integration of AI and Personalization Enhances Consumer Engagement in the Social Commerce Market
The adoption of AI-driven personalization in social commerce is significantly enhancing consumer engagement and conversion rates. AI algorithms analyze user behavior, preferences, and purchase history to deliver tailored product recommendations, improving the shopping experience. Platforms like TikTok, Instagram, and WeChat leverage AI-powered chatbots, augmented reality (AR) try-ons, and predictive analytics to create a more interactive and personalized shopping journey.
Additionally, machine learning enables businesses to optimize pricing strategies, inventory management, and targeted marketing campaigns. As a result, brands and retailers can provide highly relevant content, fostering greater trust and brand loyalty among consumers. This growing reliance on AI is revolutionizing social commerce by making it more intuitive, data-driven, and efficient. Furthermore, AI-driven automation in customer service reduces response times and enhances user satisfaction, making the entire shopping experience seamless. With AI advancements continuing to evolve, its integration into social commerce platforms is expected to further drive market growth.
Social Commerce Market Restraints:
-
Rising Privacy Concerns and Data Security Issues Hamper the Growth of the Social Commerce Market
As social commerce platforms increasingly rely on consumer data for targeted marketing and personalization, privacy and data security concerns are escalating. Many users are becoming wary of how their personal information, shopping habits, and social interactions are being collected and utilized by companies. High-profile data breaches and misuse of consumer data have raised alarms, prompting stricter regulations such as the General Data Protection Regulation (GDPR) and the California Consumer Privacy Act (CCPA). These regulations impose limitations on how businesses can collect and process user data, potentially restricting their ability to provide highly personalized shopping experiences.
Additionally, rising cyber threats, including phishing attacks and fraudulent transactions, further exacerbate security concerns. As a result, platforms must invest heavily in robust cybersecurity measures and transparent data policies to retain consumer trust. Addressing these privacy concerns while maintaining seamless personalization remains a significant challenge for the continued growth of the social commerce market.
Social Commerce Market Opportunities:
-
Expansion of Live Streaming Commerce Unlocks New Revenue Streams for the Social Commerce Market
Live streaming commerce is emerging as a game-changer in the social commerce industry, offering brands and influencers a dynamic way to engage consumers. This interactive shopping experience allows real-time product demonstrations, Q&A sessions, and exclusive deals, making purchasing decisions more spontaneous. Platforms like TikTok Shop, Taobao Live, and Instagram Live Shopping have seen significant traction, with millions of users participating in live sales events. The success of live commerce in China, where it contributes a substantial share of e-commerce revenue, is inspiring global adoption.
Moreover, the format encourages impulse buying and enhances consumer trust as they can see product usage in real time. Businesses leveraging live shopping gain access to a highly engaged audience, leading to increased conversion rates and higher average order values. As technology advances and internet penetration grows, live-streaming commerce presents an enormous opportunity for brands to create immersive shopping experiences and drive revenue.
Social Commerce Market Challenges:
-
Logistical Challenges and Fulfillment Complexities Create Bottlenecks in the Social Commerce Market
Despite its rapid growth, the social commerce market faces significant logistical and fulfillment challenges, particularly in ensuring timely and efficient delivery of products. Unlike traditional e-commerce platforms, many social commerce transactions involve small-scale sellers or independent influencers who may lack robust supply chain infrastructure. Issues such as inventory mismanagement, high return rates, and inconsistent shipping times can negatively impact customer satisfaction. Additionally, cross-border transactions pose further complexities, including customs regulations, international shipping costs, and delivery delays. With consumers demanding faster delivery and seamless order fulfillment, social commerce platforms must collaborate with third-party logistics providers or develop integrated supply chain solutions to streamline operations.
Moreover, ensuring product quality and authenticity remains a challenge, as many purchases are driven by user-generated content rather than direct brand interactions. Addressing these logistical hurdles is crucial for social commerce platforms to scale effectively and maintain consumer trust in an increasingly competitive market.
Social Commerce Market Segment Analysis
By Business Model, B2C dominated in 2024 with 55% revenue share. C2C expected fastest growth at 33.46% CAGR.
The business-to-consumer (B2C) segment held the largest revenue share of 55% in 2024, driven by the increasing adoption of social commerce platforms by major brands and retailers. Companies like Meta (Facebook, Instagram), TikTok, and WeChat have enhanced their B2C offerings by integrating seamless in-app shopping features, allowing businesses to directly engage with consumers.
For instance, TikTok Shop expanded its e-commerce capabilities in 2023, enabling brands to set up storefronts, showcase products via short videos, and execute live selling events. Similarly, Instagram introduced its AI-powered "Shop with Reels" feature, enhancing personalized product recommendations.
The growing trust in social commerce, coupled with secure payment gateways and AI-driven personalization, is further propelling B2C sales. As social commerce continues to evolve, brands are expected to expand their presence, enhancing user engagement and increasing revenue generation.
The consumer-to-consumer (C2C) segment is witnessing the highest growth, with a CAGR of 33.46%, fueled by the rise of peer-to-peer selling and the increasing preference for secondhand and handmade products. Platforms like Etsy, Poshmark, Xiaohongshu, and Meesho have driven this trend by enabling individuals to monetize their products through direct sales. The shift towards sustainable shopping and thrift culture has also contributed to the segment's rapid growth, with secondhand fashion gaining popularity on platforms like Depop and Facebook Marketplace. Social commerce’s interactive and community-driven nature is accelerating C2C transactions, as buyers rely on user-generated reviews, live demos, and influencer recommendations. With increasing trust in peer-led transactions, the C2C model is expected to further revolutionize the social commerce market.
By Product Type, Apparel led in 2024 with 25% revenue share. Personal & Beauty Care growing fastest at 33.7% CAGR.
The Apparel segment held the largest revenue share of 25% in 2024, driven by the increasing popularity of fashion-focused social commerce platforms and influencer-led marketing. Brands and retailers have capitalized on platforms like Instagram, TikTok, and Pinduoduo to showcase trendy, fast-fashion collections through short videos, live streaming, and user-generated content. The seamless in-app purchasing experience, combined with engaging content formats like shoppable reels, influencer collaborations, and live selling, continues to drive significant revenue in the apparel segment. As social commerce reshapes fashion retail, major brands are expected to expand their digital storefronts, driving even higher engagement and conversion rates.
The Personal & Beauty Care segment is experiencing the fastest growth, with a CAGR of 33.7%, fueled by the rise of beauty influencers, AR-driven try-on tools, and community-driven recommendations. Platforms like TikTok, Xiaohongshu, and Instagram have become major drivers for beauty brands, enabling direct engagement through tutorial videos, product reviews, and live commerce.
In 2023, Sephora expanded its “Sephora Live” shopping experience on Instagram, allowing beauty experts and influencers to showcase products in real time, boosting impulse purchases. Similarly, L’Oréal launched an AI-powered “Virtual Try-On” feature on TikTok, allowing users to test makeup shades before purchasing.
By Platform/Sales Channel, Video Commerce (Live Stream + Prerecorded) dominated in 2024 with 42% revenue share.
The Video Commerce (Live Stream + Prerecorded) segment dominated the social commerce market with a 42% revenue share in 2024, driven by the increasing adoption of interactive shopping experiences across platforms like TikTok Shop, Instagram Live, Taobao Live, and Facebook Live Shopping. Brands and influencers have leveraged real-time engagement, product demonstrations, and exclusive deals to boost conversions.
In 2023, Taobao Live introduced AI-powered real-time subtitles and automated product tagging, enhancing accessibility and seamless shopping experiences.
Pre-recorded shoppable videos have also gained traction, enabling users to make purchases without attending live sessions. The combination of immersive content, influencer-driven sales, and frictionless checkout has revolutionized online shopping, making video commerce a crucial driver of the social commerce boom. With advancements in AI, AR filters, and real-time engagement tools, video commerce is expected to continue transforming how brands connect with consumers, fostering deeper engagement and higher conversion rates in the digital retail landscape.
Social Commerce Market Regional Analysis
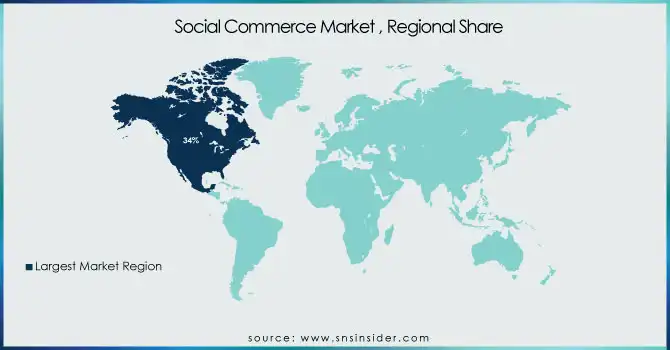
North America Social Commerce Market Insights
North America led the Social Commerce Market in 2024, holding an estimated 34% market share, driven by high social media penetration, strong e-commerce infrastructure, and widespread influencer marketing adoption. Platforms like Instagram, Facebook, TikTok, and Pinterest have integrated advanced shopping features, enabling seamless transactions.
In 2023, Meta expanded its in-app checkout for Instagram Shops, allowing brands to complete purchases without redirecting users.
Additionally, Amazon partnered with TikTok to introduce a shoppable feed, enhancing video-based commerce. The presence of top global brands and early adoption of live shopping events, such as Walmart’s live-stream sales on TikTok, further contributed to the region’s dominance. With high consumer trust in digital shopping and AI-driven personalization, North America remains the leading hub for social commerce innovation.
Asia Pacific Social Commerce Market Insights
The Asia Pacific region is experiencing the fastest growth in Social Commerce, with an estimated CAGR of 33.2%, fueled by China, India, and Southeast Asia. China leads the market with platforms like Taobao Live, Xiaohongshu, and WeChat, where live-stream commerce has become a mainstream shopping method.
In 2023, Alibaba’s Taobao Live expanded AI-powered interactive shopping experiences, further driving engagement. India and Southeast Asia are also witnessing rapid adoption, with platforms like Meesho, Shopee, and TikTok Shop enabling social reselling and influencer-driven commerce.
The region’s growing smartphone penetration, preference for short-video content, and digital payment adoption have accelerated market expansion. Additionally, K-beauty and fashion brands leverage WeChat and Douyin to target young consumers. With increasing government support for digital commerce and rising internet users, Asia Pacific is set to become the global powerhouse for social commerce growth and innovation.
Europe Social Commerce Market Insights
Europe’s Social Commerce Market is witnessing robust growth, driven by rising smartphone penetration, social media adoption, and e-commerce integration. Consumers increasingly engage with brands via platforms like Instagram, Facebook, and TikTok for shopping experiences. Influencer marketing, live commerce, and localized content are enhancing user engagement. Strong digital payment infrastructure, growing trust in online transactions, and increasing preference for convenient, interactive shopping are further boosting the market across Western and Northern European countries.
Middle East & Africa and Latin America Social Commerce Market Insights
The Social Commerce Market in Middle East & Africa and Latin America is expanding rapidly due to growing internet penetration, mobile device adoption, and social media usage. Consumers increasingly rely on platforms like Instagram, TikTok, and WhatsApp for interactive shopping experiences. Influencer marketing, localized content, and live commerce are driving engagement. Rising digital payment adoption, e-commerce trust, and demand for convenient, social-driven shopping solutions are fueling market growth in these regions.
Get Customized Report as per Your Business Requirement - Enquiry Now
Social Commerce Market Competitive Landscape:
Etsy, Inc.
Etsy, founded in 2005 and headquartered in Brooklyn, New York, is a global online marketplace connecting buyers and independent sellers, including artisans, crafters, and vintage goods vendors. The platform emphasizes unique, handcrafted, and sustainable products while supporting small business growth. Etsy focuses on fostering creator communities, enhancing seller visibility, and promoting responsible commerce, providing tools and policies that enable independent entrepreneurs to reach a global audience effectively.
-
November 2024: Etsy's CEO, Josh Silverman, highlighted challenges faced by small business owners and artists due to an influx of mass-produced goods on the platform. He encouraged creators to share process videos to enhance visibility, following a July policy update specifying levels of human involvement in product creation.
Meesho
Meesho, founded in 2015 and headquartered in Bangalore, India, is a leading social commerce platform enabling small businesses and individual sellers to reach customers via social networks. The company empowers entrepreneurs to sell products online with minimal investment and logistical support, driving digital commerce adoption in India. Meesho focuses on scalability, accessibility, and financial inclusion, connecting millions of transacting users with sellers and fostering growth in the social e-commerce ecosystem.
-
May 2024: Meesho secured USD 275 million in a new funding round, reinforcing its position as a leading social commerce platform in India with approximately 150 million transacting users.
Key Players
Some of the major players in the Social Commerce Market are:
-
Etsy, Inc.
-
Fashnear Technologies Private Limited (Meesho)
-
Meta Platforms, Inc. (Facebook)
-
Pinduoduo Inc.
-
Pinterest, Inc.
-
Poshmark
-
Roposo
-
Snap, Inc.
-
Taobao
-
TikTok (Douyin)
-
Trell Shop
-
Twitter, Inc.
-
WeChat (Weixin)
-
Xiaohongshu
-
Yunji Sharing Technology Co., Ltd.
-
ShopShops
-
Klarna (Social Shopping integrations)
-
Depop
-
Zilingo
-
NTWRK
| Report Attributes | Details |
|---|---|
| Market Size in 2024 | US$ 1229.22 Billion |
| Market Size by 2032 | US$ 10924.28 Billion |
| CAGR | CAGR of 31.4% From 2025 to 2032 |
| Base Year | 2024 |
| Forecast Period | 2025-2032 |
| Historical Data | 2021-2023 |
| Report Scope & Coverage | Market Size, Segments Analysis, Competitive Landscape, Regional Analysis, DROC & SWOT Analysis, Forecast Outlook |
| Key Segments | • By Business Model (Business to Consumer (B2C), Business to Business (B2B), Consumer to Consumer (C2C)) • By Product Type (Personal & Beauty Care, Apparels, Accessories, Home Products, Health Supplements, Food & Beverage, Others) • By Platform/Sales Channel (Video Commerce (Live stream + Prerecorded), Social Network-led Commerce, Social Reselling, Group Buying, Product Review Platforms) |
| Regional Analysis/Coverage | North America (US, Canada, Mexico), Europe (Eastern Europe [Poland, Romania, Hungary, Turkey, Rest of Eastern Europe] Western Europe] Germany, France, UK, Italy, Spain, Netherlands, Switzerland, Austria, Rest of Western Europe]), Asia Pacific (China, India, Japan, South Korea, Vietnam, Singapore, Australia, Rest of Asia Pacific), Middle East & Africa (Middle East [UAE, Egypt, Saudi Arabia, Qatar, Rest of Middle East], Africa [Nigeria, South Africa, Rest of Africa], Latin America (Brazil, Argentina, Colombia, Rest of Latin America) |
| Company Profiles | Etsy, Inc., Fashnear Technologies Private Limited (Meesho), Meta Platforms, Inc. (Facebook), Pinduoduo Inc., Pinterest, Inc., Poshmark, Roposo, Snap, Inc., Taobao, TikTok (Douyin), Trell Shop, Twitter, Inc., WeChat (Weixin), Xiaohongshu, Yunji Sharing Technology Co., Ltd. |
