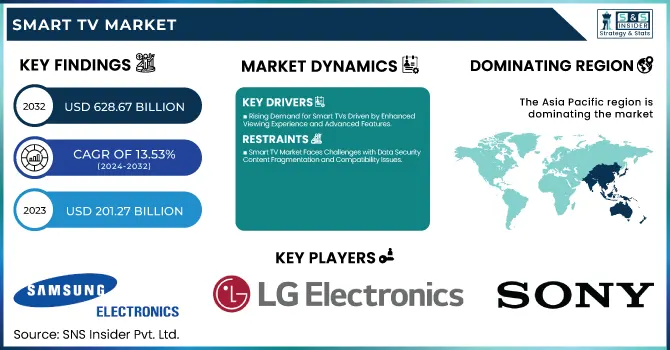
The Smart TV Market Size was valued at USD 201.27 Billion in 2023 and is expected to reach USD 628.67 Billion by 2032 and grow at a CAGR of 13.53% over the forecast period 2024-2032. The Smart TV market is rapidly evolving across all segments. Product performance things like 4K/8K resolution, higher refresh rates, and better HDR technologies that improve the visual experience. Innovative & Technology progression like AI-based content recommendations, Voice control integration, and gaming integration.
To Get more information on Smart TV Market - Request Free Sample Report
As the demand for smart ecosystems gains traction, smart home & connectivity functionalities are broadening with the introduction of connectivity functionalities for seamless integration with IoT devices, smart speakers, and home automation systems. Finally, usage analytics & technical enhancements are aimed at better UI designs, upgraded hardware, energy efficiency, and data security to boost the user experience and overall system betterment stability.
Key Drivers:
Rising Demand for Smart TVs Driven by Enhanced Viewing Experience and Advanced Features
Due to rising consumer acceptance of improving TV viewing experience and high-end functionality offered by smart TV, the smart TV market is observing steady growth. That demand for high-performance Smart TVs is being boosted by the increasing consumption of 4K and 8K content, as well as better internet penetration. Moreover, AI voice assistants like Google Assistant and Amazon Alexa can also help in providing a better user experience and this is expected to drive growth for the AI music generator market during the forecast period. The increasing popularity of OTT platforms such as Netflix, Amazon Prime, and Disney+ adds to the need for Smart TVs with operating systems such as Android TV, Roku, or Tizen. In addition, decreasing prices for large TVs and improved technology in the panel are bringing more premium models within reach of consumers.
Restrain:
Smart TV Market Faces Challenges with Data Security Content Fragmentation and Compatibility Issues
There are significant challenges in the Smart TV market that are associated with data security and privacy issues. The connected nature of these devices and their smart capabilities opens them up to a wider range of cyber threats with the potential to endanger user data. Right now, consumers are more hesitant than ever to share personal information, which could make adoption more difficult. Another important issue is content fragmentation, as different platforms can acquire rights to different content, which can create inconvenience to the users, as they have to subscribe to multiple platforms to watch it. They may also face problems with compatibility between operating systems and applications, creating friction in communication and lowering the level of satisfaction amongst users.
Opportunity:
Smart TV Market Growth Fueled by Connected Homes Rising Incomes and Gaming Display Demand
With more and more connected home ecosystems in markets, the connected home opens a real growth opportunity for all Smart TV manufacturers. The increasing smart homes trend is boosting the integration of TV with IoT devices, improving user experience. Rising disposable incomes and the emergence of effective digital infrastructure allow for attractive game development scenarios in developing countries in Asia-Pacific and Latin America. Moreover, the increased gaming content and expanding demand for high-refresh displays open new opportunities for manufacturers to network with gamers. The demand for 8K Technology is expected to gain traction in premium segments as the technology matures which is expected to accelerate the demand in the Day & Night Machine Vision Cameras market generating higher revenues shortly.
Challenges:
Smart TV Market Faces Challenges with Technology Complexity Compatibility Issues and Sustainability Demands
The complexity of technology is an ever-growing landlord challenge in the Smart TV market. Less tech-savvy consumers may become frustrated with frequent software updates, a continually evolving user interface, and new features, sacrificing adoption. Additionally, seamless integration with hardware is also often not present and that can lead to a slew of compatibility woes problems between devices like sound systems, gaming consoles, or even other smart home gadgets. Balancing enhanced performance with efficiency requirements is another challenge manufacturers face with global sustainability regulations becoming more stringent. For companies that intend to capture greater market share, it is critical to address these concerns while not losing the pace of innovation.
By Operating System
In 2023, Android TV emerged as the leader in the smart TV market with a significant 39.8% market share. This has gained popularity through a Hands-on free User interface, a massive supportive application environment, and perfect connectivity with Google services (Google Assistant, Chromecast, etc.). Its wide support of a multitude of TV brands at all price points also cemented its status as a leader.
Roku is projected to attain the fastest compound annual growth rate (CAGR) from 2024-2032. The rising interest in Roku is fueled by its user-friendly interface, cost-effective streaming gadgets, and an increasing number of content partnership deals. With its emphasis on providing tailored content recommendations and smooth streaming experiences, the platform can expect to rapidly grow. While Roku is already a major player in North America, its maturing position in the streaming landscape, combined with its expanding footprint in the growing international video consumption markets, signals good business for the company shortly.
By Resolution
In 2023, 4K UHD TV dominated the Smart TV market, securing a notable 49.8% market share. The increased adoption rate can be credited to better picture quality, better color accuracy, and more content in 4K in major streaming services. For this very reason, they are great places on the market, also thanks to making them not very expensive, more people can afford 4k TVs, which are compounded expensively seamlessly so that it is a good option for those who want to enjoy the content they like in an immersive experience.
Full HD TV is projected to witness the fastest CAGR from 2024 to 2032. The burgeoning demand in price-sensitive markets, especially in developing regions, is the key factor behind this growth. Full HD TVs remain popular among buyers looking for affordable and proper display equipment as additional options to their main solution for smaller apartments. Full HD models are expected to gradually gain steam, as manufacturers target enhanced energy efficiency and smart features.
By Screen Size
Smart TVs between 46 to 55 inches, which represent the biggest market share of 34.6% of the entire market in 2023. The segment is also a sweet spot between screen size, price, and capability for normal-sized living rooms, and for that reason, it is the leader in this segment. This size range seems to be in demand by consumers for its ability to present a cinematic experience while not necessitating a major overhaul of the room. Also, nowadays 4K and smart features are available in this segment, and we are seeing a decent amount of sales coming in the segment.
Smart TVs above 65 inches are expected to witness the fastest CAGR from 2024-2032. This growth has been primarily attributed to the increasing adoption of home theatre system, decreasing price of large-size models, and increasing demand for premium viewing experience. With consumers demanding more cinematic space at home, this category should experience considerable growth.
By Distribution Channel
Online distribution channels held the largest share of the Smart TV market in 2023, with a 54.9% share. Significant growth in sales was fueled by the ongoing trend towards e-commerce channels with strategic pricing, discounts, and home delivery. At the same time, buyers experience greater choice, product reviews in detail, and seamless comparison between products through the internet. Another aspect that added to the online sales boom was the digital marketing strategies and influencer promotions.
It is anticipated that the Offline channel will be the highest CAGR from 2024 to 2032 Those in search of advice customized to their needs, a chance to test products, and the ability to make a purchase then and there, still favor physical shops. To get offline growth back on track, retailers are also working on better experiences inside the store, including better display, interactive demos, and better support to customers.
By Technology
LED dominance in the Smart TV market, with 58.7% market share in 2023. Because of reasons such as low cost, minimum power consumption, and variety of screen sizes, LED TVs have the largest share of the market. LED technology is also influencing the mass market for the better the ability to produce brighter displays, along with a broader and more accurate color gamut, has made this bright-display technology ubiquitous throughout the budget to premium buyer segments, too. Local dimming and improved HDR support are other recent developments that have helped secure LED TV adoption.
From 2024 to 2032, it is anticipated that OLED will be the fastest-growing segment in terms of revenue CAGR. Because OLED TVs have better picture quality than regular LED TVs, producing deeper blacks, higher contrast ratios, and wider viewing angles, they are the best solution for setting up high-end home entertainment displays. With prices for OLED continuing to drop and consumers increasingly seeking more immersive viewing experiences, this area is likely to grow quickly in the next few years.
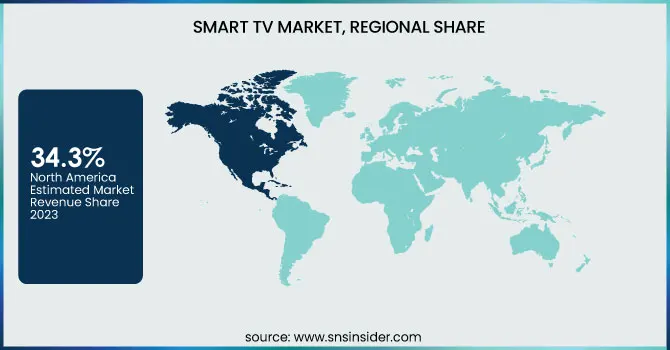
Asia Pacific led the Smart TV Market Share with a massive 34.3% share of the overall marketing in 2023. The expansion is fueled by increasing disposable income, rapid urbanization, and the growing development of digital frameworks in countries including China, India, and Japan. Chinese companies TCL and Hisense are examples of this, successfully growing as some of the largest Smart TV manufacturers around by providing themselves with loaded but affordable products. Brands like Xiaomi, OnePlus, and Samsung have built a huge momentum around affordable Smart TVs with built-in streaming in India. Market growth has soared due to the numerous local manufacturers in the region, and the high demand for home entertainment.
Europe is expected to register the fastest CAGR from 2024 to 2032. This is driven by increasing demand for premium TV models as consumers have developed a growing taste for advanced display technologies like OLED and QLED. A well-known example is brands such as LG, Sony, and Philips dominate the European market with high-end Smart TVs (including Dolby Vision, voice control, etc). Additionally, the concentration of energy efficiency and sustainable electronics among Europeans is driving consumers to replace old traditional televisions with new Smart TVs, which, in turn, propels market expansion.
Get Customized Report as per Your Business Requirement - Enquiry Now
Some of the major players in the Smart TV Market are:
Samsung Electronics (Samsung Neo QLED)
LG Electronics (LG OLED C3)
Sony Corporation (Sony Bravia XR)
TCL Corporation (TCL Q Class)
Hisense (Hisense U8H)
Vizio Inc. (Vizio M-Series)
Panasonic Corporation (Panasonic JX940)
Philips (TP Vision) (Philips OLED+937)
Sharp Corporation (Sharp AQUOS)
Xiaomi Corporation (Xiaomi TV Q2)
Skyworth (Skyworth Q71)
Haier Group (Haier LE Series)
Toshiba Corporation (Toshiba C350 Series)
Insignia (Best Buy) (Insignia F30)
OnePlus (OnePlus Q2 Pro)
In January 2024, Samsung launched its 2024 lineup featuring Neo QLED, MICRO LED, OLED, and Lifestyle Displays, integrating advanced AI features to enhance viewing experiences and smart connectivity.
In January 2024, LG introduced its newest OLED evo TV lineup at CES 2024, featuring enhanced brightness, improved picture quality, and advanced AI capabilities for an immersive viewing experience.
| Report Attributes | Details |
|---|---|
| Market Size in 2023 | USD 201.27 Billion |
| Market Size by 2032 | USD 628.67 Billion |
| CAGR | CAGR of 13.53% From 2024 to 2032 |
| Base Year | 2023 |
| Forecast Period | 2024-2032 |
| Historical Data | 2020-2022 |
| Report Scope & Coverage | Market Size, Segments Analysis, Competitive Landscape, Regional Analysis, DROC & SWOT Analysis, Forecast Outlook |
| Key Segments | • By Operating System (Android TV, Tizen, WebOS, Roku, Other) • By Resolution (4K UHD TV, HDTV, Full HD TV, 8K TV) • By Screen Size (Below 32 inches, 32 to 45 inches, 46 to 55 inches, 56 to 65 inches, Above 65 inches) • By Distribution Channel (Online, Offline) • By Technology (OLED, QLED, LED, Others) |
| Regional Analysis/Coverage | North America (US, Canada, Mexico), Europe (Eastern Europe [Poland, Romania, Hungary, Turkey, Rest of Eastern Europe] Western Europe] Germany, France, UK, Italy, Spain, Netherlands, Switzerland, Austria, Rest of Western Europe]), Asia Pacific (China, India, Japan, South Korea, Vietnam, Singapore, Australia, Rest of Asia Pacific), Middle East & Africa (Middle East [UAE, Egypt, Saudi Arabia, Qatar, Rest of Middle East], Africa [Nigeria, South Africa, Rest of Africa], Latin America (Brazil, Argentina, Colombia, Rest of Latin America) |
| Company Profiles | Samsung Electronics, LG Electronics, Sony Corporation, TCL Corporation, Hisense, Vizio Inc., Panasonic Corporation, Philips (TP Vision), Sharp Corporation, Xiaomi Corporation, Skyworth, Haier Group, Toshiba Corporation, Insignia (Best Buy), OnePlus. |
Ans: The Smart TV Market is expected to grow at a CAGR of 13.53%.
Ans: Smart TV Market size was USD 201.27 billion in 2023 and is expected to Reach USD 628.67 billion by 2032.
Ans: The major key drivers for the growth of the Smart TV market include rising demand for 4K and 8K content, increasing OTT platform adoption, AI-driven features, and expanding smart home integration.
Ans: The Android TV segment dominated the Smart TV market in 2023.
Ans: In 2023, the Asia Pacific region led the Smart TV market, capturing approximately 34.39% of the total market share.
1. Introduction
1.1 Market Definition
1.2 Scope (Inclusion and Exclusions)
1.3 Research Assumptions
2. Executive Summary
2.1 Market Overview
2.2 Regional Synopsis
2.3 Competitive Summary
3. Research Methodology
3.1 Top-Down Approach
3.2 Bottom-up Approach
3.3. Data Validation
3.4 Primary Interviews
4. Market Dynamics Impact Analysis
4.1 Market Driving Factors Analysis
4.1.1 Drivers
4.1.2 Restraints
4.1.3 Opportunities
4.1.4 Challenges
4.2 PESTLE Analysis
4.3 Porter’s Five Forces Model
5. Statistical Insights and Trends Reporting
5.1 Product Performance Metrics
5.2 Innovation & Technology Metrics
5.3 Smart Home & Connectivity
5.4 Usage Analytics & Technical Metrics
6. Competitive Landscape
6.1 List of Major Companies, By Region
6.2 Market Share Analysis, By Region
6.3 Product Benchmarking
6.3.1 Product specifications and features
6.3.2 Pricing
6.4 Strategic Initiatives
6.4.1 Marketing and promotional activities
6.4.2 Distribution and Supply Chain Strategies
6.4.3 Expansion plans and new product launches
6.4.4 Strategic partnerships and collaborations
6.5 Technological Advancements
6.6 Market Positioning and Branding
7. Smart TV Market Segmentation, By Operating System
7.1 Chapter Overview
7.2 Android TV
7.2.1 Android TV Market Trends Analysis (2020-2032)
7.2.2 Android TV Market Size Estimates and Forecasts to 2032 (USD Billion)
7.3 Tizen
7.3.1 Tizen Market Trends Analysis (2020-2032)
7.3.2 Tizen Market Size Estimates and Forecasts to 2032 (USD Billion)
7.4 WebOS
7.4.1 WebOS Market Trends Analysis (2020-2032)
7.4.2 WebOS Market Size Estimates and Forecasts to 2032 (USD Billion)
7.4 Roku
7.4.1 Roku Market Trends Analysis (2020-2032)
7.4.2 Roku Market Size Estimates and Forecasts to 2032 (USD Billion)
7.4 Other
7.4.1 Other Market Trends Analysis (2020-2032)
7.4.2 Other Market Size Estimates and Forecasts to 2032 (USD Billion)
8. Smart TV Market Segmentation, By Resolution
8.1 Chapter Overview
8.2 4K UHD TV
8.2.1 4K UHD TV Market Trends Analysis (2020-2032)
8.2.2 4K UHD TV Market Size Estimates And Forecasts To 2032 (USD Billion)
8.3 HDTV
8.3.1 HDTV Market Trends Analysis (2020-2032)
8.3.2 HDTV Market Size Estimates And Forecasts To 2032 (USD Billion)
8.4 Full HD TV
8.4.1 Full HD TV Market Trends Analysis (2020-2032)
8.4.2 Full HD TV Market Size Estimates And Forecasts To 2032 (USD Billion)
8.5 8K TV
8.5.1 8K TV Market Trends Analysis (2020-2032)
8.5.2 8K TV Market Size Estimates And Forecasts To 2032 (USD Billion)
9. Smart TV Market Segmentation, By Screen Size
9.1 Chapter Overview
9.2 Below 32 inches
9.2.1 Below 32 inches Market Trends Analysis (2020-2032)
9.2.2 Below 32 inches Market Size Estimates And Forecasts To 2032 (USD Billion)
9.3 32 to 45 inches
9.3.1 32 to 45 inches Market Trends Analysis (2020-2032)
9.3.2 32 to 45 inches Market Size Estimates And Forecasts To 2032 (USD Billion)
9.4 46 to 55 inches
9.4.1 46 to 55 inches Market Trends Analysis (2020-2032)
9.4.2 46 to 55 inches Market Size Estimates And Forecasts To 2032 (USD Billion)
9.5 56 to 65 inches
9.5.1 56 to 65 inches Market Trends Analysis (2020-2032)
9.5.2 56 to 65 inches Market Size Estimates And Forecasts To 2032 (USD Billion)
9.6 Above 65 inches
9.6.1 Above 65 inches Market Trends Analysis (2020-2032)
9.6.2 Above 65 inches Market Size Estimates And Forecasts To 2032 (USD Billion)
10. Smart TV Market Segmentation, By Distribution Channel
10.1 Chapter Overview
10.2 Online
10.2.1 Online Market Trends Analysis (2020-2032)
10.2.2 Online Market Size Estimates And Forecasts To 2032 (USD Billion)
10.3 Offline
10.3.1 Offline Market Trends Analysis (2020-2032)
10.3.2 Offline Market Size Estimates And Forecasts To 2032 (USD Billion)
11. Smart TV Market Segmentation, By Technology
11.1 Chapter Overview
11.2 OLED
11.2.1 OLED Market Trends Analysis (2020-2032)
11.2.2 OLED Market Size Estimates And Forecasts To 2032 (USD Billion)
11.3 QLED
11.3.1 QLED Market Trends Analysis (2020-2032)
11.3.2 QLED Market Size Estimates And Forecasts To 2032 (USD Billion)
11.4 LED
11.4.1 LED Market Trends Analysis (2020-2032)
11.4.2 LED Market Size Estimates And Forecasts To 2032 (USD Billion)
11.5 Others
11.5.1 Others Market Trends Analysis (2020-2032)
11.5.2 Others Market Size Estimates And Forecasts To 2032 (USD Billion)
12. Regional Analysis
12.1 Chapter Overview
12.2 North America
12.2.1 Trends Analysis
12.2.2 North America Smart TV Market Estimates And Forecasts, By Country (2020-2032) (USD Billion)
12.2.3 North America Smart TV Market Estimates And Forecasts, By Operating System (2020-2032) (USD Billion)
12.2.4 North America Smart TV Market Estimates And Forecasts, By Resolution (2020-2032) (USD Billion)
12.2.5 North America Smart TV Market Estimates And Forecasts, By Screen Size (2020-2032) (USD Billion)
12.2.6 North America Smart TV Market Estimates And Forecasts, By Distribution Channel (2020-2032) (USD Billion)
12.2.7 North America Smart TV Market Estimates And Forecasts, By Technology (2020-2032) (USD Billion)
12.2.8 USA
12.2.8.1 USA Smart TV Market Estimates And Forecasts, By Operating System (2020-2032) (USD Billion)
12.2.8.2 USA Smart TV Market Estimates And Forecasts, By Resolution (2020-2032) (USD Billion)
12.2.8.3 USA Smart TV Market Estimates And Forecasts, By Screen Size (2020-2032) (USD Billion)
12.2.8.4 USA Smart TV Market Estimates And Forecasts, By Distribution Channel (2020-2032) (USD Billion)
12.2.8.5 USA Smart TV Market Estimates And Forecasts, By Technology (2020-2032) (USD Billion)
12.2.9 Canada
12.2.9.1 Canada Smart TV Market Estimates And Forecasts, By Operating System (2020-2032) (USD Billion)
12.2.9.2 Canada Smart TV Market Estimates And Forecasts, By Resolution (2020-2032) (USD Billion)
12.2.9.3 Canada Smart TV Market Estimates And Forecasts, By Screen Size (2020-2032) (USD Billion)
12.2.9.4 Canada Smart TV Market Estimates And Forecasts, By Distribution Channel (2020-2032) (USD Billion)
12.2.9.5 Canada Smart TV Market Estimates And Forecasts, By Technology (2020-2032) (USD Billion)
12.2.10 Mexico
12.2.10.1 Mexico Smart TV Market Estimates And Forecasts, By Operating System (2020-2032) (USD Billion)
12.2.10.2 Mexico Smart TV Market Estimates And Forecasts, By Resolution (2020-2032) (USD Billion)
12.2.10.3 Mexico Smart TV Market Estimates And Forecasts, By Screen Size (2020-2032) (USD Billion)
12.2.10.4 Mexico Smart TV Market Estimates And Forecasts, By Distribution Channel (2020-2032) (USD Billion)
12.2.10.5 Mexico Smart TV Market Estimates And Forecasts, By Technology (2020-2032) (USD Billion)
12.3 Europe
12.3.1 Eastern Europe
12.3.1.1 Trends Analysis
12.3.1.2 Eastern Europe Smart TV Market Estimates And Forecasts, By Country (2020-2032) (USD Billion)
12.3.1.3 Eastern Europe Smart TV Market Estimates And Forecasts, By Operating System (2020-2032) (USD Billion)
12.3.1.4 Eastern Europe Smart TV Market Estimates And Forecasts, By Resolution (2020-2032) (USD Billion)
12.3.1.5 Eastern Europe Smart TV Market Estimates And Forecasts, By Screen Size (2020-2032) (USD Billion)
12.3.1.6 Eastern Europe Smart TV Market Estimates And Forecasts, By Distribution Channel (2020-2032) (USD Billion)
12.3.1.7 Eastern Europe Smart TV Market Estimates And Forecasts, By Technology (2020-2032) (USD Billion)
12.3.1.8 Poland
12.3.1.8.1 Poland Smart TV Market Estimates And Forecasts, By Operating System (2020-2032) (USD Billion)
12.3.1.8.2 Poland Smart TV Market Estimates And Forecasts, By Resolution (2020-2032) (USD Billion)
12.3.1.8.3 Poland Smart TV Market Estimates And Forecasts, By Screen Size (2020-2032) (USD Billion)
12.3.1.8.4 Poland Smart TV Market Estimates And Forecasts, By Distribution Channel (2020-2032) (USD Billion)
12.3.1.8.5 Poland Smart TV Market Estimates And Forecasts, By Technology (2020-2032) (USD Billion)
12.3.1.9 Romania
12.3.1.9.1 Romania Smart TV Market Estimates And Forecasts, By Operating System (2020-2032) (USD Billion)
12.3.1.9.2 Romania Smart TV Market Estimates And Forecasts, By Resolution (2020-2032) (USD Billion)
12.3.1.9.3 Romania Smart TV Market Estimates And Forecasts, By Screen Size (2020-2032) (USD Billion)
12.3.1.9.4 Romania Smart TV Market Estimates And Forecasts, By Distribution Channel (2020-2032) (USD Billion)
12.3.1.9.5 Romania Smart TV Market Estimates And Forecasts, By Technology (2020-2032) (USD Billion)
12.3.1.10 Hungary
12.3.1.10.1 Hungary Smart TV Market Estimates And Forecasts, By Operating System (2020-2032) (USD Billion)
12.3.1.10.2 Hungary Smart TV Market Estimates And Forecasts, By Resolution (2020-2032) (USD Billion)
12.3.1.10.3 Hungary Smart TV Market Estimates And Forecasts, By Screen Size (2020-2032) (USD Billion)
12.3.1.10.4 Hungary Smart TV Market Estimates And Forecasts, By Distribution Channel (2020-2032) (USD Billion)
12.3.1.10.5 Hungary Smart TV Market Estimates And Forecasts, By Technology (2020-2032) (USD Billion)
12.3.1.11 Turkey
12.3.1.11.1 Turkey Smart TV Market Estimates And Forecasts, By Operating System (2020-2032) (USD Billion)
12.3.1.11.2 Turkey Smart TV Market Estimates And Forecasts, By Resolution (2020-2032) (USD Billion)
12.3.1.11.3 Turkey Smart TV Market Estimates And Forecasts, By Screen Size (2020-2032) (USD Billion)
12.3.1.11.4 Turkey Smart TV Market Estimates And Forecasts, By Distribution Channel (2020-2032) (USD Billion)
12.3.1.11.5 Turkey Smart TV Market Estimates And Forecasts, By Technology (2020-2032) (USD Billion)
12.3.1.12 Rest Of Eastern Europe
12.3.1.12.1 Rest Of Eastern Europe Smart TV Market Estimates And Forecasts, By Operating System (2020-2032) (USD Billion)
12.3.1.12.2 Rest Of Eastern Europe Smart TV Market Estimates And Forecasts, By Resolution (2020-2032) (USD Billion)
12.3.1.12.3 Rest Of Eastern Europe Smart TV Market Estimates And Forecasts, By Screen Size (2020-2032) (USD Billion)
12.3.1.12.4 Rest Of Eastern Europe Smart TV Market Estimates And Forecasts, By Distribution Channel (2020-2032) (USD Billion)
12.3.1.12.5 Rest Of Eastern Europe Smart TV Market Estimates And Forecasts, By Technology (2020-2032) (USD Billion)
12.3.2 Western Europe
12.3.2.1 Trends Analysis
12.3.2.2 Western Europe Smart TV Market Estimates And Forecasts, By Country (2020-2032) (USD Billion)
12.3.2.3 Western Europe Smart TV Market Estimates And Forecasts, By Operating System (2020-2032) (USD Billion)
12.3.2.4 Western Europe Smart TV Market Estimates And Forecasts, By Resolution (2020-2032) (USD Billion)
12.3.2.5 Western Europe Smart TV Market Estimates And Forecasts, By Screen Size (2020-2032) (USD Billion)
12.3.2.6 Western Europe Smart TV Market Estimates And Forecasts, By Distribution Channel (2020-2032) (USD Billion)
12.3.2.7 Western Europe Smart TV Market Estimates And Forecasts, By Technology (2020-2032) (USD Billion)
12.3.2.8 Germany
12.3.2.8.1 Germany Smart TV Market Estimates And Forecasts, By Operating System (2020-2032) (USD Billion)
12.3.2.8.2 Germany Smart TV Market Estimates And Forecasts, By Resolution (2020-2032) (USD Billion)
12.3.2.8.3 Germany Smart TV Market Estimates And Forecasts, By Screen Size (2020-2032) (USD Billion)
12.3.2.8.4 Germany Smart TV Market Estimates And Forecasts, By Distribution Channel (2020-2032) (USD Billion)
12.3.2.8.5 Germany Smart TV Market Estimates And Forecasts, By Technology (2020-2032) (USD Billion)
12.3.2.9 France
12.3.2.9.1 France Smart TV Market Estimates And Forecasts, By Operating System (2020-2032) (USD Billion)
12.3.2.9.2 France Smart TV Market Estimates And Forecasts, By Resolution (2020-2032) (USD Billion)
12.3.2.9.3 France Smart TV Market Estimates And Forecasts, By Screen Size (2020-2032) (USD Billion)
12.3.2.9.4 France Smart TV Market Estimates And Forecasts, By Distribution Channel (2020-2032) (USD Billion)
12.3.2.9.5 France Smart TV Market Estimates And Forecasts, By Technology (2020-2032) (USD Billion)
12.3.2.10 UK
12.3.2.10.1 UK Smart TV Market Estimates And Forecasts, By Operating System (2020-2032) (USD Billion)
12.3.2.10.2 UK Smart TV Market Estimates And Forecasts, By Resolution (2020-2032) (USD Billion)
12.3.2.10.3 UK Smart TV Market Estimates And Forecasts, By Screen Size (2020-2032) (USD Billion)
12.3.2.10.4 UK Smart TV Market Estimates And Forecasts, By Distribution Channel (2020-2032) (USD Billion)
12.3.2.10.5 UK Smart TV Market Estimates And Forecasts, By Technology (2020-2032) (USD Billion)
12.3.2.11 Italy
12.3.2.11.1 Italy Smart TV Market Estimates And Forecasts, By Operating System (2020-2032) (USD Billion)
12.3.2.11.2 Italy Smart TV Market Estimates And Forecasts, By Resolution (2020-2032) (USD Billion)
12.3.2.11.3 Italy Smart TV Market Estimates And Forecasts, By Screen Size (2020-2032) (USD Billion)
12.3.2.11.4 Italy Smart TV Market Estimates And Forecasts, By Distribution Channel (2020-2032) (USD Billion)
12.3.2.11.5 Italy Smart TV Market Estimates And Forecasts, By Technology (2020-2032) (USD Billion)
12.3.2.12 Spain
12.3.2.12.1 Spain Smart TV Market Estimates And Forecasts, By Operating System (2020-2032) (USD Billion)
12.3.2.12.2 Spain Smart TV Market Estimates And Forecasts, By Resolution (2020-2032) (USD Billion)
12.3.2.12.3 Spain Smart TV Market Estimates And Forecasts, By Screen Size (2020-2032) (USD Billion)
12.3.2.12.4 Spain Smart TV Market Estimates And Forecasts, By Distribution Channel (2020-2032) (USD Billion)
12.3.2.12.5 Spain Smart TV Market Estimates And Forecasts, By Technology (2020-2032) (USD Billion)
12.3.2.13 Netherlands
12.3.2.13.1 Netherlands Smart TV Market Estimates And Forecasts, By Operating System (2020-2032) (USD Billion)
12.3.2.13.2 Netherlands Smart TV Market Estimates And Forecasts, By Resolution (2020-2032) (USD Billion)
12.3.2.13.3 Netherlands Smart TV Market Estimates And Forecasts, By Screen Size (2020-2032) (USD Billion)
12.3.2.13.4 Netherlands Smart TV Market Estimates And Forecasts, By Distribution Channel (2020-2032) (USD Billion)
12.3.2.13.5 Netherlands Smart TV Market Estimates And Forecasts, By Technology (2020-2032) (USD Billion)
12.3.2.14 Switzerland
12.3.2.14.1 Switzerland Smart TV Market Estimates And Forecasts, By Operating System (2020-2032) (USD Billion)
12.3.2.14.2 Switzerland Smart TV Market Estimates And Forecasts, By Resolution (2020-2032) (USD Billion)
12.3.2.14.3 Switzerland Smart TV Market Estimates And Forecasts, By Screen Size (2020-2032) (USD Billion)
12.3.2.14.4 Switzerland Smart TV Market Estimates And Forecasts, By Distribution Channel (2020-2032) (USD Billion)
12.3.2.12.5 Switzerland Smart TV Market Estimates And Forecasts, By Technology (2020-2032) (USD Billion)
12.3.2.15 Austria
12.3.2.15.1 Austria Smart TV Market Estimates And Forecasts, By Operating System (2020-2032) (USD Billion)
12.3.2.15.2 Austria Smart TV Market Estimates And Forecasts, By Resolution (2020-2032) (USD Billion)
12.3.2.15.3 Austria Smart TV Market Estimates And Forecasts, By Screen Size (2020-2032) (USD Billion)
12.3.2.15.4 Austria Smart TV Market Estimates And Forecasts, By Distribution Channel (2020-2032) (USD Billion)
12.3.2.15.5 Austria Smart TV Market Estimates And Forecasts, By Technology (2020-2032) (USD Billion)
12.3.2.16 Rest Of Western Europe
12.3.2.16.1 Rest Of Western Europe Smart TV Market Estimates And Forecasts, By Operating System (2020-2032) (USD Billion)
12.3.2.16.2 Rest Of Western Europe Smart TV Market Estimates And Forecasts, By Resolution (2020-2032) (USD Billion)
12.3.2.16.3 Rest Of Western Europe Smart TV Market Estimates And Forecasts, By Screen Size (2020-2032) (USD Billion)
12.3.2.16.4 Rest Of Western Europe Smart TV Market Estimates And Forecasts, By Distribution Channel (2020-2032) (USD Billion)
12.3.2.16.5 Rest Of Western Europe Smart TV Market Estimates And Forecasts, By Technology (2020-2032) (USD Billion)
12.4 Asia Pacific
12.4.1 Trends Analysis
12.4.2 Asia Pacific Smart TV Market Estimates And Forecasts, By Country (2020-2032) (USD Billion)
12.4.3 Asia Pacific Smart TV Market Estimates And Forecasts, By Operating System (2020-2032) (USD Billion)
12.4.4 Asia Pacific Smart TV Market Estimates And Forecasts, By Resolution (2020-2032) (USD Billion)
12.4.5 Asia Pacific Smart TV Market Estimates And Forecasts, By Screen Size (2020-2032) (USD Billion)
12.4.6 Asia Pacific Smart TV Market Estimates And Forecasts, By Distribution Channel (2020-2032) (USD Billion)
12.4.7 Asia Pacific Smart TV Market Estimates And Forecasts, By Technology (2020-2032) (USD Billion)
12.4.8 China
12.4.8.1 China Smart TV Market Estimates And Forecasts, By Operating System (2020-2032) (USD Billion)
12.4.8.2 China Smart TV Market Estimates And Forecasts, By Resolution (2020-2032) (USD Billion)
12.4.8.3 China Smart TV Market Estimates And Forecasts, By Screen Size (2020-2032) (USD Billion)
12.4.8.4 China Smart TV Market Estimates And Forecasts, By Distribution Channel (2020-2032) (USD Billion)
12.4.8.5 China Smart TV Market Estimates And Forecasts, By Technology (2020-2032) (USD Billion)
12.4.9 India
12.4.9.1 India Smart TV Market Estimates And Forecasts, By Operating System (2020-2032) (USD Billion)
12.4.9.2 India Smart TV Market Estimates And Forecasts, By Resolution (2020-2032) (USD Billion)
12.4.9.3 India Smart TV Market Estimates And Forecasts, By Screen Size (2020-2032) (USD Billion)
12.4.9.4 India Smart TV Market Estimates And Forecasts, By Distribution Channel (2020-2032) (USD Billion)
12.4.9.5 India Smart TV Market Estimates And Forecasts, By Technology (2020-2032) (USD Billion)
12.4.10 Japan
12.4.10.1 Japan Smart TV Market Estimates And Forecasts, By Operating System (2020-2032) (USD Billion)
12.4.10.2 Japan Smart TV Market Estimates And Forecasts, By Resolution (2020-2032) (USD Billion)
12.4.10.3 Japan Smart TV Market Estimates And Forecasts, By Screen Size (2020-2032) (USD Billion)
12.4.10.4 Japan Smart TV Market Estimates And Forecasts, By Distribution Channel (2020-2032) (USD Billion)
12.4.10.5 Japan Smart TV Market Estimates And Forecasts, By Technology (2020-2032) (USD Billion)
12.4.11 South Korea
12.4.11.1 South Korea Smart TV Market Estimates And Forecasts, By Operating System (2020-2032) (USD Billion)
12.4.11.2 South Korea Smart TV Market Estimates And Forecasts, By Resolution (2020-2032) (USD Billion)
12.4.11.3 South Korea Smart TV Market Estimates And Forecasts, By Screen Size (2020-2032) (USD Billion)
12.4.11.4 South Korea Smart TV Market Estimates And Forecasts, By Distribution Channel (2020-2032) (USD Billion)
12.4.11.5 South Korea Smart TV Market Estimates And Forecasts, By Technology (2020-2032) (USD Billion)
12.4.12 Vietnam
12.4.12.1 Vietnam Smart TV Market Estimates And Forecasts, By Operating System (2020-2032) (USD Billion)
12.4.12.2 Vietnam Smart TV Market Estimates And Forecasts, By Resolution (2020-2032) (USD Billion)
12.4.12.3 Vietnam Smart TV Market Estimates And Forecasts, By Screen Size (2020-2032) (USD Billion)
12.4.12.4 Vietnam Smart TV Market Estimates And Forecasts, By Distribution Channel (2020-2032) (USD Billion)
12.4.12.5 Vietnam Smart TV Market Estimates And Forecasts, By Technology (2020-2032) (USD Billion)
12.4.13 Singapore
12.4.13.1 Singapore Smart TV Market Estimates And Forecasts, By Operating System (2020-2032) (USD Billion)
12.4.13.2 Singapore Smart TV Market Estimates And Forecasts, By Resolution (2020-2032) (USD Billion)
12.4.13.3 Singapore Smart TV Market Estimates And Forecasts, By Screen Size (2020-2032) (USD Billion)
12.4.13.4 Singapore Smart TV Market Estimates And Forecasts, By Distribution Channel (2020-2032) (USD Billion)
12.4.13.5 Singapore Smart TV Market Estimates And Forecasts, By Technology (2020-2032) (USD Billion)
12.4.14 Australia
12.4.14.1 Australia Smart TV Market Estimates And Forecasts, By Operating System (2020-2032) (USD Billion)
12.4.14.2 Australia Smart TV Market Estimates And Forecasts, By Resolution (2020-2032) (USD Billion)
12.4.14.3 Australia Smart TV Market Estimates And Forecasts, By Screen Size (2020-2032) (USD Billion)
12.4.14.4 Australia Smart TV Market Estimates And Forecasts, By Distribution Channel (2020-2032) (USD Billion)
12.4.14.5 Australia Smart TV Market Estimates And Forecasts, By Technology (2020-2032) (USD Billion)
12.4.15 Rest Of Asia Pacific
12.4.15.1 Rest Of Asia Pacific Smart TV Market Estimates And Forecasts, By Operating System (2020-2032) (USD Billion)
12.4.15.2 Rest Of Asia Pacific Smart TV Market Estimates And Forecasts, By Resolution (2020-2032) (USD Billion)
12.4.15.3 Rest Of Asia Pacific Smart TV Market Estimates And Forecasts, By Screen Size (2020-2032) (USD Billion)
12.4.15.4 Rest Of Asia Pacific Smart TV Market Estimates And Forecasts, By Distribution Channel (2020-2032) (USD Billion)
12.4.15.5 Rest Of Asia Pacific Smart TV Market Estimates And Forecasts, By Technology (2020-2032) (USD Billion)
12.5 Middle East And Africa
12.5.1 Middle East
12.5.1.1 Trends Analysis
12.5.1.2 Middle East Smart TV Market Estimates And Forecasts, By Country (2020-2032) (USD Billion)
12.5.1.3 Middle East Smart TV Market Estimates And Forecasts, By Operating System (2020-2032) (USD Billion)
12.5.1.4 Middle East Smart TV Market Estimates And Forecasts, By Resolution (2020-2032) (USD Billion)
12.5.1.5 Middle East Smart TV Market Estimates And Forecasts, By Screen Size (2020-2032) (USD Billion)
12.5.1.6 Middle East Smart TV Market Estimates And Forecasts, By Distribution Channel (2020-2032) (USD Billion)
12.5.1.7 Middle East Smart TV Market Estimates And Forecasts, By Technology (2020-2032) (USD Billion)
12.5.1.8 UAE
12.5.1.8.1 UAE Smart TV Market Estimates And Forecasts, By Operating System (2020-2032) (USD Billion)
12.5.1.8.2 UAE Smart TV Market Estimates And Forecasts, By Resolution (2020-2032) (USD Billion)
12.5.1.8.3 UAE Smart TV Market Estimates And Forecasts, By Screen Size (2020-2032) (USD Billion)
12.5.1.8.4 UAE Smart TV Market Estimates And Forecasts, By Distribution Channel (2020-2032) (USD Billion)
12.5.1.8.5 UAE Smart TV Market Estimates And Forecasts, By Technology (2020-2032) (USD Billion)
12.5.1.9 Egypt
12.5.1.9.1 Egypt Smart TV Market Estimates And Forecasts, By Operating System (2020-2032) (USD Billion)
12.5.1.9.2 Egypt Smart TV Market Estimates And Forecasts, By Resolution (2020-2032) (USD Billion)
12.5.1.9.3 Egypt Smart TV Market Estimates And Forecasts, By Screen Size (2020-2032) (USD Billion)
12.5.1.9.4 Egypt Smart TV Market Estimates And Forecasts, By Distribution Channel (2020-2032) (USD Billion)
12.5.1.9.5 Egypt Smart TV Market Estimates And Forecasts, By Technology (2020-2032) (USD Billion)
12.5.1.10 Saudi Arabia
12.5.1.10.1 Saudi Arabia Smart TV Market Estimates And Forecasts, By Operating System (2020-2032) (USD Billion)
12.5.1.10.2 Saudi Arabia Smart TV Market Estimates And Forecasts, By Resolution (2020-2032) (USD Billion)
12.5.1.10.3 Saudi Arabia Smart TV Market Estimates And Forecasts, By Screen Size (2020-2032) (USD Billion)
12.5.1.10.4 Saudi Arabia Smart TV Market Estimates And Forecasts, By Distribution Channel (2020-2032) (USD Billion)
12.5.1.10.5 Saudi Arabia Smart TV Market Estimates And Forecasts, By Technology (2020-2032) (USD Billion)
12.5.1.11 Qatar
12.5.1.11.1 Qatar Smart TV Market Estimates And Forecasts, By Operating System (2020-2032) (USD Billion)
12.5.1.11.2 Qatar Smart TV Market Estimates And Forecasts, By Resolution (2020-2032) (USD Billion)
12.5.1.11.3 Qatar Smart TV Market Estimates And Forecasts, By Screen Size (2020-2032) (USD Billion)
12.5.1.11.4 Qatar Smart TV Market Estimates And Forecasts, By Distribution Channel (2020-2032) (USD Billion)
12.5.1.11.5 Qatar Smart TV Market Estimates And Forecasts, By Technology (2020-2032) (USD Billion)
12.5.1.12 Rest Of Middle East
12.5.1.12.1 Rest Of Middle East Smart TV Market Estimates And Forecasts, By Operating System (2020-2032) (USD Billion)
12.5.1.12.2 Rest Of Middle East Smart TV Market Estimates And Forecasts, By Resolution (2020-2032) (USD Billion)
12.5.1.12.3 Rest Of Middle East Smart TV Market Estimates And Forecasts, By Screen Size (2020-2032) (USD Billion)
12.5.1.12.4 Rest Of Middle East Smart TV Market Estimates And Forecasts, By Distribution Channel (2020-2032) (USD Billion)
12.5.1.12.5 Rest Of Middle East Smart TV Market Estimates And Forecasts, By Technology (2020-2032) (USD Billion)
12.5.2 Africa
12.5.2.1 Trends Analysis
12.5.2.2 Africa Smart TV Market Estimates And Forecasts, By Country (2020-2032) (USD Billion)
12.5.2.3 Africa Smart TV Market Estimates And Forecasts, By Operating System (2020-2032) (USD Billion)
12.5.2.4 Africa Smart TV Market Estimates And Forecasts, By Resolution (2020-2032) (USD Billion)
12.5.2.5 Africa Smart TV Market Estimates And Forecasts, By Screen Size (2020-2032) (USD Billion)
12.5.2.6 Africa Smart TV Market Estimates And Forecasts, By Distribution Channel (2020-2032) (USD Billion)
12.5.2.7 Africa Smart TV Market Estimates And Forecasts, By Technology (2020-2032) (USD Billion)
12.5.2.8 South Africa
12.5.2.8.1 South Africa Smart TV Market Estimates And Forecasts, By Operating System (2020-2032) (USD Billion)
12.5.2.8.2 South Africa Smart TV Market Estimates And Forecasts, By Resolution (2020-2032) (USD Billion)
12.5.2.8.3 South Africa Smart TV Market Estimates And Forecasts, By Screen Size (2020-2032) (USD Billion)
12.5.2.8.4 South Africa Smart TV Market Estimates And Forecasts, By Distribution Channel (2020-2032) (USD Billion)
12.5.2.8.5 South Africa Smart TV Market Estimates And Forecasts, By Technology (2020-2032) (USD Billion)
12.5.2.9 Nigeria
12.5.2.9.1 Nigeria Smart TV Market Estimates And Forecasts, By Operating System (2020-2032) (USD Billion)
12.5.2.9.2 Nigeria Smart TV Market Estimates And Forecasts, By Resolution (2020-2032) (USD Billion)
12.5.2.9.3 Nigeria Smart TV Market Estimates And Forecasts, By Screen Size (2020-2032) (USD Billion)
12.5.2.9.4 Nigeria Smart TV Market Estimates And Forecasts, By Distribution Channel (2020-2032) (USD Billion)
12.5.2.9.5 Nigeria Smart TV Market Estimates And Forecasts, By Technology (2020-2032) (USD Billion)
12.5.2.10 Rest Of Africa
12.5.2.10.1 Rest Of Africa Smart TV Market Estimates And Forecasts, By Operating System (2020-2032) (USD Billion)
12.5.2.10.2 Rest Of Africa Smart TV Market Estimates And Forecasts, By Resolution (2020-2032) (USD Billion)
12.5.2.10.3 Rest Of Africa Smart TV Market Estimates And Forecasts, By Screen Size (2020-2032) (USD Billion)
12.5.2.10.4 Rest Of Africa Smart TV Market Estimates And Forecasts, By Distribution Channel (2020-2032) (USD Billion)
12.5.2.10.5 Rest Of Africa Smart TV Market Estimates And Forecasts, By Technology (2020-2032) (USD Billion)
12.6 Latin America
12.6.1 Trends Analysis
12.6.2 Latin America Smart TV Market Estimates And Forecasts, By Country (2020-2032) (USD Billion)
12.6.3 Latin America Smart TV Market Estimates And Forecasts, By Operating System (2020-2032) (USD Billion)
12.6.4 Latin America Smart TV Market Estimates And Forecasts, By Resolution (2020-2032) (USD Billion)
12.6.5 Latin America Smart TV Market Estimates And Forecasts, By Screen Size (2020-2032) (USD Billion)
12.6.6 Latin America Smart TV Market Estimates And Forecasts, By Distribution Channel (2020-2032) (USD Billion)
12.6.7 Latin America Smart TV Market Estimates And Forecasts, By Technology (2020-2032) (USD Billion)
12.6.8 Brazil
12.6.8.1 Brazil Smart TV Market Estimates And Forecasts, By Operating System (2020-2032) (USD Billion)
12.6.8.2 Brazil Smart TV Market Estimates And Forecasts, By Resolution (2020-2032) (USD Billion)
12.6.8.3 Brazil Smart TV Market Estimates And Forecasts, By Screen Size (2020-2032) (USD Billion)
12.6.8.4 Brazil Smart TV Market Estimates And Forecasts, By Distribution Channel (2020-2032) (USD Billion)
12.6.8.5 Brazil Smart TV Market Estimates And Forecasts, By Technology (2020-2032) (USD Billion)
12.6.9 Argentina
12.6.9.1 Argentina Smart TV Market Estimates And Forecasts, By Operating System (2020-2032) (USD Billion)
12.6.9.2 Argentina Smart TV Market Estimates And Forecasts, By Resolution (2020-2032) (USD Billion)
12.6.9.3 Argentina Smart TV Market Estimates And Forecasts, By Screen Size (2020-2032) (USD Billion)
12.6.9.4 Argentina Smart TV Market Estimates And Forecasts, By Distribution Channel (2020-2032) (USD Billion)
12.6.9.5 Argentina Smart TV Market Estimates And Forecasts, By Technology (2020-2032) (USD Billion)
12.6.10 Colombia
12.6.10.1 Colombia Smart TV Market Estimates And Forecasts, By Operating System (2020-2032) (USD Billion)
12.6.10.2 Colombia Smart TV Market Estimates And Forecasts, By Resolution (2020-2032) (USD Billion)
12.6.10.3 Colombia Smart TV Market Estimates And Forecasts, By Screen Size (2020-2032) (USD Billion)
12.6.10.4 Colombia Smart TV Market Estimates And Forecasts, By Distribution Channel (2020-2032) (USD Billion)
12.6.10.5 Colombia Smart TV Market Estimates And Forecasts, By Technology (2020-2032) (USD Billion)
12.6.11 Rest Of Latin America
12.6.11.1 Rest Of Latin America Smart TV Market Estimates And Forecasts, By Operating System (2020-2032) (USD Billion)
12.6.11.2 Rest Of Latin America Smart TV Market Estimates And Forecasts, By Resolution (2020-2032) (USD Billion)
12.6.11.3 Rest Of Latin America Smart TV Market Estimates And Forecasts, By Screen Size (2020-2032) (USD Billion)
12.6.11.4 Rest Of Latin America Smart TV Market Estimates And Forecasts, By Distribution Channel (2020-2032) (USD Billion)
12.6.11.5 Rest Of Latin America Smart TV Market Estimates And Forecasts, By Technology (2020-2032) (USD Billion)
13. Company Profiles
13.1 Samsung Electronics
13.1.1 Company Overview
13.1.2 Financial
13.1.3 Products/ Services Offered
13.1.4 SWOT Analysis
13.2 LG Electronics
13.2.1 Company Overview
13.2.2 Financial
13.2.3 Products/ Services Offered
13.2.4 SWOT Analysis
13.3 Sony Corporation
13.3.1 Company Overview
13.3.2 Financial
13.3.3 Products/ Services Offered
13.3.4 SWOT Analysis
13.4 TCL Corporation
13.4.1 Company Overview
13.4.2 Financial
13.4.3 Products/ Services Offered
13.4.4 SWOT Analysis
13.5 Hisense
13.5.1 Company Overview
13.5.2 Financial
13.5.3 Products/ Services Offered
13.5.4 SWOT Analysis
13.6 Vizio Inc
13.6.1 Company Overview
13.6.2 Financial
13.6.3 Products/ Services Offered
13.6.4 SWOT Analysis
13.7 Panasonic Corporation
13.7.1 Company Overview
13.7.2 Financial
13.7.3 Products/ Services Offered
13.7.4 SWOT Analysis
13.8 Philips (TP Vision)
13.8.1 Company Overview
13.8.2 Financial
13.8.3 Products/ Services Offered
13.8.4 SWOT Analysis
13.9 Sharp Corporation
13.9.1 Company Overview
13.9.2 Financial
13.9.3 Products/ Services Offered
13.9.4 SWOT Analysis
13.10 Xiaomi Corporation
13.10.1 Company Overview
13.10.2 Financial
13.10.3 Products/ Services Offered
13.10.4 SWOT Analysis
14. Use Cases and Best Practices
15. Conclusion
An accurate research report requires proper strategizing as well as implementation. There are multiple factors involved in the completion of good and accurate research report and selecting the best methodology to compete the research is the toughest part. Since the research reports we provide play a crucial role in any company’s decision-making process, therefore we at SNS Insider always believe that we should choose the best method which gives us results closer to reality. This allows us to reach at a stage wherein we can provide our clients best and accurate investment to output ratio.
Each report that we prepare takes a timeframe of 350-400 business hours for production. Starting from the selection of titles through a couple of in-depth brain storming session to the final QC process before uploading our titles on our website we dedicate around 350 working hours. The titles are selected based on their current market cap and the foreseen CAGR and growth.
The 5 steps process:
Step 1: Secondary Research:
Secondary Research or Desk Research is as the name suggests is a research process wherein, we collect data through the readily available information. In this process we use various paid and unpaid databases which our team has access to and gather data through the same. This includes examining of listed companies’ annual reports, Journals, SEC filling etc. Apart from this our team has access to various associations across the globe across different industries. Lastly, we have exchange relationships with various university as well as individual libraries.

Step 2: Primary Research
When we talk about primary research, it is a type of study in which the researchers collect relevant data samples directly, rather than relying on previously collected data. This type of research is focused on gaining content specific facts that can be sued to solve specific problems. Since the collected data is fresh and first hand therefore it makes the study more accurate and genuine.
We at SNS Insider have divided Primary Research into 2 parts.
Part 1 wherein we interview the KOLs of major players as well as the upcoming ones across various geographic regions. This allows us to have their view over the market scenario and acts as an important tool to come closer to the accurate market numbers. As many as 45 paid and unpaid primary interviews are taken from both the demand and supply side of the industry to make sure we land at an accurate judgement and analysis of the market.
This step involves the triangulation of data wherein our team analyses the interview transcripts, online survey responses and observation of on filed participants. The below mentioned chart should give a better understanding of the part 1 of the primary interview.

Part 2: In this part of primary research the data collected via secondary research and the part 1 of the primary research is validated with the interviews from individual consultants and subject matter experts.
Consultants are those set of people who have at least 12 years of experience and expertise within the industry whereas Subject Matter Experts are those with at least 15 years of experience behind their back within the same space. The data with the help of two main processes i.e., FGDs (Focused Group Discussions) and IDs (Individual Discussions). This gives us a 3rd party nonbiased primary view of the market scenario making it a more dependable one while collation of the data pointers.
Step 3: Data Bank Validation
Once all the information is collected via primary and secondary sources, we run that information for data validation. At our intelligence centre our research heads track a lot of information related to the market which includes the quarterly reports, the daily stock prices, and other relevant information. Our data bank server gets updated every fortnight and that is how the information which we collected using our primary and secondary information is revalidated in real time.

Step 4: QA/QC Process
After all the data collection and validation our team does a final level of quality check and quality assurance to get rid of any unwanted or undesired mistakes. This might include but not limited to getting rid of the any typos, duplication of numbers or missing of any important information. The people involved in this process include technical content writers, research heads and graphics people. Once this process is completed the title gets uploader on our platform for our clients to read it.
Step 5: Final QC/QA Process:
This is the last process and comes when the client has ordered the study. In this process a final QA/QC is done before the study is emailed to the client. Since we believe in giving our clients a good experience of our research studies, therefore, to make sure that we do not lack at our end in any way humanly possible we do a final round of quality check and then dispatch the study to the client.
By Operating System
Android TV
Tizen
WebOS
Roku
Other
By Resolution
4K UHD TV
HDTV
Full HD TV
8K TV
By Screen Size
Below 32 inches
32 to 45 inches
46 to 55 inches
56 to 65 inches
Above 65 inches
By Distribution Channel
Online
Offline
By Technology
OLED
QLED
LED
Others
Request for Segment Customization as per your Business Requirement: Segment Customization Request
Regional Coverage:
North America
US
Canada
Mexico
Europe
Eastern Europe
Poland
Romania
Hungary
Turkey
Rest of Eastern Europe
Western Europe
Germany
France
UK
Italy
Spain
Netherlands
Switzerland
Austria
Rest of Western Europe
Asia Pacific
China
India
Japan
South Korea
Vietnam
Singapore
Australia
Rest of Asia Pacific
Middle East & Africa
Middle East
UAE
Egypt
Saudi Arabia
Qatar
Rest of Middle East
Africa
Nigeria
South Africa
Rest of Africa
Latin America
Brazil
Argentina
Colombia
Rest of Latin America
Request for Country Level Research Report: Country Level Customization Request
Available Customization
With the given market data, SNS Insider offers customization as per the company’s specific needs. The following customization options are available for the report:
Detailed Volume Analysis
Criss-Cross segment analysis (e.g. Product X Application)
Competitive Product Benchmarking
Geographic Analysis
Additional countries in any of the regions
Customized Data Representation
Detailed analysis and profiling of additional market players
The Humidity Sensors Market size was valued at USD 2.59 Billion in 2023 and is expected to grow to USD 4.86 Billion by 2032 and grow at a CAGR Of 7.25 % over the forecast period of 2024-2032.
The Microcontroller Unit (MCU) Market Size was valued at USD 32.82 Billion in 2023 and is expected to grow at 9.2% CAGR to reach USD 72.31 Billion by 2032.
The Stadium Lighting Market was valued at USD 584.73 million in 2023 and is expected to reach USD 1138.16 million by 2032, growing at a CAGR of 7.72% over the forecast period 2024-2032.
The Biometric Authentication Identification Market Size was valued at USD 34.23 Billion in 2023 and is expected to grow at a CAGR of 13.57% during 2024-2032
The Semiconductor Metrology and Inspection Equipment Market Size is expected to reach USD 12.36 billion by 2032, grow at a CAGR of 6.50% by Forecast.
The ALD Equipment Market Size was valued at USD 3.90 Billion in 2023 and is expected to reach USD 9.48 Billion by 2032 and grow at a CAGR of 10.43% over the forecast period 2024-2032.

Hi! Click one of our member below to chat on Phone
© 2025 All Rights Reserved by SNS Insider Pvt Ltd


