Get more information on Smart Hospitality Market - Request Sample Report
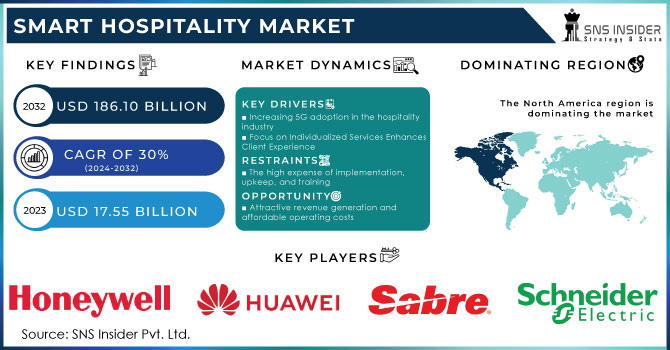
The Smart Hospitality Market is anticipated to increase at a CAGR of 30% from 2024 to 2032, from a value of USD 17.55 billion in 2023 and expected to reach USD 186.10 billion by 2032.
The need for real-time optimal guest experience management, lower operational expenses, and growing interest in IoT are all on the rise, as is the demand for hospitality software and services. These are the main elements that are propelling the development of the smart hospitality market. Smart hospitality is a quickly developing sector that makes use of automated software, intelligent solutions, and mobile devices to enhance customer services. These technologies enable customers to select their rooms, room kinds, and room numbers using their mobile devices, greatly improving the guest experience.
Drivers
Increasing 5G adoption in the hospitality industry
A greater focus is being placed on individualized services to improve the client experience.
Increasing consumer desire for guest-focused, hyperconnected personalization and real-time tailored experiences will boost the market.
Hoteliers have the opportunity to establish a strong and meaningful connection with each guest, ensuring they have a memorable experience and increasing the likelihood of receiving positive reviews. By offering a more personalized and tailored travel experience, hoteliers can enhance their brand reputation, foster customer loyalty, and generate additional revenue. The advent of smart hospitality solutions has revolutionized the industry, providing hoteliers with valuable insights and data on guest behavior. This data can be utilized to gain a comprehensive understanding of each visitor, enabling hoteliers to improve their experience through enhanced customer care. With the help of integrated digital platforms such as Property Management System (PMS) and Customer Relationship Management (CRM), hoteliers can access a centralized dashboard that organizes data from various sources. This not only allows for a personalized view of each guest but also helps alleviate operational burdens. the utilization of these digital platforms can lead to a reduction in hotel operating expenses and an increase in guest retention rates. This, in turn, strengthens the hotel's brand positioning and overall success.
By providing a mobile-centric guest experience that enhances the guest's convenience and self-service, hotels are now also reaping benefits. Hoteliers may design a more connected and convenient stay for their customers by developing a mobile-centric booking experience, providing keyless entry using a mobile device, text-based communications, mobile concierge, etc.
Restraints
Challenges to data security and information sharing.
Need technical persons to effectively handle the software.
The high expense of implementation, upkeep, and training
The adoption of sophisticated hospitality systems, including Property Management Systems (PMS) and Guest Experience Management Systems, entails substantial expenses, regardless of whether they are implemented locally or online. The financial constraints imposed by the aftermath of the pandemic have made it particularly challenging for hotels to invest in smart hospitality solutions. The industry is still grappling with the colossal financial losses incurred during this period. Furthermore, hotels that have already embraced smart technologies have encountered significant maintenance costs. However, it is important to recognize that the cost of deployment is typically associated with the level of complexity involved in integrating these applications.
Opportunities
Real-time, ideal visitor experience management is becoming more and more popular.
Attractive revenue generation and affordable operating costs
expanding the usage of energy management systems with the Internet of Things (IoT)
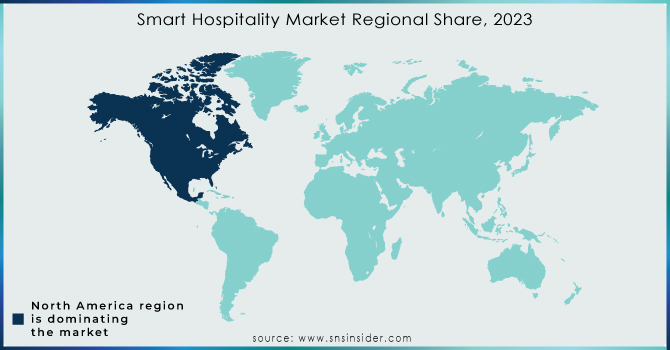
North America is the leading in the smart hospitality market, and it is anticipated that it will continue to hold that position throughout the forecast period. This is due to the region's strong demand for high-quality smart services, cloud-based platforms, and top-notch security that goes above and beyond industry standards. The Internet of Things allows hotel staff to remotely control electronic devices in "smart hotels," giving them access to real-time data about their operational state. Asia Pacific, on the other hand, is predicted to experience significant growth during the forecast period. Because of these factors, the smart hospitality market is anticipated to increase significantly throughout the forecast period.
Over the next five years, the smart hospitality industry will increase in this region due to factors like supportive government initiatives and legislation to stimulate the expansion of the hotel sector. The region's smart hotel sector continues to flourish as a result of greater technological advancements, internet infrastructure, expanded IoT applications, and efficient energy use. The market in the region will be driven by a booming tourism sector, a more modern hotel infrastructure, and a high rate of new hotel openings in numerous Asia-Pacific nations like Thailand, Malaysia, and Indonesia.
Need any customization research on Smart Hospitality Market - Enquire Now
The major players are IBM, Huawei, Schneider Electric, NEC, Cisco, Honeywell, Sabre, Legrand, Siemens AG, Global Business Solutions, Oracle, Infor, Johnson Controls, Samsung, Leviton, Control4, Wisuite, Stayntouch, Qualsoft Systems, Hospitality Network, Springler-Miller Systems, Guestline, Frontdesk Anywhere, Chris Lewis Group, BuildingIQ, Cloudbeds, and others players.
In May 2022, Oracle and Orient Jakarta collaborated to develop a cutting-edge property management system. This collaboration proved to be invaluable, especially during the challenging times of the COVID-19 pandemic, as it allowed them to bolster their online presence and provide remote staff training through the use of Oracle Digital Learning technologies.
In January 2022, Johnson Controls made a significant acquisition by purchasing FogHorn, a renowned manufacturer of edge AI solutions. This strategic merger is set to revolutionize the development of sustainable and highly efficient autonomous spaces.
Another notable partnership formed in January 2022 was between Infor and Seven Feathers Casino. This collaboration aims to elevate customer service within the hospitality sector by integrating specialized applications tailored specifically for this industry.
To enhance its digital building offering, which already includes cloud-based building operations and its smart building management platform Desigo CC, Siemens purchased EcoDomus' digital twin software in December 2021.
| Report Attributes | Details |
| Market Size in 2023 | US$ 17.55 Bn |
| Market Size by 2032 | US$ 186.10 Bn |
| CAGR | CAGR of 30% From 2024 to 2032 |
| Base Year | 2023 |
| Forecast Period | 2024-2032 |
| Historical Data | 2020-2022 |
| Report Scope & Coverage | Market Size, Segments Analysis, Competitive Landscape, Regional Analysis, DROC & SWOT Analysis, Forecast Outlook |
| Key Segments | By Offering[Solution(Property Management System,Guest Experience Management System,Integrated Security Management,Facility Management Software, Network Management Software, Point of Sale Software),Services(Professional Services, Consulting, Integaration and Development, Support and Maintenance, Managed Services)], By Deployment Mode[Cloud, On-premises],By End User[Hotel, Cruise, Luxury, Yatches, Others] |
| Regional Analysis/Coverage | North America (US, Canada, Mexico), Europe (Eastern Europe [Poland, Romania, Hungary, Turkey, Rest of Eastern Europe] Western Europe] Germany, France, UK, Italy, Spain, Netherlands, Switzerland, Austria, Rest of Western Europe]). Asia Pacific (China, India, Japan, South Korea, Vietnam, Singapore, Australia, Rest of Asia Pacific), Middle East & Africa (Middle East [UAE, Egypt, Saudi Arabia, Qatar, Rest of Middle East], Africa [Nigeria, South Africa, Rest of Africa], Latin America (Brazil, Argentina, Colombia Rest of Latin America) |
| Company Profiles | IBM, Huawei, Schneider Electric, NEC, Cisco, Honeywell, Sabre, Legrand, Siemens AG, Global Business Solutions, Oracle, Infor, Johnson Controls, Samsung, Leviton, Control4, Wisuite, Stayntouch, Qualsoft Systems, Hospitality Network, Springler-Miller Systems, Guestline, Frontdesk Anywhere, Chris Lewis Group, BuildingIQ, Cloudbeds |
| Key Drivers | • Increasing 5G adoption in the hospitality industry • A greater focus is being placed on individualized services to improve the client experience. • Increasing consumer desire for guest-focused, hyperconnected personalization and real-time tailored experiences will boost the market. |
| Market Restraints | • High expense of implementation, upkeep, and training |
Ans: Three segments are covered in the Smart Hospitality Market Report, By offerings, By Deployment Mode, By End User.
Ans. The forecast period of the Smart Hospitality Market is 2024-2032.
Ans: The value of the Smart Hospitality Market is 17.55 billion in 2023.
Ans: Yes, you can ask for the customization as pas per your business requirement.
Ans. The CAGR of the Smart Hospitality Market is 30%.
1. Introduction
1.1 Market Definition
1.2 Scope (Inclusion and Exclusions)
1.3 Research Assumptions
2. Executive Summary
2.1 Market Overview
2.2 Regional Synopsis
2.3 Competitive Summary
3. Research Methodology
3.1 Top-Down Approach
3.2 Bottom-up Approach
3.3. Data Validation
3.4 Primary Interviews
4. Market Dynamics Impact Analysis
4.1 Market Driving Factors Analysis
4.1.1 Drivers
4.1.2 Restraints
4.1.3 Opportunities
4.1.4 Challenges
4.2 PESTLE Analysis
4.3 Porter’s Five Forces Model
5. Statistical Insights and Trends Reporting
5.1 Feature Analysis, 2023
5.2 User Demographics, 2023
5.3 Integration Capabilities, by Software, 2023
5.4 Impact on Decision-making
6. Competitive Landscape
6.1 List of Major Companies, By Region
6.2 Market Share Analysis, By Region
6.3 Product Benchmarking
6.3.1 Product specifications and features
6.3.2 Pricing
6.4 Strategic Initiatives
6.4.1 Marketing and promotional activities
6.4.2 Distribution and Supply Chain Strategies
6.4.3 Expansion plans and new Product launches
6.4.4 Strategic partnerships and collaborations
6.5 Technological Advancements
6.6 Market Positioning and Branding
7. Smart Hospitality Market Segmentation, by Offering
7.1 Chapter Overview
7.2 Solution
7.2.1 Solution Market Trends Analysis (2020-2032)
7.2.2 Solution Market Size Estimates and Forecasts to 2032 (USD Million)
7.2.3 Property Management System
7.2.3.1 Property Management System Market Trends Analysis (2020-2032)
7.2.3.2 Property Management System Market Size Estimates and Forecasts to 2032 (USD Million)
7.2.4 Guest Experience Management System
7.2.4.1 Guest Experience Management System Market Trends Analysis (2020-2032)
7.2.4.2 Guest Experience Management System Market Size Estimates and Forecasts to 2032 (USD Million)
7.2.5 Integrated Security Management
7.2.5.1 Integrated Security Management Market Trends Analysis (2020-2032)
7.2.5.2 Integrated Security Management Market Size Estimates and Forecasts to 2032 (USD Million)
7.2.6 Facility Management Software
7.2.6.1 Facility Management Software Market Trends Analysis (2020-2032)
7.2.6.2 Facility Management Software Market Size Estimates and Forecasts to 2032 (USD Million)
7.2.7 Network Management Software
7.2.7.1 Network Management Software Market Trends Analysis (2020-2032)
7.2.7.2 Network Management Software Market Size Estimates and Forecasts to 2032 (USD Million)
7.2.8 Point of Sale Software
7.2.8.1 Point of Sale Software Market Trends Analysis (2020-2032)
7.2.8.2 Point of Sale Software Market Size Estimates and Forecasts to 2032 (USD Million)
7.3 Services
7.3.1 Services Market Trends Analysis (2020-2032)
7.3.2 Services Market Size Estimates and Forecasts to 2032 (USD Million)
7.3.3 Professional Services
7.3.3.1 Professional Services Market Trends Analysis (2020-2032)
7.3.3.2 Professional Services Market Size Estimates and Forecasts to 2032 (USD Million)
7.3.4 Consulting
7.3.4.1 Consulting Market Trends Analysis (2020-2032)
7.3.4.2 Consulting Market Size Estimates and Forecasts to 2032 (USD Million)
7.3.5 Integration and Development
7.3.5.1 Integration and Development Market Trends Analysis (2020-2032)
7.3.5.2 Integration and Development Market Size Estimates and Forecasts to 2032 (USD Million)
7.3.6 Support and Maintenance
7.3.6.1 Support and Maintenance Market Trends Analysis (2020-2032)
7.3.6.2 Support and Maintenance Market Size Estimates and Forecasts to 2032 (USD Million)
7.3.7 Managed Services
7.3.7.1 Managed Services Market Trends Analysis (2020-2032)
7.3.7.2 Managed Services Market Size Estimates and Forecasts to 2032 (USD Million)
8. Smart Hospitality Market Segmentation, by Delivery Mode
8.1 Chapter Overview
8.2 Cloud
8.2.1 Cloud Market Trends Analysis (2020-2032)
8.2.2 Cloud Market Size Estimates and Forecasts to 2032 (USD Million)
8.3 On-premises
8.3.1 On-premises Market Trends Analysis (2020-2032)
8.3.2 On-premises Market Size Estimates and Forecasts to 2032 (USD Million)
9. Smart Hospitality Market Segmentation, by End User
9.1 Chapter Overview
9.2 Hotel
9.2.1 Hotel Market Trends Analysis (2020-2032)
9.2.2 Hotel Market Size Estimates and Forecasts to 2032 (USD Million)
9.3 Cruise
9.3.1 Cruise Market Trends Analysis (2020-2032)
9.3.2 Cruise Market Size Estimates and Forecasts to 2032 (USD Million)
9.4 Luxury Yatches
9.4.1 Luxury Yatches Market Trends Analysis (2020-2032)
9.4.2 Luxury Yatches Market Size Estimates and Forecasts to 2032 (USD Million)
9.5 Others
9.5.1 Others Market Trends Analysis (2020-2032)
9.5.2 Others Market Size Estimates and Forecasts to 2032 (USD Million)
10. Regional Analysis
10.1 Chapter Overview
10.2 North America
10.2.1 Trends Analysis
10.2.2 North America Smart Hospitality Market Estimates and Forecasts, by Country (2020-2032) (USD Million)
10.2.3 North America Smart Hospitality Market Estimates and Forecasts, by Offering (2020-2032) (USD Million)
10.2.4 North America Smart Hospitality Market Estimates and Forecasts, by Delivery Mode (2020-2032) (USD Million)
10.2.5 North America Smart Hospitality Market Estimates and Forecasts, by End User (2020-2032) (USD Million)
10.2.6 USA
10.2.6.1 USA Smart Hospitality Market Estimates and Forecasts, by Offering (2020-2032) (USD Million)
10.2.6.2 USA Smart Hospitality Market Estimates and Forecasts, by Delivery Mode (2020-2032) (USD Million)
10.2.6.3 USA Smart Hospitality Market Estimates and Forecasts, by End User (2020-2032) (USD Million)
10.2.7 Canada
10.2.7.1 Canada Smart Hospitality Market Estimates and Forecasts, by Offering (2020-2032) (USD Million)
10.2.7.2 Canada Smart Hospitality Market Estimates and Forecasts, by Delivery Mode (2020-2032) (USD Million)
10.2.7.3 Canada Smart Hospitality Market Estimates and Forecasts, by End User (2020-2032) (USD Million)
10.2.8 Mexico
10.2.8.1 Mexico Smart Hospitality Market Estimates and Forecasts, by Offering (2020-2032) (USD Million)
10.2.8.2 Mexico Smart Hospitality Market Estimates and Forecasts, by Delivery Mode (2020-2032) (USD Million)
10.2.8.3 Mexico Smart Hospitality Market Estimates and Forecasts, by End User (2020-2032) (USD Million)
10.3 Europe
10.3.1 Eastern Europe
10.3.1.1 Trends Analysis
10.3.1.2 Eastern Europe Smart Hospitality Market Estimates and Forecasts, by Country (2020-2032) (USD Million)
10.3.1.3 Eastern Europe Smart Hospitality Market Estimates and Forecasts, by Offering (2020-2032) (USD Million)
10.3.1.4 Eastern Europe Smart Hospitality Market Estimates and Forecasts, by Delivery Mode (2020-2032) (USD Million)
10.3.1.5 Eastern Europe Smart Hospitality Market Estimates and Forecasts, by End User (2020-2032) (USD Million)
10.3.1.6 Poland
10.3.1.6.1 Poland Smart Hospitality Market Estimates and Forecasts, by Offering (2020-2032) (USD Million)
10.3.1.6.2 Poland Smart Hospitality Market Estimates and Forecasts, by Delivery Mode (2020-2032) (USD Million)
10.3.1.6.3 Poland Smart Hospitality Market Estimates and Forecasts, by End User (2020-2032) (USD Million)
10.3.1.7 Romania
10.3.1.7.1 Romania Smart Hospitality Market Estimates and Forecasts, by Offering (2020-2032) (USD Million)
10.3.1.7.2 Romania Smart Hospitality Market Estimates and Forecasts, by Delivery Mode (2020-2032) (USD Million)
10.3.1.7.3 Romania Smart Hospitality Market Estimates and Forecasts, by End User (2020-2032) (USD Million)
10.3.1.8 Hungary
10.3.1.8.1 Hungary Smart Hospitality Market Estimates and Forecasts, by Offering (2020-2032) (USD Million)
10.3.1.8.2 Hungary Smart Hospitality Market Estimates and Forecasts, by Delivery Mode (2020-2032) (USD Million)
10.3.1.8.3 Hungary Smart Hospitality Market Estimates and Forecasts, by End User (2020-2032) (USD Million)
10.3.1.9 turkey
10.3.1.9.1 Turkey Smart Hospitality Market Estimates and Forecasts, by Offering (2020-2032) (USD Million)
10.3.1.9.2 Turkey Smart Hospitality Market Estimates and Forecasts, by Delivery Mode (2020-2032) (USD Million)
10.3.1.9.3 Turkey Smart Hospitality Market Estimates and Forecasts, by End User (2020-2032) (USD Million)
10.3.1.10 Rest of Eastern Europe
10.3.1.10.1 Rest of Eastern Europe Smart Hospitality Market Estimates and Forecasts, by Offering (2020-2032) (USD Million)
10.3.1.10.2 Rest of Eastern Europe Smart Hospitality Market Estimates and Forecasts, by Delivery Mode (2020-2032) (USD Million)
10.3.1.10.3 Rest of Eastern Europe Smart Hospitality Market Estimates and Forecasts, by End User (2020-2032) (USD Million)
10.3.2 Western Europe
10.3.2.1 Trends Analysis
10.3.2.2 Western Europe Smart Hospitality Market Estimates and Forecasts, by Country (2020-2032) (USD Million)
10.3.2.3 Western Europe Smart Hospitality Market Estimates and Forecasts, by Offering (2020-2032) (USD Million)
10.3.2.4 Western Europe Smart Hospitality Market Estimates and Forecasts, by Delivery Mode (2020-2032) (USD Million)
10.3.2.5 Western Europe Smart Hospitality Market Estimates and Forecasts, by End User (2020-2032) (USD Million)
10.3.2.6 Germany
10.3.2.6.1 Germany Smart Hospitality Market Estimates and Forecasts, by Offering (2020-2032) (USD Million)
10.3.2.6.2 Germany Smart Hospitality Market Estimates and Forecasts, by Delivery Mode (2020-2032) (USD Million)
10.3.2.6.3 Germany Smart Hospitality Market Estimates and Forecasts, by End User (2020-2032) (USD Million)
10.3.2.7 France
10.3.2.7.1 France Smart Hospitality Market Estimates and Forecasts, by Offering (2020-2032) (USD Million)
10.3.2.7.2 France Smart Hospitality Market Estimates and Forecasts, by Delivery Mode (2020-2032) (USD Million)
10.3.2.7.3 France Smart Hospitality Market Estimates and Forecasts, by End User (2020-2032) (USD Million)
10.3.2.8 UK
10.3.2.8.1 UK Smart Hospitality Market Estimates and Forecasts, by Offering (2020-2032) (USD Million)
10.3.2.8.2 UK Smart Hospitality Market Estimates and Forecasts, by Delivery Mode (2020-2032) (USD Million)
10.3.2.8.3 UK Smart Hospitality Market Estimates and Forecasts, by End User (2020-2032) (USD Million)
10.3.2.9 Italy
10.3.2.9.1 Italy Smart Hospitality Market Estimates and Forecasts, by Offering (2020-2032) (USD Million)
10.3.2.9.2 Italy Smart Hospitality Market Estimates and Forecasts, by Delivery Mode (2020-2032) (USD Million)
10.3.2.9.3 Italy Smart Hospitality Market Estimates and Forecasts, by End User (2020-2032) (USD Million)
10.3.2.10 Spain
10.3.2.10.1 Spain Smart Hospitality Market Estimates and Forecasts, by Offering (2020-2032) (USD Million)
10.3.2.10.2 Spain Smart Hospitality Market Estimates and Forecasts, by Delivery Mode (2020-2032) (USD Million)
10.3.2.10.3 Spain Smart Hospitality Market Estimates and Forecasts, by End User (2020-2032) (USD Million)
10.3.2.11 Netherlands
10.3.2.11.1 Netherlands Smart Hospitality Market Estimates and Forecasts, by Offering (2020-2032) (USD Million)
10.3.2.11.2 Netherlands Smart Hospitality Market Estimates and Forecasts, by Delivery Mode (2020-2032) (USD Million)
10.3.2.11.3 Netherlands Smart Hospitality Market Estimates and Forecasts, by End User (2020-2032) (USD Million)
10.3.2.12 Switzerland
10.3.2.12.1 Switzerland Smart Hospitality Market Estimates and Forecasts, by Offering (2020-2032) (USD Million)
10.3.2.12.2 Switzerland Smart Hospitality Market Estimates and Forecasts, by Delivery Mode (2020-2032) (USD Million)
10.3.2.12.3 Switzerland Smart Hospitality Market Estimates and Forecasts, by End User (2020-2032) (USD Million)
10.3.2.13 Austria
10.3.2.13.1 Austria Smart Hospitality Market Estimates and Forecasts, by Offering (2020-2032) (USD Million)
10.3.2.13.2 Austria Smart Hospitality Market Estimates and Forecasts, by Delivery Mode (2020-2032) (USD Million)
10.3.2.13.3 Austria Smart Hospitality Market Estimates and Forecasts, by End User (2020-2032) (USD Million)
10.3.2.14 Rest of Western Europe
10.3.2.14.1 Rest of Western Europe Smart Hospitality Market Estimates and Forecasts, by Offering (2020-2032) (USD Million)
10.3.2.14.2 Rest of Western Europe Smart Hospitality Market Estimates and Forecasts, by Delivery Mode (2020-2032) (USD Million)
10.3.2.14.3 Rest of Western Europe Smart Hospitality Market Estimates and Forecasts, by End User (2020-2032) (USD Million)
10.4 Asia Pacific
10.4.1 Trends Analysis
10.4.2 Asia Pacific Smart Hospitality Market Estimates and Forecasts, by Country (2020-2032) (USD Million)
10.4.3 Asia Pacific Smart Hospitality Market Estimates and Forecasts, by Offering (2020-2032) (USD Million)
10.4.4 Asia Pacific Smart Hospitality Market Estimates and Forecasts, by Delivery Mode (2020-2032) (USD Million)
10.4.5 Asia Pacific Smart Hospitality Market Estimates and Forecasts, by End User (2020-2032) (USD Million)
10.4.6 China
10.4.6.1 China Smart Hospitality Market Estimates and Forecasts, by Offering (2020-2032) (USD Million)
10.4.6.2 China Smart Hospitality Market Estimates and Forecasts, by Delivery Mode (2020-2032) (USD Million)
10.4.6.3 China Smart Hospitality Market Estimates and Forecasts, by End User (2020-2032) (USD Million)
10.4.7 India
10.4.7.1 India Smart Hospitality Market Estimates and Forecasts, by Offering (2020-2032) (USD Million)
10.4.7.2 India Smart Hospitality Market Estimates and Forecasts, by Delivery Mode (2020-2032) (USD Million)
10.4.7.3 India Smart Hospitality Market Estimates and Forecasts, by End User (2020-2032) (USD Million)
10.4.8 Japan
10.4.8.1 Japan Smart Hospitality Market Estimates and Forecasts, by Offering (2020-2032) (USD Million)
10.4.8.2 Japan Smart Hospitality Market Estimates and Forecasts, by Delivery Mode (2020-2032) (USD Million)
10.4.8.3 Japan Smart Hospitality Market Estimates and Forecasts, by End User (2020-2032) (USD Million)
10.4.9 South Korea
10.4.9.1 South Korea Smart Hospitality Market Estimates and Forecasts, by Offering (2020-2032) (USD Million)
10.4.9.2 South Korea Smart Hospitality Market Estimates and Forecasts, by Delivery Mode (2020-2032) (USD Million)
10.4.9.3 South Korea Smart Hospitality Market Estimates and Forecasts, by End User (2020-2032) (USD Million)
10.4.10 Vietnam
10.4.10.1 Vietnam Smart Hospitality Market Estimates and Forecasts, by Offering (2020-2032) (USD Million)
10.4.10.2 Vietnam Smart Hospitality Market Estimates and Forecasts, by Delivery Mode (2020-2032) (USD Million)
10.4.10.3 Vietnam Smart Hospitality Market Estimates and Forecasts, by End User (2020-2032) (USD Million)
10.4.11 Singapore
10.4.11.1 Singapore Smart Hospitality Market Estimates and Forecasts, by Offering (2020-2032) (USD Million)
10.4.11.2 Singapore Smart Hospitality Market Estimates and Forecasts, by Delivery Mode (2020-2032) (USD Million)
10.4.11.3 Singapore Smart Hospitality Market Estimates and Forecasts, by End User (2020-2032) (USD Million)
10.4.12 Australia
10.4.12.1 Australia Smart Hospitality Market Estimates and Forecasts, by Offering (2020-2032) (USD Million)
10.4.12.2 Australia Smart Hospitality Market Estimates and Forecasts, by Delivery Mode (2020-2032) (USD Million)
10.4.12.3 Australia Smart Hospitality Market Estimates and Forecasts, by End User (2020-2032) (USD Million)
10.4.13 Rest of Asia Pacific
10.4.13.1 Rest of Asia Pacific Smart Hospitality Market Estimates and Forecasts, by Offering (2020-2032) (USD Million)
10.4.13.2 Rest of Asia Pacific Smart Hospitality Market Estimates and Forecasts, by Delivery Mode (2020-2032) (USD Million)
10.4.13.3 Rest of Asia Pacific Smart Hospitality Market Estimates and Forecasts, by End User (2020-2032) (USD Million)
10.5 Middle East and Africa
10.5.1 Middle East
10.5.1.1 Trends Analysis
10.5.1.2 Middle East Smart Hospitality Market Estimates and Forecasts, by Country (2020-2032) (USD Million)
10.5.1.3 Middle East Smart Hospitality Market Estimates and Forecasts, by Offering (2020-2032) (USD Million)
10.5.1.4 Middle East Smart Hospitality Market Estimates and Forecasts, by Delivery Mode (2020-2032) (USD Million)
10.5.1.5 Middle East Smart Hospitality Market Estimates and Forecasts, by End User (2020-2032) (USD Million)
10.5.1.6 UAE
10.5.1.6.1 UAE Smart Hospitality Market Estimates and Forecasts, by Offering (2020-2032) (USD Million)
10.5.1.6.2 UAE Smart Hospitality Market Estimates and Forecasts, by Delivery Mode (2020-2032) (USD Million)
10.5.1.6.3 UAE Smart Hospitality Market Estimates and Forecasts, by End User (2020-2032) (USD Million)
10.5.1.7 Egypt
10.5.1.7.1 Egypt Smart Hospitality Market Estimates and Forecasts, by Offering (2020-2032) (USD Million)
10.5.1.7.2 Egypt Smart Hospitality Market Estimates and Forecasts, by Delivery Mode (2020-2032) (USD Million)
10.5.1.7.3 Egypt Smart Hospitality Market Estimates and Forecasts, by End User (2020-2032) (USD Million)
10.5.1.8 Saudi Arabia
10.5.1.8.1 Saudi Arabia Smart Hospitality Market Estimates and Forecasts, by Offering (2020-2032) (USD Million)
10.5.1.8.2 Saudi Arabia Smart Hospitality Market Estimates and Forecasts, by Delivery Mode (2020-2032) (USD Million)
10.5.1.8.3 Saudi Arabia Smart Hospitality Market Estimates and Forecasts, by End User (2020-2032) (USD Million)
10.5.1.9 Qatar
10.5.1.9.1 Qatar Smart Hospitality Market Estimates and Forecasts, by Offering (2020-2032) (USD Million)
10.5.1.9.2 Qatar Smart Hospitality Market Estimates and Forecasts, by Delivery Mode (2020-2032) (USD Million)
10.5.1.9.3 Qatar Smart Hospitality Market Estimates and Forecasts, by End User (2020-2032) (USD Million)
10.5.1.10 Rest of Middle East
10.5.1.10.1 Rest of Middle East Smart Hospitality Market Estimates and Forecasts, by Offering (2020-2032) (USD Million)
10.5.1.10.2 Rest of Middle East Smart Hospitality Market Estimates and Forecasts, by Delivery Mode (2020-2032) (USD Million)
10.5.1.10.3 Rest of Middle East Smart Hospitality Market Estimates and Forecasts, by End User (2020-2032) (USD Million)
10.5.2 Africa
10.5.2.1 Trends Analysis
10.5.2.2 Africa Smart Hospitality Market Estimates and Forecasts, by Country (2020-2032) (USD Million)
10.5.2.3 Africa Smart Hospitality Market Estimates and Forecasts, by Offering (2020-2032) (USD Million)
10.5.2.4 Africa Smart Hospitality Market Estimates and Forecasts, by Delivery Mode (2020-2032) (USD Million)
10.5.2.5 Africa Smart Hospitality Market Estimates and Forecasts, by End User (2020-2032) (USD Million)
10.5.2.6 South Africa
10.5.2.6.1 South Africa Smart Hospitality Market Estimates and Forecasts, by Offering (2020-2032) (USD Million)
10.5.2.6.2 South Africa Smart Hospitality Market Estimates and Forecasts, by Delivery Mode (2020-2032) (USD Million)
10.5.2.6.3 South Africa Smart Hospitality Market Estimates and Forecasts, by End User (2020-2032) (USD Million)
10.5.2.7 Nigeria
10.5.2.7.1 Nigeria Smart Hospitality Market Estimates and Forecasts, by Offering (2020-2032) (USD Million)
10.5.2.7.2 Nigeria Smart Hospitality Market Estimates and Forecasts, by Delivery Mode (2020-2032) (USD Million)
10.5.2.7.3 Nigeria Smart Hospitality Market Estimates and Forecasts, by End User (2020-2032) (USD Million)
10.5.2.8 Rest of Africa
10.5.2.8.1 Rest of Africa Smart Hospitality Market Estimates and Forecasts, by Offering (2020-2032) (USD Million)
10.5.2.8.2 Rest of Africa Smart Hospitality Market Estimates and Forecasts, by Delivery Mode (2020-2032) (USD Million)
10.5.2.8.3 Rest of Africa Smart Hospitality Market Estimates and Forecasts, by End User (2020-2032) (USD Million)
10.6 Latin America
10.6.1 Trends Analysis
10.6.2 Latin America Smart Hospitality Market Estimates and Forecasts, by Country (2020-2032) (USD Million)
10.6.3 Latin America Smart Hospitality Market Estimates and Forecasts, by Offering (2020-2032) (USD Million)
10.6.4 Latin America Smart Hospitality Market Estimates and Forecasts, by Delivery Mode (2020-2032) (USD Million)
10.6.5 Latin America Smart Hospitality Market Estimates and Forecasts, by End User (2020-2032) (USD Million)
10.6.6 Brazil
10.6.6.1 Brazil Smart Hospitality Market Estimates and Forecasts, by Offering (2020-2032) (USD Million)
10.6.6.2 Brazil Smart Hospitality Market Estimates and Forecasts, by Delivery Mode (2020-2032) (USD Million)
10.6.6.3 Brazil Smart Hospitality Market Estimates and Forecasts, by End User (2020-2032) (USD Million)
10.6.7 Argentina
10.6.7.1 Argentina Smart Hospitality Market Estimates and Forecasts, by Offering (2020-2032) (USD Million)
10.6.7.2 Argentina Smart Hospitality Market Estimates and Forecasts, by Delivery Mode (2020-2032) (USD Million)
10.6.7.3 Argentina Smart Hospitality Market Estimates and Forecasts, by End User (2020-2032) (USD Million)
10.6.8 Colombia
10.6.8.1 Colombia Smart Hospitality Market Estimates and Forecasts, by Offering (2020-2032) (USD Million)
10.6.8.2 Colombia Smart Hospitality Market Estimates and Forecasts, by Delivery Mode (2020-2032) (USD Million)
10.6.8.3 Colombia Smart Hospitality Market Estimates and Forecasts, by End User (2020-2032) (USD Million)
10.6.9 Rest of Latin America
10.6.9.1 Rest of Latin America Smart Hospitality Market Estimates and Forecasts, by Offering (2020-2032) (USD Million)
10.6.9.2 Rest of Latin America Smart Hospitality Market Estimates and Forecasts, by Delivery Mode (2020-2032) (USD Million)
10.6.9.3 Rest of Latin America Smart Hospitality Market Estimates and Forecasts, by End User (2020-2032) (USD Million)
11. Company Profiles
11.1 IBM, Huawei
11.1.1 Company Overview
11.1.2 Financial
11.1.3 Product / Services Offered
11.1.4 SWOT Analysis
11.2 Schneider Electric
11.2.1 Company Overview
11.2.2 Financial
11.2.3 Product / Services Offered
11.2.4 SWOT Analysis
11.3 Cisco
11.3.1 Company Overview
11.3.2 Financial
11.3.3 Product / Services Offered
11.3.4 SWOT Analysis
11.4 Honeywell
11.4.1 Company Overview
11.4.2 Financial
11.4.3 Product / Services Offered
11.4.4 SWOT Analysis
11.5 Sabre
11.5.1 Company Overview
11.5.2 Financial
11.5.3 Product / Services Offered
11.5.4 SWOT Analysis
11.6 Legrand
11.6.1 Company Overview
11.6.2 Financial
11.6.3 Product / Services Offered
11.6.4 SWOT Analysis
11.7 Siemens AG
11.7.1 Company Overview
11.7.2 Financial
11.7.3 Product / Services Offered
11.7.4 SWOT Analysis
11.8 Global Business Solutions
11.8.1 Company Overview
11.8.2 Financial
11.8.3 Product / Services Offered
11.8.4 SWOT Analysis
11.9 Oracle
11.9.1 Company Overview
11.9.2 Financial
11.9.3 Product / Services Offered
11.9.4 SWOT Analysis
11.10 Infor
11.10.1 Company Overview
11.10.2 Financial
11.10.3 Product / Services Offered
11.10.4 SWOT Analysis
12. Use Cases and Best Practices
13. Conclusion
An accurate research report requires proper strategizing as well as implementation. There are multiple factors involved in the completion of good and accurate research report and selecting the best methodology to compete the research is the toughest part. Since the research reports we provide play a crucial role in any company’s decision-making process, therefore we at SNS Insider always believe that we should choose the best method which gives us results closer to reality. This allows us to reach at a stage wherein we can provide our clients best and accurate investment to output ratio.
Each report that we prepare takes a timeframe of 350-400 business hours for production. Starting from the selection of titles through a couple of in-depth brain storming session to the final QC process before uploading our titles on our website we dedicate around 350 working hours. The titles are selected based on their current market cap and the foreseen CAGR and growth.
The 5 steps process:
Step 1: Secondary Research:
Secondary Research or Desk Research is as the name suggests is a research process wherein, we collect data through the readily available information. In this process we use various paid and unpaid databases which our team has access to and gather data through the same. This includes examining of listed companies’ annual reports, Journals, SEC filling etc. Apart from this our team has access to various associations across the globe across different industries. Lastly, we have exchange relationships with various university as well as individual libraries.

Step 2: Primary Research
When we talk about primary research, it is a type of study in which the researchers collect relevant data samples directly, rather than relying on previously collected data. This type of research is focused on gaining content specific facts that can be sued to solve specific problems. Since the collected data is fresh and first hand therefore it makes the study more accurate and genuine.
We at SNS Insider have divided Primary Research into 2 parts.
Part 1 wherein we interview the KOLs of major players as well as the upcoming ones across various geographic regions. This allows us to have their view over the market scenario and acts as an important tool to come closer to the accurate market numbers. As many as 45 paid and unpaid primary interviews are taken from both the demand and supply side of the industry to make sure we land at an accurate judgement and analysis of the market.
This step involves the triangulation of data wherein our team analyses the interview transcripts, online survey responses and observation of on filed participants. The below mentioned chart should give a better understanding of the part 1 of the primary interview.

Part 2: In this part of primary research the data collected via secondary research and the part 1 of the primary research is validated with the interviews from individual consultants and subject matter experts.
Consultants are those set of people who have at least 12 years of experience and expertise within the industry whereas Subject Matter Experts are those with at least 15 years of experience behind their back within the same space. The data with the help of two main processes i.e., FGDs (Focused Group Discussions) and IDs (Individual Discussions). This gives us a 3rd party nonbiased primary view of the market scenario making it a more dependable one while collation of the data pointers.
Step 3: Data Bank Validation
Once all the information is collected via primary and secondary sources, we run that information for data validation. At our intelligence centre our research heads track a lot of information related to the market which includes the quarterly reports, the daily stock prices, and other relevant information. Our data bank server gets updated every fortnight and that is how the information which we collected using our primary and secondary information is revalidated in real time.

Step 4: QA/QC Process
After all the data collection and validation our team does a final level of quality check and quality assurance to get rid of any unwanted or undesired mistakes. This might include but not limited to getting rid of the any typos, duplication of numbers or missing of any important information. The people involved in this process include technical content writers, research heads and graphics people. Once this process is completed the title gets uploader on our platform for our clients to read it.
Step 5: Final QC/QA Process:
This is the last process and comes when the client has ordered the study. In this process a final QA/QC is done before the study is emailed to the client. Since we believe in giving our clients a good experience of our research studies, therefore, to make sure that we do not lack at our end in any way humanly possible we do a final round of quality check and then dispatch the study to the client.
Market Segmentation:
By Offering
Solution
Property Management System
Guest Experience Management System
Integrated Security Management
Facility Management Software
Network Management Software
Point of Sale Software
Services
Professional Services
Consulting
Integaration and Development
Support and Maintenance
Managed Services
By Deployment Mode
Cloud
On-premises
By End User
Hotel
Cruise
Luxury Yatches
Others
Request for Segment Customization as per your Business Requirement:
REGIONAL COVERAGE:
North America
US
Canada
Mexico
Europe
Eastern Europe
Poland
Romania
Hungary
Turkey
Rest of Eastern Europe
Western Europe
Germany
France
UK
Italy
Spain
Netherlands
Switzerland
Austria
Rest of Western Europe
Asia Pacific
China
India
Japan
South Korea
Vietnam
Singapore
Australia
Rest of Asia Pacific
Middle East & Africa
Middle East
UAE
Egypt
Saudi Arabia
Qatar
Rest of the Middle East
Africa
Nigeria
South Africa
Rest of Africa
Latin America
Brazil
Argentina
Colombia
Request for Country Level Research Report: Country Level Customization Request
Available Customization
With the given market data, SNS Insider offers customization as per the company’s specific needs. The following customization options are available for the report:
Product Analysis
Criss-Cross segment analysis (e.g. Product X Application)
Product Matrix which gives a detailed comparison of product portfolio of each company
Geographic Analysis
Additional countries in any of the regions
Company Information
Detailed analysis and profiling of additional market players (Up to five)
The Analytical Standards Market Size was valued at USD 1.41 Billion in 2023 and is expected to reach USD 2.46 Billion by 2032, growing at a CAGR of 6.42% over the forecast period of 2024-2032.
The Contrast Media/Contrast Agent Market Size was valued at USD 6.50 Billion in 2023, and is expected to reach USD 12.28 Billion by 2032, and grow at a CAGR of 7.66%.
The Genome Editing Market size valued at USD 7.99 billion in 2023 and is expected to reach USD 32.72 billion by 2032 with a growing CAGR of 16.98% during the forecast period of 2024-2032.
The Global Genetic Testing Market Size, valued at USD 17.48 billion in 2023, is expected to grow to USD 46.29 billion by 2032, with a CAGR of 11.34%.
The Behavioral Rehabilitation Market was valued at USD 456.6 Billion in 2023 and is expected to reach USD 799.4 Billion by 2032, growing at a CAGR of 6.4% over the forecast period 2024-2032.
The Medical Equipment Rental Market was valued at USD 58.57 Billion in 2023 and is expected to reach USD 97.69 billion by 2032 and grow at a CAGR of 5.85%.

Hi! Click one of our member below to chat on Phone
© 2025 All Rights Reserved by SNS Insider Pvt Ltd


