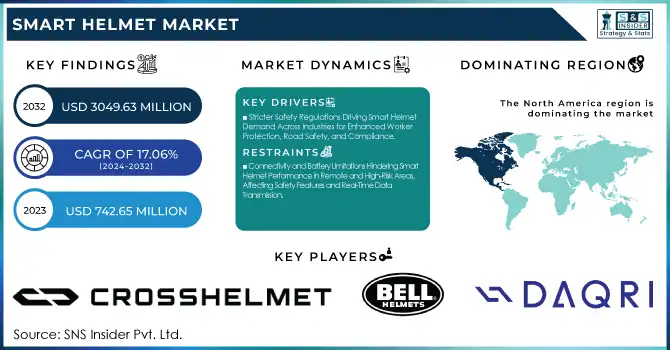
The Smart Helmet Market was valued at USD 742.65 million in 2023 and is expected to reach USD 3049.63 million by 2032, growing at a CAGR of 17.06% from 2024-2032. This report includes an in-depth analysis of key factors driving market growth, including adoption rates, technological advancements, and shifts in consumer behavior. With increasing demand for safety and connectivity, the market is witnessing innovations such as integrated communication systems and augmented reality. Price trends and supply chain dynamics further influence market strategies. Consumer preferences for advanced features in sectors like construction, sports, and transportation are driving the surge in smart helmet adoption. This growth trajectory reflects both technological and societal shifts toward enhanced personal safety.
To Get more information on Smart Helmet Market - Request Free Sample Report
Drivers
Stricter Safety Regulations Driving Smart Helmet Demand Across Industries for Enhanced Worker Protection, Road Safety, and Compliance.
Growing government regulations for driver and worker safety are propelling the smart helmet adoption among industries such as construction, mining, and transport. Governmental bodies are enforcing more stringent workplace safety standards to reduce accidents and fatalities, forcing businesses to spend on advanced protective equipment. In transport, growing concerns regarding road safety are compelling motorcyclists to adopt smart helmets with built-in safety aspects such as crash detection and emergency notification. Furthermore, industrial industries are utilizing these helmets to promote worker safety by detecting hazards in real-time and through communication functions. With heightened enforcement of safety regulations, companies are focusing on compliance, and this is boosting demand for technology-enabled helmets with IoT, AI, and AR features to maximize protection and operating efficiency.
Restraints
Connectivity and Battery Limitations Hindering Smart Helmet Performance in Remote and High-Risk Areas, Affecting Safety Features and Real-Time Data Transmission.
Smart helmets with sophisticated technologies such as IoT, AI, and AR need constant internet connectivity and stable battery power to perform optimally. In remote areas like mines, construction sites, and high-risk industrial areas, though, maintaining constant network coverage is a huge challenge. Low connectivity can interrupt real-time data transmission, and the efficiency of safety features such as hazard detection and emergency warnings will be diminished. Secondly, battery capacity limitations limit extensive usage, needing to be frequently charged, which in some harsh work environments might not always be convenient. All these pose difficulties for smooth running and uptake, especially in businesses where continuous performance is paramount. The solution of these problems in terms of extended battery life and offline functionality is paramount for general market uptake.
Opportunities
AI and IoT Integration Boosting Smart Helmet Safety, Real-Time Monitoring, and Communication for Enhanced Worker and Rider Protection.
The convergence of artificial intelligence (AI) and the Internet of Things (IoT) is revolutionizing smart helmets by enhancing safety, communication, and real-time monitoring. AI-driven features like predictive analytics and voice recognition facilitate proactive hazard detection, minimizing accident risks in industrial and transportation environments. IoT connectivity facilitates smooth data transmission, improving situational awareness for workers, motorcyclists, and security officers. Real-time monitoring and emergency notifications enhance response times in accidents, and thus safety is better ensured. Moreover, automation with AI facilitates hands-free interaction, and thus smart helmets are more effective in hazardous environments. With technology growing by the day, the use of AI and IoT will play a major role in increasing adoption, offering industries cutting-edge solutions for enhanced operational efficiency and labor protection.
Challenges
Varying Safety Regulations Creating Compliance and Certification Barriers for Smart Helmet Market Expansion
Various industries and nations have their own safety standards, and it is challenging for smart helmet producers to obtain uniform certification and compliance. Regulatory differences necessitate companies to adjust designs and features to comply with particular regional regulations, which adds to production costs and time-to-market. This non-standardization also makes global distribution more challenging, restricting market growth opportunities. Such industries as construction, mining, and logistics need to comply with domestic regulations, which can impede adoption rates. Moreover, changing safety standards require constant upgrades in smart helmet technologies, imposing still more challenges on manufacturers. The implementation of common standards and streamlined certification procedures would substantially facilitate market access and promote wider adoption in various industries and regions.
By Component
The Communication segment led the Smart Helmet Market with the largest revenue share of approximately 38% in 2023 because of the increasing need for hassle-free connectivity in industrial, defense, and transport applications. Smart helmets that have real-time voice communication, Bluetooth, and IoT integration improve workplace safety and operational efficiency. The construction and mining industries use hands-free communication for better coordination. Further, the use of smart helmets among motorcyclists and law enforcers helped strengthen the market presence of this segment.
The Navigation segment is anticipated to grow at the fastest CAGR of 18.90% during the period 2024-2032, fueled by the expanding use of smart helmets in motorcycling, logistics, and outdoor sports. GPS-based navigation, AR screens, and turn-by-turn instructions are enhancing user experience and safety. The growing use of electric two-wheelers and increasing demand for advanced rider assistance systems are also driving the growth of the segment, which is making navigation a key feature for the adoption of smart helmets.
By Type
The Full Face segment led the Smart Helmet Market with the largest revenue share of around 54% in 2023 because of its higher level of safety and protection capabilities, which is why it is the most sought-after among motorcyclists, industrial workers, and defense personnel. These helmets are more impact-resistant, have in-built communication, and augmented reality capabilities, and thus provide complete safety. More regulations for rider protection and higher adoption in motorsports and professional biking also drove demand higher, cementing the segment's market leadership.
The Hard Hat market is projected to expand at the fastest CAGR of 19.82% during the forecast period from 2024 to 2032, led by rising workplace safety standards in construction, mining, and manufacturing sectors. Rising investments in intelligent personal protective equipment (PPE) with IoT-based hazard recognition, real-time connectivity, and ambient monitoring are boosting adoption. With industries focusing on worker safety and compliance, the need for smart hard hats is increasing, and this segment is a major growth driver in the market.
By End-Use
The Consumer segment led the Smart Helmet Market with the largest share in terms of revenue of approximately 74% in 2023, fueled by the growing usage of smart helmets among motorcyclists, cyclists, and adventure sports participants. The presence of features such as Bluetooth connectivity, voice command, crash detection, and navigation has improved convenience and safety for users, thereby increasing demand. Furthermore, growing road safety concerns and regulations compelling the use of helmets have further contributed to market growth, positioning the consumer segment as the most significant revenue contributor.
The Manufacturing segment is expected to grow at the fastest CAGR of approximately 20.21% during 2024-2032, driven by the rising concern for worker safety and work efficiency. The use of smart helmets with IoT-based monitoring, live communication, and augmented reality to provide hands-free guidance is revolutionizing industrial environments. Stringent safety laws and the drive to Industry 4.0 technologies are increasingly promoting the adoption of smart helmets in manufacturing, fueling explosive market growth.
Regional Analysis
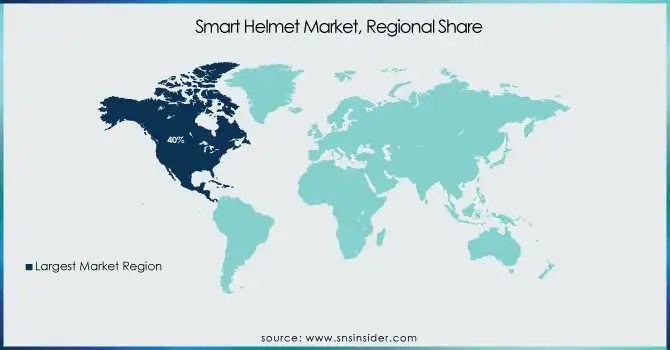
North America led the Smart Helmet Market with the largest revenue share of approximately 40% in 2023, fueled by strict safety regulations, high consumer consciousness, and high-tech adoption. The high presence of prominent market players and rising investments in smart protective equipment in industries like construction, defense, and motorcycling have driven demand. Moreover, growing disposable income and an increasing inclination towards connected safety solutions have driven the region's market leadership.
Asia Pacific will expand at the fastest CAGR of approximately 18.82% during 2024-2032, driven by urbanization, growing industrialization, and growing safety issues across industries. The growth in two-wheeler ownership, along with tighter government regulations for the safety of riders, is fueling consumer adoption. Increasing manufacturing and construction sectors, coupled with increasing investments in intelligent industrial safety gear, are further driving market growth, with Asia Pacific being the fastest-growing region in the smart helmet market.
Get Customized Report as per Your Business Requirement - Enquiry Now
Beijing BaBaALi Technology Co.Ltd (Smart Helmet, Smart Visor)
Crosshelmet (Crosshelmet X1, Crosshelmet S1)
Bell Helmets (Qualifier DLX MIPS, Star MIPS)
Forcite Helmet Systems (Forcite MK1, Forcite MK1S)
Intelligent Cranium Helmets LLC (ICH-001, ICH-002)
JARVISH INC (X-AR Helmet, AR Helmet)
LIVALL Tech Co., Ltd. (BH51M, BH60SE)
H&H Sports Protection USA, Inc. (TORC T15, TORC T50)
Sena Technologies, Inc. (Momentum INC, Cavalry Bluetooth Helmet)
Lumos Helmet US (Lumos Matrix, Lumos Kickstart)
DAQRI (DAQRI Smart Helmet, DAQRI AR Smart Helmet)
Forcite Helmet Systems Pty Ltd. (Forcite MK1, Forcite MK1S)
TVS Motor Company (TVS Smart Helmet, TVS Blaze Helmet)
Hedkayse (Hedkayse ONE, Hedkayse REACT)
MapmyIndia (Connected Smart Helmet, Location-Based Services Helmet)
Livall (BH51M, BH60SE)
Jarvish Inc. (X-AR Helmet, AR Helmet)
Torc Helmets (Torc T50, Torc T15)
Lumos Helmet (Lumos Matrix, Lumos Kickstart)
Nexsys. Co., Ltd. (Nexsys Smart Helmet, Nexsys Vision Helmet)
360fly, Inc. (360fly Camera Helmet, 360fly Sport Helmet)
At CES 2024, LIVALL officially launched the MC1 smart motorcycle helmet, marking its expansion into high-speed cycling gear. The MC1 features Bluetooth connectivity, smart lighting, and safety innovations, reinforcing LIVALL’s position in the smart helmet industry.
In 2024, TORC Helmets launched the Newport Carbon Fiber Gloss Black helmet, featuring a 3K carbon fiber shell, antimicrobial suede interior, multi-density EPS, and integrated speaker pockets. The helmet is DOT and ECE certified, offering high safety and comfort for riders.
| Report Attributes | Details |
|---|---|
| Market Size in 2023 | USD 742.65 Million |
| Market Size by 2032 | USD 3049.63 Million |
| CAGR | CAGR of 17.06% From 2024 to 2032 |
| Base Year | 2023 |
| Forecast Period | 2024-2032 |
| Historical Data | 2020-2022 |
| Report Scope & Coverage | Market Size, Segments Analysis, Competitive Landscape, Regional Analysis, DROC & SWOT Analysis, Forecast Outlook |
| Key Segments | • By Type (Full Face, Half Face, Hard Hat) • By Component (Communication, Navigation, Camera, Others) • By End-Use (Consumer, Manufacturing, Construction, Others) |
| Regional Analysis/Coverage | North America (US, Canada, Mexico), Europe (Eastern Europe [Poland, Romania, Hungary, Turkey, Rest of Eastern Europe] Western Europe] Germany, France, UK, Italy, Spain, Netherlands, Switzerland, Austria, Rest of Western Europe]), Asia Pacific (China, India, Japan, South Korea, Vietnam, Singapore, Australia, Rest of Asia Pacific), Middle East & Africa (Middle East [UAE, Egypt, Saudi Arabia, Qatar, Rest of Middle East], Africa [Nigeria, South Africa, Rest of Africa], Latin America (Brazil, Argentina, Colombia, Rest of Latin America) |
| Company Profiles | Beijing BaBaALi Technology Co.Ltd, Crosshelmet, Bell Helmets, Forcite Helmet Systems, Intelligent Cranium Helmets LLC, JARVISH INC, LIVALL Tech Co., Ltd., H&H Sports Protection USA, Inc., Sena Technologies, Inc., Lumos Helmet US, DAQRI, Forcite Helmet Systems Pty Ltd., TVS Motor Company, Hedkayse, MapmyIndia, Livall, Jarvish Inc., Torc Helmets, Lumos Helmet, Nexsys. Co., Ltd., 360fly, Inc. |
ANS: Smart Helmet Market was valued at USD 742.65 million in 2023 and is expected to reach USD 3049.63 million by 2032, growing at a CAGR of 17.06% from 2024-2032.
ANS: The Communication segment led with a 38% share in 2023 due to demand for real-time connectivity.
ANS: The Hard Hat segment is expected to grow at the fastest CAGR of 19.82% from 2024 to 2032.
ANS: The Consumer segment led with a 74% share in 2023 due to high adoption among motorcyclists.
ANS: Asia Pacific is projected to grow at a CAGR of 18.82% due to increasing industrialization and two-wheeler adoption.
Table of Contents:
1. Introduction
1.1 Market Definition
1.2 Scope (Inclusion and Exclusions)
1.3 Research Assumptions
2. Executive Summary
2.1 Market Overview
2.2 Regional Synopsis
2.3 Competitive Summary
3. Research Methodology
3.1 Top-Down Approach
3.2 Bottom-up Approach
3.3. Data Validation
3.4 Primary Interviews
4. Market Dynamics Impact Analysis
4.1 Market Driving Factors Analysis
4.1.1 Drivers
4.1.2 Restraints
4.1.3 Opportunities
4.1.4 Challenges
4.2 PESTLE Analysis
4.3 Porter’s Five Forces Model
5. Statistical Insights and Trends Reporting
5.1 Adoption Rate
5.2 Technological Advancements
5.3 Consumer Behavior
5.4 Price Trends
5.5 Supply Chain Analysis
6. Competitive Landscape
6.1 List of Major Companies, By Region
6.2 Market Share Analysis, By Region
6.3 Product Benchmarking
6.3.1 Product specifications and features
6.3.2 Pricing
6.4 Strategic Initiatives
6.4.1 Marketing and promotional activities
6.4.2 Distribution and supply chain strategies
6.4.3 Expansion plans and new product launches
6.4.4 Strategic partnerships and collaborations
6.5 Technological Advancements
6.6 Market Positioning and Branding
7. Smart Helmet Market Segmentation, By Type
7.1 Chapter Overview
7.2 Full Face
7.2.1 Full Face Market Trends Analysis (2020-2032)
7.2.2 Full Face Market Size Estimates and Forecasts to 2032 (USD Million)
7.3 Half Face
7.3.1 Half Face Market Trends Analysis (2020-2032)
7.3.2 Half Face Market Size Estimates and Forecasts to 2032 (USD Million)
7.4 Hard Hat
7.4.1 Hard Hat Market Trends Analysis (2020-2032)
7.4.2 Hard Hat Market Size Estimates and Forecasts to 2032 (USD Million)
8. Smart Helmet Market Segmentation, By Component
8.1 Chapter Overview
8.2 Communication
8.2.1 Communication Market Trends Analysis (2020-2032)
8.2.2 Communication Market Size Estimates and Forecasts to 2032 (USD Million)
8.3 Navigation
8.3.1 Navigation Market Trends Analysis (2020-2032)
8.3.2 Navigation Market Size Estimates and Forecasts to 2032 (USD Million)
8.4 Camera
8.4.1 Camera Market Trends Analysis (2020-2032)
8.4.2 Camera Market Size Estimates and Forecasts to 2032 (USD Million)
8.5 Others
8.5.1 Others Market Trends Analysis (2020-2032)
8.5.2 Others Market Size Estimates and Forecasts to 2032 (USD Million)
9. Smart Helmet Market Segmentation, By End-Use
9.1 Chapter Overview
9.2 Consumer
9.2.1 Consumer Market Trends Analysis (2020-2032)
9.2.2 Consumer Market Size Estimates and Forecasts to 2032 (USD Million)
9.3 Manufacturing
9.3.1 Manufacturing Market Trends Analysis (2020-2032)
9.3.2 Manufacturing Market Size Estimates and Forecasts to 2032 (USD Million)
9.4 Construction
9.4.1 Construction Market Trends Analysis (2020-2032)
9.4.2 Construction Market Size Estimates and Forecasts to 2032 (USD Million)
9.5 Others
9.5.1 Others Market Trends Analysis (2020-2032)
9.5.2 Others Market Size Estimates and Forecasts to 2032 (USD Million)
10. Regional Analysis
10.1 Chapter Overview
10.2 North America
10.2.1 Trends Analysis
10.2.2 North America Smart Helmet Market Estimates and Forecasts, by Country (2020-2032) (USD Million)
10.2.3 North America Smart Helmet Market Estimates and Forecasts, By Type (2020-2032) (USD Million)
10.2.4 North America Smart Helmet Market Estimates and Forecasts, By Component (2020-2032) (USD Million)
10.2.5 North America Smart Helmet Market Estimates and Forecasts, By End-Use (2020-2032) (USD Million)
10.2.6 USA
10.2.6.1 USA Smart Helmet Market Estimates and Forecasts, By Type (2020-2032) (USD Million)
10.2.6.2 USA Smart Helmet Market Estimates and Forecasts, By Component (2020-2032) (USD Million)
10.2.6.3 USA Smart Helmet Market Estimates and Forecasts, By End-Use (2020-2032) (USD Million)
10.2.7 Canada
10.2.7.1 Canada Smart Helmet Market Estimates and Forecasts, By Type (2020-2032) (USD Million)
10.2.7.2 Canada Smart Helmet Market Estimates and Forecasts, By Component (2020-2032) (USD Million)
10.2.7.3 Canada Smart Helmet Market Estimates and Forecasts, By End-Use (2020-2032) (USD Million)
10.2.8 Mexico
10.2.8.1 Mexico Smart Helmet Market Estimates and Forecasts, By Type (2020-2032) (USD Million)
10.2.8.2 Mexico Smart Helmet Market Estimates and Forecasts, By Component (2020-2032) (USD Million)
10.2.8.3 Mexico Smart Helmet Market Estimates and Forecasts, By End-Use (2020-2032) (USD Million)
10.3 Europe
10.3.1 Eastern Europe
10.3.1.1 Trends Analysis
10.3.1.2 Eastern Europe Smart Helmet Market Estimates and Forecasts, by Country (2020-2032) (USD Million)
10.3.1.3 Eastern Europe Smart Helmet Market Estimates and Forecasts, By Type (2020-2032) (USD Million)
10.3.1.4 Eastern Europe Smart Helmet Market Estimates and Forecasts, By Component (2020-2032) (USD Million)
10.3.1.5 Eastern Europe Smart Helmet Market Estimates and Forecasts, By End-Use (2020-2032) (USD Million)
10.3.1.6 Poland
10.3.1.6.1 Poland Smart Helmet Market Estimates and Forecasts, By Type (2020-2032) (USD Million)
10.3.1.6.2 Poland Smart Helmet Market Estimates and Forecasts, By Component (2020-2032) (USD Million)
10.3.1.6.3 Poland Smart Helmet Market Estimates and Forecasts, By End-Use (2020-2032) (USD Million)
10.3.1.7 Romania
10.3.1.7.1 Romania Smart Helmet Market Estimates and Forecasts, By Type (2020-2032) (USD Million)
10.3.1.7.2 Romania Smart Helmet Market Estimates and Forecasts, By Component (2020-2032) (USD Million)
10.3.1.7.3 Romania Smart Helmet Market Estimates and Forecasts, By End-Use (2020-2032) (USD Million)
10.3.1.8 Hungary
10.3.1.8.1 Hungary Smart Helmet Market Estimates and Forecasts, By Type (2020-2032) (USD Million)
10.3.1.8.2 Hungary Smart Helmet Market Estimates and Forecasts, By Component (2020-2032) (USD Million)
10.3.1.8.3 Hungary Smart Helmet Market Estimates and Forecasts, By End-Use (2020-2032) (USD Million)
10.3.1.9 Turkey
10.3.1.9.1 Turkey Smart Helmet Market Estimates and Forecasts, By Type (2020-2032) (USD Million)
10.3.1.9.2 Turkey Smart Helmet Market Estimates and Forecasts, By Component (2020-2032) (USD Million)
10.3.1.9.3 Turkey Smart Helmet Market Estimates and Forecasts, By End-Use (2020-2032) (USD Million)
10.3.1.10 Rest of Eastern Europe
10.3.1.10.1 Rest of Eastern Europe Smart Helmet Market Estimates and Forecasts, By Type (2020-2032) (USD Million)
10.3.1.10.2 Rest of Eastern Europe Smart Helmet Market Estimates and Forecasts, By Component (2020-2032) (USD Million)
10.3.1.10.3 Rest of Eastern Europe Smart Helmet Market Estimates and Forecasts, By End-Use (2020-2032) (USD Million)
10.3.2 Western Europe
10.3.2.1 Trends Analysis
10.3.2.2 Western Europe Smart Helmet Market Estimates and Forecasts, by Country (2020-2032) (USD Million)
10.3.2.3 Western Europe Smart Helmet Market Estimates and Forecasts, By Type (2020-2032) (USD Million)
10.3.2.4 Western Europe Smart Helmet Market Estimates and Forecasts, By Component (2020-2032) (USD Million)
10.3.2.5 Western Europe Smart Helmet Market Estimates and Forecasts, By End-Use (2020-2032) (USD Million)
10.3.2.6 Germany
10.3.2.6.1 Germany Smart Helmet Market Estimates and Forecasts, By Type (2020-2032) (USD Million)
10.3.2.6.2 Germany Smart Helmet Market Estimates and Forecasts, By Component (2020-2032) (USD Million)
10.3.2.6.3 Germany Smart Helmet Market Estimates and Forecasts, By End-Use (2020-2032) (USD Million)
10.3.2.7 France
10.3.2.7.1 France Smart Helmet Market Estimates and Forecasts, By Type (2020-2032) (USD Million)
10.3.2.7.2 France Smart Helmet Market Estimates and Forecasts, By Component (2020-2032) (USD Million)
10.3.2.7.3 France Smart Helmet Market Estimates and Forecasts, By End-Use (2020-2032) (USD Million)
10.3.2.8 UK
10.3.2.8.1 UK Smart Helmet Market Estimates and Forecasts, By Type (2020-2032) (USD Million)
10.3.2.8.2 UK Smart Helmet Market Estimates and Forecasts, By Component (2020-2032) (USD Million)
10.3.2.8.3 UK Smart Helmet Market Estimates and Forecasts, By End-Use (2020-2032) (USD Million)
10.3.2.9 Italy
10.3.2.9.1 Italy Smart Helmet Market Estimates and Forecasts, By Type (2020-2032) (USD Million)
10.3.2.9.2 Italy Smart Helmet Market Estimates and Forecasts, By Component (2020-2032) (USD Million)
10.3.2.9.3 Italy Smart Helmet Market Estimates and Forecasts, By End-Use (2020-2032) (USD Million)
10.3.2.10 Spain
10.3.2.10.1 Spain Smart Helmet Market Estimates and Forecasts, By Type (2020-2032) (USD Million)
10.3.2.10.2 Spain Smart Helmet Market Estimates and Forecasts, By Component (2020-2032) (USD Million)
10.3.2.10.3 Spain Smart Helmet Market Estimates and Forecasts, By End-Use (2020-2032) (USD Million)
10.3.2.11 Netherlands
10.3.2.11.1 Netherlands Smart Helmet Market Estimates and Forecasts, By Type (2020-2032) (USD Million)
10.3.2.11.2 Netherlands Smart Helmet Market Estimates and Forecasts, By Component (2020-2032) (USD Million)
10.3.2.11.3 Netherlands Smart Helmet Market Estimates and Forecasts, By End-Use (2020-2032) (USD Million)
10.3.2.12 Switzerland
10.3.2.12.1 Switzerland Smart Helmet Market Estimates and Forecasts, By Type (2020-2032) (USD Million)
10.3.2.12.2 Switzerland Smart Helmet Market Estimates and Forecasts, By Component (2020-2032) (USD Million)
10.3.2.12.3 Switzerland Smart Helmet Market Estimates and Forecasts, By End-Use (2020-2032) (USD Million)
10.3.2.13 Austria
10.3.2.13.1 Austria Smart Helmet Market Estimates and Forecasts, By Type (2020-2032) (USD Million)
10.3.2.13.2 Austria Smart Helmet Market Estimates and Forecasts, By Component (2020-2032) (USD Million)
10.3.2.13.3 Austria Smart Helmet Market Estimates and Forecasts, By End-Use (2020-2032) (USD Million)
10.3.2.14 Rest of Western Europe
10.3.2.14.1 Rest of Western Europe Smart Helmet Market Estimates and Forecasts, By Type (2020-2032) (USD Million)
10.3.2.14.2 Rest of Western Europe Smart Helmet Market Estimates and Forecasts, By Component (2020-2032) (USD Million)
10.3.2.14.3 Rest of Western Europe Smart Helmet Market Estimates and Forecasts, By End-Use (2020-2032) (USD Million)
10.4 Asia Pacific
10.4.1 Trends Analysis
10.4.2 Asia Pacific Smart Helmet Market Estimates and Forecasts, by Country (2020-2032) (USD Million)
10.4.3 Asia Pacific Smart Helmet Market Estimates and Forecasts, By Type (2020-2032) (USD Million)
10.4.4 Asia Pacific Smart Helmet Market Estimates and Forecasts, By Component (2020-2032) (USD Million)
10.4.5 Asia Pacific Smart Helmet Market Estimates and Forecasts, By End-Use (2020-2032) (USD Million)
10.4.6 China
10.4.6.1 China Smart Helmet Market Estimates and Forecasts, By Type (2020-2032) (USD Million)
10.4.6.2 China Smart Helmet Market Estimates and Forecasts, By Component (2020-2032) (USD Million)
10.4.6.3 China Smart Helmet Market Estimates and Forecasts, By End-Use (2020-2032) (USD Million)
10.4.7 India
10.4.7.1 India Smart Helmet Market Estimates and Forecasts, By Type (2020-2032) (USD Million)
10.4.7.2 India Smart Helmet Market Estimates and Forecasts, By Component (2020-2032) (USD Million)
10.4.7.3 India Smart Helmet Market Estimates and Forecasts, By End-Use (2020-2032) (USD Million)
10.4.8 Japan
10.4.8.1 Japan Smart Helmet Market Estimates and Forecasts, By Type (2020-2032) (USD Million)
10.4.8.2 Japan Smart Helmet Market Estimates and Forecasts, By Component (2020-2032) (USD Million)
10.4.8.3 Japan Smart Helmet Market Estimates and Forecasts, By End-Use (2020-2032) (USD Million)
10.4.9 South Korea
10.4.9.1 South Korea Smart Helmet Market Estimates and Forecasts, By Type (2020-2032) (USD Million)
10.4.9.2 South Korea Smart Helmet Market Estimates and Forecasts, By Component (2020-2032) (USD Million)
10.4.9.3 South Korea Smart Helmet Market Estimates and Forecasts, By End-Use (2020-2032) (USD Million)
10.4.10 Vietnam
10.4.10.1 Vietnam Smart Helmet Market Estimates and Forecasts, By Type (2020-2032) (USD Million)
10.4.10.2 Vietnam Smart Helmet Market Estimates and Forecasts, By Component (2020-2032) (USD Million)
10.4.10.3 Vietnam Smart Helmet Market Estimates and Forecasts, By End-Use (2020-2032) (USD Million)
10.4.11 Singapore
10.4.11.1 Singapore Smart Helmet Market Estimates and Forecasts, By Type (2020-2032) (USD Million)
10.4.11.2 Singapore Smart Helmet Market Estimates and Forecasts, By Component (2020-2032) (USD Million)
10.4.11.3 Singapore Smart Helmet Market Estimates and Forecasts, By End-Use (2020-2032) (USD Million)
10.4.12 Australia
10.4.12.1 Australia Smart Helmet Market Estimates and Forecasts, By Type (2020-2032) (USD Million)
10.4.12.2 Australia Smart Helmet Market Estimates and Forecasts, By Component (2020-2032) (USD Million)
10.4.12.3 Australia Smart Helmet Market Estimates and Forecasts, By End-Use (2020-2032) (USD Million)
10.4.13 Rest of Asia Pacific
10.4.13.1 Rest of Asia Pacific Smart Helmet Market Estimates and Forecasts, By Type (2020-2032) (USD Million)
10.4.13.2 Rest of Asia Pacific Smart Helmet Market Estimates and Forecasts, By Component (2020-2032) (USD Million)
10.4.13.3 Rest of Asia Pacific Smart Helmet Market Estimates and Forecasts, By End-Use (2020-2032) (USD Million)
10.5 Middle East and Africa
10.5.1 Middle East
10.5.1.1 Trends Analysis
10.5.1.2 Middle East Smart Helmet Market Estimates and Forecasts, by Country (2020-2032) (USD Million)
10.5.1.3 Middle East Smart Helmet Market Estimates and Forecasts, By Type (2020-2032) (USD Million)
10.5.1.4 Middle East Smart Helmet Market Estimates and Forecasts, By Component (2020-2032) (USD Million)
10.5.1.5 Middle East Smart Helmet Market Estimates and Forecasts, By End-Use (2020-2032) (USD Million)
10.5.1.6 UAE
10.5.1.6.1 UAE Smart Helmet Market Estimates and Forecasts, By Type (2020-2032) (USD Million)
10.5.1.6.2 UAE Smart Helmet Market Estimates and Forecasts, By Component (2020-2032) (USD Million)
10.5.1.6.3 UAE Smart Helmet Market Estimates and Forecasts, By End-Use (2020-2032) (USD Million)
10.5.1.7 Egypt
10.5.1.7.1 Egypt Smart Helmet Market Estimates and Forecasts, By Type (2020-2032) (USD Million)
10.5.1.7.2 Egypt Smart Helmet Market Estimates and Forecasts, By Component (2020-2032) (USD Million)
10.5.1.7.3 Egypt Smart Helmet Market Estimates and Forecasts, By End-Use (2020-2032) (USD Million)
10.5.1.8 Saudi Arabia
10.5.1.8.1 Saudi Arabia Smart Helmet Market Estimates and Forecasts, By Type (2020-2032) (USD Million)
10.5.1.8.2 Saudi Arabia Smart Helmet Market Estimates and Forecasts, By Component (2020-2032) (USD Million)
10.5.1.8.3 Saudi Arabia Smart Helmet Market Estimates and Forecasts, By End-Use (2020-2032) (USD Million)
10.5.1.9 Qatar
10.5.1.9.1 Qatar Smart Helmet Market Estimates and Forecasts, By Type (2020-2032) (USD Million)
10.5.1.9.2 Qatar Smart Helmet Market Estimates and Forecasts, By Component (2020-2032) (USD Million)
10.5.1.9.3 Qatar Smart Helmet Market Estimates and Forecasts, By End-Use (2020-2032) (USD Million)
10.5.1.10 Rest of Middle East
10.5.1.10.1 Rest of Middle East Smart Helmet Market Estimates and Forecasts, By Type (2020-2032) (USD Million)
10.5.1.10.2 Rest of Middle East Smart Helmet Market Estimates and Forecasts, By Component (2020-2032) (USD Million)
10.5.1.10.3 Rest of Middle East Smart Helmet Market Estimates and Forecasts, By End-Use (2020-2032) (USD Million)
10.5.2 Africa
10.5.2.1 Trends Analysis
10.5.2.2 Africa Smart Helmet Market Estimates and Forecasts, by Country (2020-2032) (USD Million)
10.5.2.3 Africa Smart Helmet Market Estimates and Forecasts, By Type (2020-2032) (USD Million)
10.5.2.4 Africa Smart Helmet Market Estimates and Forecasts, By Component (2020-2032) (USD Million)
10.5.2.5 Africa Smart Helmet Market Estimates and Forecasts, By End-Use (2020-2032) (USD Million)
10.5.2.6 South Africa
10.5.2.6.1 South Africa Smart Helmet Market Estimates and Forecasts, By Type (2020-2032) (USD Million)
10.5.2.6.2 South Africa Smart Helmet Market Estimates and Forecasts, By Component (2020-2032) (USD Million)
10.5.2.6.3 South Africa Smart Helmet Market Estimates and Forecasts, By End-Use (2020-2032) (USD Million)
10.5.2.7 Nigeria
10.5.2.7.1 Nigeria Smart Helmet Market Estimates and Forecasts, By Type (2020-2032) (USD Million)
10.5.2.7.2 Nigeria Smart Helmet Market Estimates and Forecasts, By Component (2020-2032) (USD Million)
10.5.2.7.3 Nigeria Smart Helmet Market Estimates and Forecasts, By End-Use (2020-2032) (USD Million)
10.5.2.8 Rest of Africa
10.5.2.8.1 Rest of Africa Smart Helmet Market Estimates and Forecasts, By Type (2020-2032) (USD Million)
10.5.2.8.2 Rest of Africa Smart Helmet Market Estimates and Forecasts, By Component (2020-2032) (USD Million)
10.5.2.8.3 Rest of Africa Smart Helmet Market Estimates and Forecasts, By End-Use (2020-2032) (USD Million)
10.6 Latin America
10.6.1 Trends Analysis
10.6.2 Latin America Smart Helmet Market Estimates and Forecasts, by Country (2020-2032) (USD Million)
10.6.3 Latin America Smart Helmet Market Estimates and Forecasts, By Type (2020-2032) (USD Million)
10.6.4 Latin America Smart Helmet Market Estimates and Forecasts, By Component (2020-2032) (USD Million)
10.6.5 Latin America Smart Helmet Market Estimates and Forecasts, By End-Use (2020-2032) (USD Million)
10.6.6 Brazil
10.6.6.1 Brazil Smart Helmet Market Estimates and Forecasts, By Type (2020-2032) (USD Million)
10.6.6.2 Brazil Smart Helmet Market Estimates and Forecasts, By Component (2020-2032) (USD Million)
10.6.6.3 Brazil Smart Helmet Market Estimates and Forecasts, By End-Use (2020-2032) (USD Million)
10.6.7 Argentina
10.6.7.1 Argentina Smart Helmet Market Estimates and Forecasts, By Type (2020-2032) (USD Million)
10.6.7.2 Argentina Smart Helmet Market Estimates and Forecasts, By Component (2020-2032) (USD Million)
10.6.7.3 Argentina Smart Helmet Market Estimates and Forecasts, By End-Use (2020-2032) (USD Million)
10.6.8 Colombia
10.6.8.1 Colombia Smart Helmet Market Estimates and Forecasts, By Type (2020-2032) (USD Million)
10.6.8.2 Colombia Smart Helmet Market Estimates and Forecasts, By Component (2020-2032) (USD Million)
10.6.8.3 Colombia Smart Helmet Market Estimates and Forecasts, By End-Use (2020-2032) (USD Million)
10.6.9 Rest of Latin America
10.6.9.1 Rest of Latin America Smart Helmet Market Estimates and Forecasts, By Type (2020-2032) (USD Million)
10.6.9.2 Rest of Latin America Smart Helmet Market Estimates and Forecasts, By Component (2020-2032) (USD Million)
10.6.9.3 Rest of Latin America Smart Helmet Market Estimates and Forecasts, By End-Use (2020-2032) (USD Million)
11. Company Profiles
11.1 Beijing BaBaALi Technology Co.Ltd
11.1.1 Company Overview
11.1.2 Financial
11.1.3 Products/ Services Offered
11.1.4 SWOT Analysis
11.2 Crosshelmet
11.2.1 Company Overview
11.2.2 Financial
11.2.3 Products/ Services Offered
11.2.4 SWOT Analysis
11.3 Bell Helmets
11.3.1 Company Overview
11.3.2 Financial
11.3.3 Products/ Services Offered
11.3.4 SWOT Analysis
11.4 Forcite Helmet Systems
11.4.1 Company Overview
11.4.2 Financial
11.4.3 Products/ Services Offered
11.4.4 SWOT Analysis
11.5 Intelligent Cranium Helmets LLC
11.5.1 Company Overview
11.5.2 Financial
11.5.3 Products/ Services Offered
11.5.4 SWOT Analysis
11.6 JARVISH INC
11.6.1 Company Overview
11.6.2 Financial
11.6.3 Products/ Services Offered
11.6.4 SWOT Analysis
11.7 LIVALL Tech Co., Ltd.
11.7.1 Company Overview
11.7.2 Financial
11.7.3 Products/ Services Offered
11.7.4 SWOT Analysis
11.8 H&H Sports Protection USA, Inc.
11.8.1 Company Overview
11.8.2 Financial
11.8.3 Products/ Services Offered
11.8.4 SWOT Analysis
11.9 Sena Technologies, Inc.
11.9.1 Company Overview
11.9.2 Financial
11.9.3 Products/ Services Offered
11.9.4 SWOT Analysis
11.10 Lumos Helmet US
11.10.1 Company Overview
11.10.2 Financial
11.10.3 Products/ Services Offered
11.10.4 SWOT Analysis
12. Use Cases and Best Practices
13. Conclusion
An accurate research report requires proper strategizing as well as implementation. There are multiple factors involved in the completion of good and accurate research report and selecting the best methodology to compete the research is the toughest part. Since the research reports we provide play a crucial role in any company’s decision-making process, therefore we at SNS Insider always believe that we should choose the best method which gives us results closer to reality. This allows us to reach at a stage wherein we can provide our clients best and accurate investment to output ratio.
Each report that we prepare takes a timeframe of 350-400 business hours for production. Starting from the selection of titles through a couple of in-depth brain storming session to the final QC process before uploading our titles on our website we dedicate around 350 working hours. The titles are selected based on their current market cap and the foreseen CAGR and growth.
The 5 steps process:
Step 1: Secondary Research:
Secondary Research or Desk Research is as the name suggests is a research process wherein, we collect data through the readily available information. In this process we use various paid and unpaid databases which our team has access to and gather data through the same. This includes examining of listed companies’ annual reports, Journals, SEC filling etc. Apart from this our team has access to various associations across the globe across different industries. Lastly, we have exchange relationships with various university as well as individual libraries.

Step 2: Primary Research
When we talk about primary research, it is a type of study in which the researchers collect relevant data samples directly, rather than relying on previously collected data. This type of research is focused on gaining content specific facts that can be sued to solve specific problems. Since the collected data is fresh and first hand therefore it makes the study more accurate and genuine.
We at SNS Insider have divided Primary Research into 2 parts.
Part 1 wherein we interview the KOLs of major players as well as the upcoming ones across various geographic regions. This allows us to have their view over the market scenario and acts as an important tool to come closer to the accurate market numbers. As many as 45 paid and unpaid primary interviews are taken from both the demand and supply side of the industry to make sure we land at an accurate judgement and analysis of the market.
This step involves the triangulation of data wherein our team analyses the interview transcripts, online survey responses and observation of on filed participants. The below mentioned chart should give a better understanding of the part 1 of the primary interview.

Part 2: In this part of primary research the data collected via secondary research and the part 1 of the primary research is validated with the interviews from individual consultants and subject matter experts.
Consultants are those set of people who have at least 12 years of experience and expertise within the industry whereas Subject Matter Experts are those with at least 15 years of experience behind their back within the same space. The data with the help of two main processes i.e., FGDs (Focused Group Discussions) and IDs (Individual Discussions). This gives us a 3rd party nonbiased primary view of the market scenario making it a more dependable one while collation of the data pointers.
Step 3: Data Bank Validation
Once all the information is collected via primary and secondary sources, we run that information for data validation. At our intelligence centre our research heads track a lot of information related to the market which includes the quarterly reports, the daily stock prices, and other relevant information. Our data bank server gets updated every fortnight and that is how the information which we collected using our primary and secondary information is revalidated in real time.

Step 4: QA/QC Process
After all the data collection and validation our team does a final level of quality check and quality assurance to get rid of any unwanted or undesired mistakes. This might include but not limited to getting rid of the any typos, duplication of numbers or missing of any important information. The people involved in this process include technical content writers, research heads and graphics people. Once this process is completed the title gets uploader on our platform for our clients to read it.
Step 5: Final QC/QA Process:
This is the last process and comes when the client has ordered the study. In this process a final QA/QC is done before the study is emailed to the client. Since we believe in giving our clients a good experience of our research studies, therefore, to make sure that we do not lack at our end in any way humanly possible we do a final round of quality check and then dispatch the study to the client.
Key Segments:
By Type
Full Face
Half Face
Hard Hat
By Component
Communication
Navigation
Camera
Others
By End-Use
Consumer
Manufacturing
Construction
Others
Request for Segment Customization as per your Business Requirement: Segment Customization Request
Regional Coverage:
North America
US
Canada
Mexico
Europe
Eastern Europe
Poland
Romania
Hungary
Turkey
Rest of Eastern Europe
Western Europe
Germany
France
UK
Italy
Spain
Netherlands
Switzerland
Austria
Rest of Western Europe
Asia Pacific
China
India
Japan
South Korea
Vietnam
Singapore
Australia
Rest of Asia Pacific
Middle East & Africa
Middle East
UAE
Egypt
Saudi Arabia
Qatar
Rest of Middle East
Africa
Nigeria
South Africa
Rest of Africa
Latin America
Brazil
Argentina
Colombia
Rest of Latin America
Request for Country Level Research Report: Country Level Customization Request
Available Customization
With the given market data, SNS Insider offers customization as per the company’s specific needs. The following customization options are available for the report:
Detailed Volume Analysis
Criss-Cross segment analysis (e.g. Product X Application)
Competitive Product Benchmarking
Geographic Analysis
Additional countries in any of the regions
Customized Data Representation
Detailed analysis and profiling of additional market players
The Contact Center Software Market was valued at USD 42.09 billion in 2023 and will reach USD 227.03 billion by 2032, growing at a CAGR of 20.64% by 2032.
The AI & Machine Learning Operationalization Software Market size was valued at USD 4.12 billion in 2023 and is expected to reach USD 59.66 billion by 2032, growing at a CAGR of 34.63% over the forecast period 2024-2032.
The Cloud-Based Contact Center Market Size was USD 23.27 Billion in 2023 and will reach USD 164.79 Billion by 2032 & grow at a CAGR of 24.30% by 2024-2032.
Network-as-a-Service (Naas) Market size was recorded at USD 19.2 billion in 2023 and is expected to reach USD 285.9 billion by 2032, growing at a CAGR of 35% over the forecast period of 2024-2032.
The Data Center Construction Market Size was valued at USD 219.02 Billion in 2023 and will reach USD 388.92 Billion by 2032 and grow at a CAGR of 6.7% by 2032.
The Broadband Services Market was valued at USD 445.3 Billion in 2023 and is expected to reach USD 1016.9 Billion by 2032, growing at a CAGR of 9.63% from 2024-2032.

Hi! Click one of our member below to chat on Phone
© 2025 All Rights Reserved by SNS Insider Pvt Ltd


