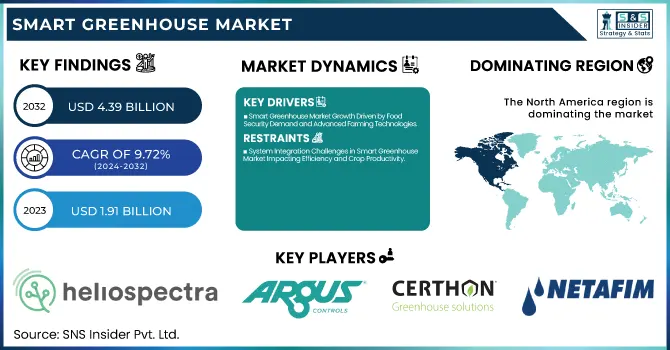
The Smart Greenhouse Market Size was valued at USD 1.91 Billion in 2023 and is expected to reach USD 4.39 Billion by 2032 and grow at a CAGR of 9.72% over the forecast period 2024-2032. The growth of the Smart Greenhouse Market is driven by improvement in many key metrics. Operational metrics focus on maximizing energy efficiency, conserving water, and managing the climate for ideal performance. Technology-driven production and crop metrics highlight system robustness, which translates to better yield consistency, reduced crop cycles, and overall plant health.
To Get more information on Smart Greenhouse Market - Request Free Sample Report
Metrics used in Innovation & R&D–show the pace of advancements in LED lighting, AI-based monitoring, and sensors that can enhance productivity. On the other hand, automation & control system metrics monitor the adoption of IoT devices, drone-assisted irrigation, and remote monitoring systems, optimizing environmental regulation and minimizing the need for manual processes and thereby improving greenhouse efficiency and quality of produce output.
Key Drivers:
Smart Greenhouse Market Growth Driven by Food Security Demand and Advanced Farming Technologies
The demand for food security is boosting the smart greenhouse market, along with the increasing requirement for automated farming solutions. However, smart greenhouses provide a controlled environment that can help improve yield, quality, and year-round production of crops which has crude importance in times when climate change is severely impeding conventional agriculture methods. With increasing numbers of global population and decreasing arable land, farmers are driven to use smart technologies to optimize the usage of water, fertilizers, and energy. Furthermore, the use of IoT, Artificial Intelligence monitoring systems, and highly-sensitized automation is transforming greenhouses with real-time remote monitoring and delivery of temperature, humidity, and lighting. This factor as well as the rising popularity of hydroponics and vertical farming further drive the growth of the market, as hydroponics and vertical farming are gaining momentum in urban regions with less space.
Restrain:
System Integration Challenges in Smart Greenhouse Market Impacting Efficiency and Crop Productivity
System integration is still one of the major intricacies in the smart greenhouse market. Smart greenhouse solutions frequently necessitate the integration of hardware elements such as sensors, HVAC systems, and irrigation controls with sophisticated software foundations. Meeting device compatibility, and then getting data to sync between the systems can prove to be a technical challenge, particularly for growers who may not have a great deal of technical aptitude. Also, dealing with maintaining and troubleshooting these interlinked systems can be difficult, which creates a risk of downtime that can affect crops and their harvests directly.
Opportunity:
Analytics and Cloud Integration Unlock Growth Opportunities in the Expanding Smart Greenhouse Market
Integration of analytics and cloud computing gadgets with intelligent greenhouse answers represents a primarily commercial enterprise possibility inside the market. These innovations give growers access to useful insights into their crops, anticipate trouble spots, and help automate irrigation cycles. Additionally, growth opportunities lie in government initiatives for sustainable agriculture and renewable energy integration. Several emerging economies are also adopting smart greenhouse technologies for food production, fuelling enormous opportunities for solution providers. As technology continues to progress, harnessing the power of AI, robotics, and machine learning in this growing sector will realize even more opportunities.
Challenges:
Skilled Labor Shortage and Security Risks Challenge Smart Greenhouse Adoption and Operational Stability
A big challenge is the need for expert high-skilled labor to supervision and manage smart image of greenhouses systems. The new automation tools, sensors from IoT, and AI-oriented solutions require a specialized level of technical knowledge from the workforce. This skill gap can inhibit adoption in areas with agricultural practices that are still largely traditional. In addition, environmental factors like bad weather, power failure, or system cost may prevent the greenhouse from operating properly which can lead to a high loss of crops. Another development is data security when systems are connected to clouds, hackers can try to access the greenhouse control systems and other sensitive agricultural data. Addressing these challenges will take more meaningful investment in simple-to-use technology, effective training programs, and strong institutional cybersecurity.
By Type
Hydroponics was the most prominent smart greenhouse type with a 56.4% market share in 2023. The reason for this dominance is that it produces the maximum yield of crops, with very little water and space. Due to high control of nutrients, pH level, and environment, Hydroponic systems have faster growth and high productivity. The ascendancy of consumer demand for pesticide-free, organic fruits, and vegetables has also been a factor in driving the adoption of hydroponic greenhouses.
Non-hydroponics systems are projected to register the fastest CAGR from 2024-2032. The growth of these farms is facilitated by the fact that they generally have lower setup complexity than aquaponics, making them more accessible to both traditional farmers and small-scale growers. However, non-hydroponic systems are being embraced in some areas, where water savings are not as important and soil cultivation practices are still commonplace. This awareness in consideration of the advantages of smart greenhouse technology will increase overall, across traditional farming disciplines, in non-hydroponics adopting elements, which will enable non-hydroponics adoption to accelerate.
By Material Type
Polyethylene led the smart greenhouse market, with a share of 61.8% in 2023. Polyethylene continues to lead this segment due to its low cost, low weight, and good UV resistance making it well suited as as greenhouse coverings. The reason for its use in commercial and small-scale setups as well is due to its flexibility and easy installation. Polyethylene sheets also serve as effective diffusers of light, ensuring an even growth of all plants.
Polycarbonate is anticipated to have the highest CAGR between 2024 and 2032. Polycarbonate is a preferred material for modern greenhouses as it offers better durability, impact resistance, and insulation than fiberglass. The capacity to retain heat offers good energy efficiency and helps to lower running costs. Continued adoption of new materials, especially polycarbonate, by growers to improve crop yield with extended growing seasons will create lucrative opportunities for the polycarbonate market over the next few years.
By Offering
In 2023, hardware dominated the smart greenhouse market, garnering 73.8% of the total smart greenhouse market share. The high demand for key components like HVAC systems, LED grow lights, irrigation systems, and sensors generates this dominance. These hardware components are essential to providing and maintaining an optimal environment, creating efficiencies as resources are used, as well as upgrading crop yields. In addition to this, hardware investments in smart greenhouse setups were also driven by the increasing uptake of automation tools.
From 2024 to 2032, software & services are expected to grow at the fastest rate. Determinants are also prompting the adoption of advanced greenhouse management platforms including the rising need for data-driven analyses, predictive analytics, and remote assessment of plants grown in greenhouses. They help growers monitor environmental conditions, automate irrigation, and use resources more efficiently. With growing interest among farmers for precision farming tools, there will be a potently high growth rate for the software & services segment.
By Component
The HVAC systems in the smart greenhouse market in 2023 accounted for the highest share of 42.9% of the total smart greenhouse market share. The HVAC system is, therefore, the most significant component in maintaining the greenhouse and, thus, is expected to maintain its dominance. HVAC systems significantly improve plant growth because they control a stable environment which is essential for crops, particularly in places with harsh weather. They are critical for large-scale commercial greenhouses because of their ability to control airflow, minimize heat stress, and improve air quality.
LED grow lights are projected to register the fastest CAGR from 2024-2032. The increased adoption of these lights can be attributed to their energy efficiency, long lifetime, and the fact that they can provide specific light spectrums for each species of plant. This segment will grow at a fast pace owing to the multiple advantages it offers such as improved crop quality, shorter growth cycles, and low energy costs, which is pushing growers to opt for LED solutions.
By End Use
In 2023, commercial growers occupied the leading share of the smart greenhouse market, estimating the total share to about 57.3%. This dominance is propelled by large-scale agricultural operations backed by smart greenhouse technology to enhance crop yield, quality, and year-round production. This contributes to the market-leading position of commercial growers who are increasingly adopting automated systems, sensors, and climate control solutions for resource optimization and productivity improvement purposes.
The fastest CAGR during the forecast period 2024-2032 is expected to be in Research & educational institutes. There is an upward trend in investments in agricultural research, the development of sustainable farming methods, and improved cultivation techniques driving this segment's growth. Many institutes are using smart greenhouse setups to experiment with various crop types, develop more climate-resilient varieties, and study new farming methods. This segment is expected to grow considerably in the next few years as consumers are increasingly showing demand for sustainable agriculture.
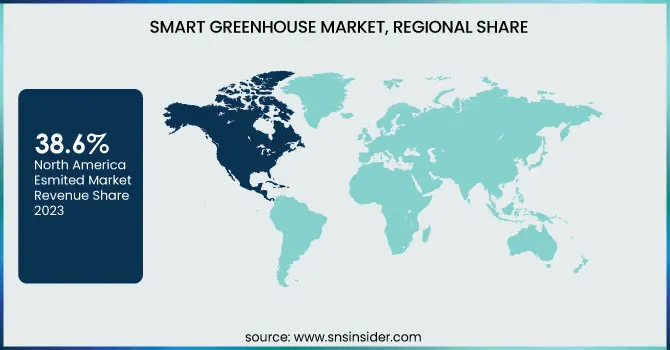
North America is estimated to hold a market share of 38.6% in the smart greenhouse market in the year 2023. Factors like higher concentration in advanced agricultural technologies, augmented investment in controlled environment agriculture (CEA), and growing organic demand would drive this dominance in the region. North America with its- big-scale greenhouse that is relaxed through automated climate control, irrigating systems, and sensor-based monitoring, the United States and Canada play important roles. As a working example, AppHarvest is one of the largest U.S.-based agri-tech firms, and in the heart of Kentucky powers one of the largest smart greenhouse facilities in the country using AI-enhanced systems to help maximize crop output. In a similar vein, BrightFarms utilizes controlled environment methods to grow fresh, chemical-free greens sold closer to home.
The Asia Pacific region is anticipated to garner the highest CAGR during the forecast period of 2024-2032, owing to the growing population leading to rising food demand, and initiatives by governments in promoting smart agriculture. Greenhouse technologies are emerging at a rapid rate among nations such as China, Japan, and India to provide food security while minimizing reliance on conventional agriculture. In Japan, Spread Co., Ltd. operates sophisticated vertical farming facilities that employ intelligent greenhouse technologies to produce leafy greens. China will have to bring massive hydroponics and smart greenhouse solutions and new technology from companies such as SananBio will help get higher yields to satisfy the food needs of its cities.
Get Customized Report as per Your Business Requirement - Enquiry Now
Some of the major players in the Smart Greenhouse Market are:
Heliospectra AB (MITRA LED)
Argus Control Systems Ltd. (Titan Controls)
Rough Brothers Inc. (Greenhouse Systems)
Certhon (Greenhouse Automation)
Greentech Agro LLC (Growtainer)
Netafim (Drip Irrigation Systems)
LumiGrow Inc. (TopLight)
Hort Americas (Grow Lights)
Cultivar Ltd. (Smart Controller)
Nexus Corporation (Glazing Systems)
Priva (Climate Control Systems)
Autogrow Systems Ltd. (IntelliDose)
Sensaphone (Sentinel Monitoring)
GreenTech Solutions Group (Smart Sensors)
Agrilution (Plantcube)
In December 2024, Heliospectra launched a dynamic multi-channel LED lighting solution designed to enhance precision crop growth, improve yields, and boost energy efficiency in smart greenhouses and controlled environments.
| Report Attributes | Details |
|---|---|
| Market Size in 2023 | USD 1.91 Billion |
| Market Size by 2032 | USD 4.39 Billion |
| CAGR | CAGR of 9.72% From 2024 to 2032 |
| Base Year | 2023 |
| Forecast Period | 2024-2032 |
| Historical Data | 2020-2022 |
| Report Scope & Coverage | Market Size, Segments Analysis, Competitive Landscape, Regional Analysis, DROC & SWOT Analysis, Forecast Outlook |
| Key Segments | • By Type (Hydroponics, Non-hydroponics) • By Material Type (Polyethylene, Polycarbonate, Other) • By Offering (Hardware, Software & Services) • By Component (HVAC Systems, LED Grow Lights, Control Systems & Sensors) • By End Use (Commercial Growers, Research & Educational Institutes, Retail Gardens, Others) |
| Regional Analysis/Coverage | North America (US, Canada, Mexico), Europe (Eastern Europe [Poland, Romania, Hungary, Turkey, Rest of Eastern Europe] Western Europe] Germany, France, UK, Italy, Spain, Netherlands, Switzerland, Austria, Rest of Western Europe]), Asia Pacific (China, India, Japan, South Korea, Vietnam, Singapore, Australia, Rest of Asia Pacific), Middle East & Africa (Middle East [UAE, Egypt, Saudi Arabia, Qatar, Rest of Middle East], Africa [Nigeria, South Africa, Rest of Africa], Latin America (Brazil, Argentina, Colombia, Rest of Latin America) |
| Company Profiles | Heliospectra AB, Argus Control Systems Ltd., Rough Brothers Inc., Certhon, Greentech Agro LLC, Netafim, LumiGrow Inc., Hort Americas, Cultivar Ltd., Nexus Corporation, Priva, Autogrow Systems Ltd., Sensaphone, GreenTech Solutions Group, Agrilution. |
Ans: The Smart Greenhouse Market is expected to grow at a CAGR of 9.72%.
Ans: Smart Greenhouse Market size was USD 1.91 billion in 2023 and is expected to Reach USD 4.39 billion by 2032.
Ans: The major key drivers for the growth of the smart greenhouse market include rising food demand, increasing adoption of automation technologies, climate change challenges, and the growing need for resource-efficient farming solutions.
Ans: The HVAC Systems segment dominated the Smart Greenhouse market in 2023.
Ans: In 2023, the North American region led the Smart Greenhouse market, capturing approximately 38.66% of the total market share.
1. Introduction
1.1 Market Definition
1.2 Scope (Inclusion and Exclusions)
1.3 Research Assumptions
2. Executive Summary
2.1 Market Overview
2.2 Regional Synopsis
2.3 Competitive Summary
3. Research Methodology
3.1 Top-Down Approach
3.2 Bottom-up Approach
3.3. Data Validation
3.4 Primary Interviews
4. Market Dynamics Impact Analysis
4.1 Market Driving Factors Analysis
4.1.1 Drivers
4.1.2 Restraints
4.1.3 Opportunities
4.1.4 Challenges
4.2 PESTLE Analysis
4.3 Porter’s Five Forces Model
5. Statistical Insights and Trends Reporting
5.1 Operational Metrics
5.2 Production & Crop Metrics
5.3 Innovation & R&D Metrics
5.4 Automation & Control System Metrics
6. Competitive Landscape
6.1 List of Major Companies, By Region
6.2 Market Share Analysis, By Region
6.3 Product Benchmarking
6.3.1 Product specifications and features
6.3.2 Pricing
6.4 Strategic Initiatives
6.4.1 Marketing and promotional activities
6.4.2 Distribution and Supply Chain Strategies
6.4.3 Expansion plans and new product launches
6.4.4 Strategic partnerships and collaborations
6.5 Technological Advancements
6.6 Market Positioning and Branding
7. Smart Greenhouse Market Segmentation, By Type
7.1 Chapter Overview
7.2 Hydroponics
7.2.1 Hydroponics Market Trends Analysis (2020-2032)
7.2.2 Hydroponics Market Size Estimates and Forecasts to 2032 (USD Billion)
7.3 Non-hydroponics
7.3.1 Non-hydroponics Market Trends Analysis (2020-2032)
7.3.2 Non-hydroponics Market Size Estimates and Forecasts to 2032 (USD Billion)
8. Smart Greenhouse Market Segmentation, By Material Type
8.1 Chapter Overview
8.2 Polyethylene
8.2.1 Polyethylene Market Trends Analysis (2020-2032)
8.2.2 Polyethylene Market Size Estimates And Forecasts To 2032 (USD Billion)
8.3 Polycarbonate
8.3.1 Polycarbonate Market Trends Analysis (2020-2032)
8.3.2 Polycarbonate Market Size Estimates And Forecasts To 2032 (USD Billion)
8.3 Other
8.3.1 Other Market Trends Analysis (2020-2032)
8.3.2 Other Market Size Estimates And Forecasts To 2032 (USD Billion)
9. Smart Greenhouse Market Segmentation, By Offering
9.1 Chapter Overview
9.2 Hardware
9.2.1 Hardware Market Trends Analysis (2020-2032)
9.2.2 Hardware Market Size Estimates And Forecasts To 2032 (USD Billion)
9.3 Software & Services
9.3.1 Software & Services Market Trends Analysis (2020-2032)
9.3.2 Software & Services Market Size Estimates And Forecasts To 2032 (USD Billion)
10. Smart Greenhouse Market Segmentation, By Component
10.1 Chapter Overview
10.2 HVAC Systems
10.2.1 HVAC Systems Market Trends Analysis (2020-2032)
10.2.2 HVAC Systems Market Size Estimates And Forecasts To 2032 (USD Billion)
10.3 LED Grow Lights
10.3.1 LED Grow Lights Market Trends Analysis (2020-2032)
10.3.2 LED Grow Lights Market Size Estimates And Forecasts To 2032 (USD Billion)
10.4 Control Systems & Sensors
10.4.1 Control Systems & Sensors Market Trends Analysis (2020-2032)
10.4.2 Control Systems & Sensors Market Size Estimates And Forecasts To 2032 (USD Billion)
11. Smart Greenhouse Market Segmentation, By End Use
11.1 Chapter Overview
11.2 Commercial Growers
11.2.1 Commercial Growers Market Trends Analysis (2020-2032)
11.2.2 Commercial Growers Market Size Estimates And Forecasts To 2032 (USD Billion)
11.3 Research & Educational Institutes
11.3.1 Research & Educational Institutes Market Trends Analysis (2020-2032)
11.3.2 Research & Educational Institutes Market Size Estimates And Forecasts To 2032 (USD Billion)
11.4 Retail Gardens
11.4.1 Retail Gardens Market Trends Analysis (2020-2032)
11.4.2 Retail Gardens Market Size Estimates And Forecasts To 2032 (USD Billion)
11.5 Others
11.5.1 Others Market Trends Analysis (2020-2032)
11.5.2 Others Market Size Estimates And Forecasts To 2032 (USD Billion)
12. Regional Analysis
12.1 Chapter Overview
12.2 North America
12.2.1 Trends Analysis
12.2.2 North America Smart Greenhouse Market Estimates And Forecasts, By Country (2020-2032) (USD Billion)
12.2.3 North America Smart Greenhouse Market Estimates And Forecasts, By Type (2020-2032) (USD Billion)
12.2.4 North America Smart Greenhouse Market Estimates And Forecasts, By Material Type (2020-2032) (USD Billion)
12.2.5 North America Smart Greenhouse Market Estimates And Forecasts, By Offering (2020-2032) (USD Billion)
12.2.6 North America Smart Greenhouse Market Estimates And Forecasts, By Component (2020-2032) (USD Billion)
12.2.7 North America Smart Greenhouse Market Estimates And Forecasts, By End Use (2020-2032) (USD Billion)
12.2.8 USA
12.2.8.1 USA Smart Greenhouse Market Estimates And Forecasts, By Type (2020-2032) (USD Billion)
12.2.8.2 USA Smart Greenhouse Market Estimates And Forecasts, By Material Type (2020-2032) (USD Billion)
12.2.8.3 USA Smart Greenhouse Market Estimates And Forecasts, By Offering (2020-2032) (USD Billion)
12.2.8.4 USA Smart Greenhouse Market Estimates And Forecasts, By Component (2020-2032) (USD Billion)
12.2.8.5 USA Smart Greenhouse Market Estimates And Forecasts, By End Use (2020-2032) (USD Billion)
12.2.9 Canada
12.2.9.1 Canada Smart Greenhouse Market Estimates And Forecasts, By Type (2020-2032) (USD Billion)
12.2.9.2 Canada Smart Greenhouse Market Estimates And Forecasts, By Material Type (2020-2032) (USD Billion)
12.2.9.3 Canada Smart Greenhouse Market Estimates And Forecasts, By Offering (2020-2032) (USD Billion)
12.2.9.4 Canada Smart Greenhouse Market Estimates And Forecasts, By Component (2020-2032) (USD Billion)
12.2.9.5 Canada Smart Greenhouse Market Estimates And Forecasts, By End Use (2020-2032) (USD Billion)
12.2.10 Mexico
12.2.10.1 Mexico Smart Greenhouse Market Estimates And Forecasts, By Type (2020-2032) (USD Billion)
12.2.10.2 Mexico Smart Greenhouse Market Estimates And Forecasts, By Material Type (2020-2032) (USD Billion)
12.2.10.3 Mexico Smart Greenhouse Market Estimates And Forecasts, By Offering (2020-2032) (USD Billion)
12.2.10.4 Mexico Smart Greenhouse Market Estimates And Forecasts, By Component (2020-2032) (USD Billion)
12.2.10.5 Mexico Smart Greenhouse Market Estimates And Forecasts, By End Use (2020-2032) (USD Billion)
12.3 Europe
12.3.1 Eastern Europe
12.3.1.1 Trends Analysis
12.3.1.2 Eastern Europe Smart Greenhouse Market Estimates And Forecasts, By Country (2020-2032) (USD Billion)
12.3.1.3 Eastern Europe Smart Greenhouse Market Estimates And Forecasts, By Type (2020-2032) (USD Billion)
12.3.1.4 Eastern Europe Smart Greenhouse Market Estimates And Forecasts, By Material Type (2020-2032) (USD Billion)
12.3.1.5 Eastern Europe Smart Greenhouse Market Estimates And Forecasts, By Offering (2020-2032) (USD Billion)
12.3.1.6 Eastern Europe Smart Greenhouse Market Estimates And Forecasts, By Component (2020-2032) (USD Billion)
12.3.1.7 Eastern Europe Smart Greenhouse Market Estimates And Forecasts, By End Use (2020-2032) (USD Billion)
12.3.1.8 Poland
12.3.1.8.1 Poland Smart Greenhouse Market Estimates And Forecasts, By Type (2020-2032) (USD Billion)
12.3.1.8.2 Poland Smart Greenhouse Market Estimates And Forecasts, By Material Type (2020-2032) (USD Billion)
12.3.1.8.3 Poland Smart Greenhouse Market Estimates And Forecasts, By Offering (2020-2032) (USD Billion)
12.3.1.8.4 Poland Smart Greenhouse Market Estimates And Forecasts, By Component (2020-2032) (USD Billion)
12.3.1.8.5 Poland Smart Greenhouse Market Estimates And Forecasts, By End Use (2020-2032) (USD Billion)
12.3.1.9 Romania
12.3.1.9.1 Romania Smart Greenhouse Market Estimates And Forecasts, By Type (2020-2032) (USD Billion)
12.3.1.9.2 Romania Smart Greenhouse Market Estimates And Forecasts, By Material Type (2020-2032) (USD Billion)
12.3.1.9.3 Romania Smart Greenhouse Market Estimates And Forecasts, By Offering (2020-2032) (USD Billion)
12.3.1.9.4 Romania Smart Greenhouse Market Estimates And Forecasts, By Component (2020-2032) (USD Billion)
12.3.1.9.5 Romania Smart Greenhouse Market Estimates And Forecasts, By End Use (2020-2032) (USD Billion)
12.3.1.10 Hungary
12.3.1.10.1 Hungary Smart Greenhouse Market Estimates And Forecasts, By Type (2020-2032) (USD Billion)
12.3.1.10.2 Hungary Smart Greenhouse Market Estimates And Forecasts, By Material Type (2020-2032) (USD Billion)
12.3.1.10.3 Hungary Smart Greenhouse Market Estimates And Forecasts, By Offering (2020-2032) (USD Billion)
12.3.1.10.4 Hungary Smart Greenhouse Market Estimates And Forecasts, By Component (2020-2032) (USD Billion)
12.3.1.10.5 Hungary Smart Greenhouse Market Estimates And Forecasts, By End Use (2020-2032) (USD Billion)
12.3.1.11 Turkey
12.3.1.11.1 Turkey Smart Greenhouse Market Estimates And Forecasts, By Type (2020-2032) (USD Billion)
12.3.1.11.2 Turkey Smart Greenhouse Market Estimates And Forecasts, By Material Type (2020-2032) (USD Billion)
12.3.1.11.3 Turkey Smart Greenhouse Market Estimates And Forecasts, By Offering (2020-2032) (USD Billion)
12.3.1.11.4 Turkey Smart Greenhouse Market Estimates And Forecasts, By Component (2020-2032) (USD Billion)
12.3.1.11.5 Turkey Smart Greenhouse Market Estimates And Forecasts, By End Use (2020-2032) (USD Billion)
12.3.1.12 Rest Of Eastern Europe
12.3.1.12.1 Rest Of Eastern Europe Smart Greenhouse Market Estimates And Forecasts, By Type (2020-2032) (USD Billion)
12.3.1.12.2 Rest Of Eastern Europe Smart Greenhouse Market Estimates And Forecasts, By Material Type (2020-2032) (USD Billion)
12.3.1.12.3 Rest Of Eastern Europe Smart Greenhouse Market Estimates And Forecasts, By Offering (2020-2032) (USD Billion)
12.3.1.12.4 Rest Of Eastern Europe Smart Greenhouse Market Estimates And Forecasts, By Component (2020-2032) (USD Billion)
12.3.1.12.5 Rest Of Eastern Europe Smart Greenhouse Market Estimates And Forecasts, By End Use (2020-2032) (USD Billion)
12.3.2 Western Europe
12.3.2.1 Trends Analysis
12.3.2.2 Western Europe Smart Greenhouse Market Estimates And Forecasts, By Country (2020-2032) (USD Billion)
12.3.2.3 Western Europe Smart Greenhouse Market Estimates And Forecasts, By Type (2020-2032) (USD Billion)
12.3.2.4 Western Europe Smart Greenhouse Market Estimates And Forecasts, By Material Type (2020-2032) (USD Billion)
12.3.2.5 Western Europe Smart Greenhouse Market Estimates And Forecasts, By Offering (2020-2032) (USD Billion)
12.3.2.6 Western Europe Smart Greenhouse Market Estimates And Forecasts, By Component (2020-2032) (USD Billion)
12.3.2.7 Western Europe Smart Greenhouse Market Estimates And Forecasts, By End Use (2020-2032) (USD Billion)
12.3.2.8 Germany
12.3.2.8.1 Germany Smart Greenhouse Market Estimates And Forecasts, By Type (2020-2032) (USD Billion)
12.3.2.8.2 Germany Smart Greenhouse Market Estimates And Forecasts, By Material Type (2020-2032) (USD Billion)
12.3.2.8.3 Germany Smart Greenhouse Market Estimates And Forecasts, By Offering (2020-2032) (USD Billion)
12.3.2.8.4 Germany Smart Greenhouse Market Estimates And Forecasts, By Component (2020-2032) (USD Billion)
12.3.2.8.5 Germany Smart Greenhouse Market Estimates And Forecasts, By End Use (2020-2032) (USD Billion)
12.3.2.9 France
12.3.2.9.1 France Smart Greenhouse Market Estimates And Forecasts, By Type (2020-2032) (USD Billion)
12.3.2.9.2 France Smart Greenhouse Market Estimates And Forecasts, By Material Type (2020-2032) (USD Billion)
12.3.2.9.3 France Smart Greenhouse Market Estimates And Forecasts, By Offering (2020-2032) (USD Billion)
12.3.2.9.4 France Smart Greenhouse Market Estimates And Forecasts, By Component (2020-2032) (USD Billion)
12.3.2.9.5 France Smart Greenhouse Market Estimates And Forecasts, By End Use (2020-2032) (USD Billion)
12.3.2.10 UK
12.3.2.10.1 UK Smart Greenhouse Market Estimates And Forecasts, By Type (2020-2032) (USD Billion)
12.3.2.10.2 UK Smart Greenhouse Market Estimates And Forecasts, By Material Type (2020-2032) (USD Billion)
12.3.2.10.3 UK Smart Greenhouse Market Estimates And Forecasts, By Offering (2020-2032) (USD Billion)
12.3.2.10.4 UK Smart Greenhouse Market Estimates And Forecasts, By Component (2020-2032) (USD Billion)
12.3.2.10.5 UK Smart Greenhouse Market Estimates And Forecasts, By End Use (2020-2032) (USD Billion)
12.3.2.11 Italy
12.3.2.11.1 Italy Smart Greenhouse Market Estimates And Forecasts, By Type (2020-2032) (USD Billion)
12.3.2.11.2 Italy Smart Greenhouse Market Estimates And Forecasts, By Material Type (2020-2032) (USD Billion)
12.3.2.11.3 Italy Smart Greenhouse Market Estimates And Forecasts, By Offering (2020-2032) (USD Billion)
12.3.2.11.4 Italy Smart Greenhouse Market Estimates And Forecasts, By Component (2020-2032) (USD Billion)
12.3.2.11.5 Italy Smart Greenhouse Market Estimates And Forecasts, By End Use (2020-2032) (USD Billion)
12.3.2.12 Spain
12.3.2.12.1 Spain Smart Greenhouse Market Estimates And Forecasts, By Type (2020-2032) (USD Billion)
12.3.2.12.2 Spain Smart Greenhouse Market Estimates And Forecasts, By Material Type (2020-2032) (USD Billion)
12.3.2.12.3 Spain Smart Greenhouse Market Estimates And Forecasts, By Offering (2020-2032) (USD Billion)
12.3.2.12.4 Spain Smart Greenhouse Market Estimates And Forecasts, By Component (2020-2032) (USD Billion)
12.3.2.12.5 Spain Smart Greenhouse Market Estimates And Forecasts, By End Use (2020-2032) (USD Billion)
12.3.2.13 Netherlands
12.3.2.13.1 Netherlands Smart Greenhouse Market Estimates And Forecasts, By Type (2020-2032) (USD Billion)
12.3.2.13.2 Netherlands Smart Greenhouse Market Estimates And Forecasts, By Material Type (2020-2032) (USD Billion)
12.3.2.13.3 Netherlands Smart Greenhouse Market Estimates And Forecasts, By Offering (2020-2032) (USD Billion)
12.3.2.13.4 Netherlands Smart Greenhouse Market Estimates And Forecasts, By Component (2020-2032) (USD Billion)
12.3.2.13.5 Netherlands Smart Greenhouse Market Estimates And Forecasts, By End Use (2020-2032) (USD Billion)
12.3.2.14 Switzerland
12.3.2.14.1 Switzerland Smart Greenhouse Market Estimates And Forecasts, By Type (2020-2032) (USD Billion)
12.3.2.14.2 Switzerland Smart Greenhouse Market Estimates And Forecasts, By Material Type (2020-2032) (USD Billion)
12.3.2.14.3 Switzerland Smart Greenhouse Market Estimates And Forecasts, By Offering (2020-2032) (USD Billion)
12.3.2.14.4 Switzerland Smart Greenhouse Market Estimates And Forecasts, By Component (2020-2032) (USD Billion)
12.3.2.12.5 Switzerland Smart Greenhouse Market Estimates And Forecasts, By End Use (2020-2032) (USD Billion)
12.3.2.15 Austria
12.3.2.15.1 Austria Smart Greenhouse Market Estimates And Forecasts, By Type (2020-2032) (USD Billion)
12.3.2.15.2 Austria Smart Greenhouse Market Estimates And Forecasts, By Material Type (2020-2032) (USD Billion)
12.3.2.15.3 Austria Smart Greenhouse Market Estimates And Forecasts, By Offering (2020-2032) (USD Billion)
12.3.2.15.4 Austria Smart Greenhouse Market Estimates And Forecasts, By Component (2020-2032) (USD Billion)
12.3.2.15.5 Austria Smart Greenhouse Market Estimates And Forecasts, By End Use (2020-2032) (USD Billion)
12.3.2.16 Rest Of Western Europe
12.3.2.16.1 Rest Of Western Europe Smart Greenhouse Market Estimates And Forecasts, By Type (2020-2032) (USD Billion)
12.3.2.16.2 Rest Of Western Europe Smart Greenhouse Market Estimates And Forecasts, By Material Type (2020-2032) (USD Billion)
12.3.2.16.3 Rest Of Western Europe Smart Greenhouse Market Estimates And Forecasts, By Offering (2020-2032) (USD Billion)
12.3.2.16.4 Rest Of Western Europe Smart Greenhouse Market Estimates And Forecasts, By Component (2020-2032) (USD Billion)
12.3.2.16.5 Rest Of Western Europe Smart Greenhouse Market Estimates And Forecasts, By End Use (2020-2032) (USD Billion)
12.4 Asia Pacific
12.4.1 Trends Analysis
12.4.2 Asia Pacific Smart Greenhouse Market Estimates And Forecasts, By Country (2020-2032) (USD Billion)
12.4.3 Asia Pacific Smart Greenhouse Market Estimates And Forecasts, By Type (2020-2032) (USD Billion)
12.4.4 Asia Pacific Smart Greenhouse Market Estimates And Forecasts, By Material Type (2020-2032) (USD Billion)
12.4.5 Asia Pacific Smart Greenhouse Market Estimates And Forecasts, By Offering (2020-2032) (USD Billion)
12.4.6 Asia Pacific Smart Greenhouse Market Estimates And Forecasts, By Component (2020-2032) (USD Billion)
12.4.7 Asia Pacific Smart Greenhouse Market Estimates And Forecasts, By End Use (2020-2032) (USD Billion)
12.4.8 China
12.4.8.1 China Smart Greenhouse Market Estimates And Forecasts, By Type (2020-2032) (USD Billion)
12.4.8.2 China Smart Greenhouse Market Estimates And Forecasts, By Material Type (2020-2032) (USD Billion)
12.4.8.3 China Smart Greenhouse Market Estimates And Forecasts, By Offering (2020-2032) (USD Billion)
12.4.8.4 China Smart Greenhouse Market Estimates And Forecasts, By Component (2020-2032) (USD Billion)
12.4.8.5 China Smart Greenhouse Market Estimates And Forecasts, By End Use (2020-2032) (USD Billion)
12.4.9 India
12.4.9.1 India Smart Greenhouse Market Estimates And Forecasts, By Type (2020-2032) (USD Billion)
12.4.9.2 India Smart Greenhouse Market Estimates And Forecasts, By Material Type (2020-2032) (USD Billion)
12.4.9.3 India Smart Greenhouse Market Estimates And Forecasts, By Offering (2020-2032) (USD Billion)
12.4.9.4 India Smart Greenhouse Market Estimates And Forecasts, By Component (2020-2032) (USD Billion)
12.4.9.5 India Smart Greenhouse Market Estimates And Forecasts, By End Use (2020-2032) (USD Billion)
12.4.10 Japan
12.4.10.1 Japan Smart Greenhouse Market Estimates And Forecasts, By Type (2020-2032) (USD Billion)
12.4.10.2 Japan Smart Greenhouse Market Estimates And Forecasts, By Material Type (2020-2032) (USD Billion)
12.4.10.3 Japan Smart Greenhouse Market Estimates And Forecasts, By Offering (2020-2032) (USD Billion)
12.4.10.4 Japan Smart Greenhouse Market Estimates And Forecasts, By Component (2020-2032) (USD Billion)
12.4.10.5 Japan Smart Greenhouse Market Estimates And Forecasts, By End Use (2020-2032) (USD Billion)
12.4.11 South Korea
12.4.11.1 South Korea Smart Greenhouse Market Estimates And Forecasts, By Type (2020-2032) (USD Billion)
12.4.11.2 South Korea Smart Greenhouse Market Estimates And Forecasts, By Material Type (2020-2032) (USD Billion)
12.4.11.3 South Korea Smart Greenhouse Market Estimates And Forecasts, By Offering (2020-2032) (USD Billion)
12.4.11.4 South Korea Smart Greenhouse Market Estimates And Forecasts, By Component (2020-2032) (USD Billion)
12.4.11.5 South Korea Smart Greenhouse Market Estimates And Forecasts, By End Use (2020-2032) (USD Billion)
12.4.12 Vietnam
12.4.12.1 Vietnam Smart Greenhouse Market Estimates And Forecasts, By Type (2020-2032) (USD Billion)
12.4.12.2 Vietnam Smart Greenhouse Market Estimates And Forecasts, By Material Type (2020-2032) (USD Billion)
12.4.12.3 Vietnam Smart Greenhouse Market Estimates And Forecasts, By Offering (2020-2032) (USD Billion)
12.4.12.4 Vietnam Smart Greenhouse Market Estimates And Forecasts, By Component (2020-2032) (USD Billion)
12.4.12.5 Vietnam Smart Greenhouse Market Estimates And Forecasts, By End Use (2020-2032) (USD Billion)
12.4.13 Singapore
12.4.13.1 Singapore Smart Greenhouse Market Estimates And Forecasts, By Type (2020-2032) (USD Billion)
12.4.13.2 Singapore Smart Greenhouse Market Estimates And Forecasts, By Material Type (2020-2032) (USD Billion)
12.4.13.3 Singapore Smart Greenhouse Market Estimates And Forecasts, By Offering (2020-2032) (USD Billion)
12.4.13.4 Singapore Smart Greenhouse Market Estimates And Forecasts, By Component (2020-2032) (USD Billion)
12.4.13.5 Singapore Smart Greenhouse Market Estimates And Forecasts, By End Use (2020-2032) (USD Billion)
12.4.14 Australia
12.4.14.1 Australia Smart Greenhouse Market Estimates And Forecasts, By Type (2020-2032) (USD Billion)
12.4.14.2 Australia Smart Greenhouse Market Estimates And Forecasts, By Material Type (2020-2032) (USD Billion)
12.4.14.3 Australia Smart Greenhouse Market Estimates And Forecasts, By Offering (2020-2032) (USD Billion)
12.4.14.4 Australia Smart Greenhouse Market Estimates And Forecasts, By Component (2020-2032) (USD Billion)
12.4.14.5 Australia Smart Greenhouse Market Estimates And Forecasts, By End Use (2020-2032) (USD Billion)
12.4.15 Rest Of Asia Pacific
12.4.15.1 Rest Of Asia Pacific Smart Greenhouse Market Estimates And Forecasts, By Type (2020-2032) (USD Billion)
12.4.15.2 Rest Of Asia Pacific Smart Greenhouse Market Estimates And Forecasts, By Material Type (2020-2032) (USD Billion)
12.4.15.3 Rest Of Asia Pacific Smart Greenhouse Market Estimates And Forecasts, By Offering (2020-2032) (USD Billion)
12.4.15.4 Rest Of Asia Pacific Smart Greenhouse Market Estimates And Forecasts, By Component (2020-2032) (USD Billion)
12.4.15.5 Rest Of Asia Pacific Smart Greenhouse Market Estimates And Forecasts, By End Use (2020-2032) (USD Billion)
12.5 Middle East And Africa
12.5.1 Middle East
12.5.1.1 Trends Analysis
12.5.1.2 Middle East Smart Greenhouse Market Estimates And Forecasts, By Country (2020-2032) (USD Billion)
12.5.1.3 Middle East Smart Greenhouse Market Estimates And Forecasts, By Type (2020-2032) (USD Billion)
12.5.1.4 Middle East Smart Greenhouse Market Estimates And Forecasts, By Material Type (2020-2032) (USD Billion)
12.5.1.5 Middle East Smart Greenhouse Market Estimates And Forecasts, By Offering (2020-2032) (USD Billion)
12.5.1.6 Middle East Smart Greenhouse Market Estimates And Forecasts, By Component (2020-2032) (USD Billion)
12.5.1.7 Middle East Smart Greenhouse Market Estimates And Forecasts, By End Use (2020-2032) (USD Billion)
12.5.1.8 UAE
12.5.1.8.1 UAE Smart Greenhouse Market Estimates And Forecasts, By Type (2020-2032) (USD Billion)
12.5.1.8.2 UAE Smart Greenhouse Market Estimates And Forecasts, By Material Type (2020-2032) (USD Billion)
12.5.1.8.3 UAE Smart Greenhouse Market Estimates And Forecasts, By Offering (2020-2032) (USD Billion)
12.5.1.8.4 UAE Smart Greenhouse Market Estimates And Forecasts, By Component (2020-2032) (USD Billion)
12.5.1.8.5 UAE Smart Greenhouse Market Estimates And Forecasts, By End Use (2020-2032) (USD Billion)
12.5.1.9 Egypt
12.5.1.9.1 Egypt Smart Greenhouse Market Estimates And Forecasts, By Type (2020-2032) (USD Billion)
12.5.1.9.2 Egypt Smart Greenhouse Market Estimates And Forecasts, By Material Type (2020-2032) (USD Billion)
12.5.1.9.3 Egypt Smart Greenhouse Market Estimates And Forecasts, By Offering (2020-2032) (USD Billion)
12.5.1.9.4 Egypt Smart Greenhouse Market Estimates And Forecasts, By Component (2020-2032) (USD Billion)
12.5.1.9.5 Egypt Smart Greenhouse Market Estimates And Forecasts, By End Use (2020-2032) (USD Billion)
12.5.1.10 Saudi Arabia
12.5.1.10.1 Saudi Arabia Smart Greenhouse Market Estimates And Forecasts, By Type (2020-2032) (USD Billion)
12.5.1.10.2 Saudi Arabia Smart Greenhouse Market Estimates And Forecasts, By Material Type (2020-2032) (USD Billion)
12.5.1.10.3 Saudi Arabia Smart Greenhouse Market Estimates And Forecasts, By Offering (2020-2032) (USD Billion)
12.5.1.10.4 Saudi Arabia Smart Greenhouse Market Estimates And Forecasts, By Component (2020-2032) (USD Billion)
12.5.1.10.5 Saudi Arabia Smart Greenhouse Market Estimates And Forecasts, By End Use (2020-2032) (USD Billion)
12.5.1.11 Qatar
12.5.1.11.1 Qatar Smart Greenhouse Market Estimates And Forecasts, By Type (2020-2032) (USD Billion)
12.5.1.11.2 Qatar Smart Greenhouse Market Estimates And Forecasts, By Material Type (2020-2032) (USD Billion)
12.5.1.11.3 Qatar Smart Greenhouse Market Estimates And Forecasts, By Offering (2020-2032) (USD Billion)
12.5.1.11.4 Qatar Smart Greenhouse Market Estimates And Forecasts, By Component (2020-2032) (USD Billion)
12.5.1.11.5 Qatar Smart Greenhouse Market Estimates And Forecasts, By End Use (2020-2032) (USD Billion)
12.5.1.12 Rest Of Middle East
12.5.1.12.1 Rest Of Middle East Smart Greenhouse Market Estimates And Forecasts, By Type (2020-2032) (USD Billion)
12.5.1.12.2 Rest Of Middle East Smart Greenhouse Market Estimates And Forecasts, By Material Type (2020-2032) (USD Billion)
12.5.1.12.3 Rest Of Middle East Smart Greenhouse Market Estimates And Forecasts, By Offering (2020-2032) (USD Billion)
12.5.1.12.4 Rest Of Middle East Smart Greenhouse Market Estimates And Forecasts, By Component (2020-2032) (USD Billion)
12.5.1.12.5 Rest Of Middle East Smart Greenhouse Market Estimates And Forecasts, By End Use (2020-2032) (USD Billion)
12.5.2 Africa
12.5.2.1 Trends Analysis
12.5.2.2 Africa Smart Greenhouse Market Estimates And Forecasts, By Country (2020-2032) (USD Billion)
12.5.2.3 Africa Smart Greenhouse Market Estimates And Forecasts, By Type (2020-2032) (USD Billion)
12.5.2.4 Africa Smart Greenhouse Market Estimates And Forecasts, By Material Type (2020-2032) (USD Billion)
12.5.2.5 Africa Smart Greenhouse Market Estimates And Forecasts, By Offering (2020-2032) (USD Billion)
12.5.2.6 Africa Smart Greenhouse Market Estimates And Forecasts, By Component (2020-2032) (USD Billion)
12.5.2.7 Africa Smart Greenhouse Market Estimates And Forecasts, By End Use (2020-2032) (USD Billion)
12.5.2.8 South Africa
12.5.2.8.1 South Africa Smart Greenhouse Market Estimates And Forecasts, By Type (2020-2032) (USD Billion)
12.5.2.8.2 South Africa Smart Greenhouse Market Estimates And Forecasts, By Material Type (2020-2032) (USD Billion)
12.5.2.8.3 South Africa Smart Greenhouse Market Estimates And Forecasts, By Offering (2020-2032) (USD Billion)
12.5.2.8.4 South Africa Smart Greenhouse Market Estimates And Forecasts, By Component (2020-2032) (USD Billion)
12.5.2.8.5 South Africa Smart Greenhouse Market Estimates And Forecasts, By End Use (2020-2032) (USD Billion)
12.5.2.9 Nigeria
12.5.2.9.1 Nigeria Smart Greenhouse Market Estimates And Forecasts, By Type (2020-2032) (USD Billion)
12.5.2.9.2 Nigeria Smart Greenhouse Market Estimates And Forecasts, By Material Type (2020-2032) (USD Billion)
12.5.2.9.3 Nigeria Smart Greenhouse Market Estimates And Forecasts, By Offering (2020-2032) (USD Billion)
12.5.2.9.4 Nigeria Smart Greenhouse Market Estimates And Forecasts, By Component (2020-2032) (USD Billion)
12.5.2.9.5 Nigeria Smart Greenhouse Market Estimates And Forecasts, By End Use (2020-2032) (USD Billion)
12.5.2.10 Rest Of Africa
12.5.2.10.1 Rest Of Africa Smart Greenhouse Market Estimates And Forecasts, By Type (2020-2032) (USD Billion)
12.5.2.10.2 Rest Of Africa Smart Greenhouse Market Estimates And Forecasts, By Material Type (2020-2032) (USD Billion)
12.5.2.10.3 Rest Of Africa Smart Greenhouse Market Estimates And Forecasts, By Offering (2020-2032) (USD Billion)
12.5.2.10.4 Rest Of Africa Smart Greenhouse Market Estimates And Forecasts, By Component (2020-2032) (USD Billion)
12.5.2.10.5 Rest Of Africa Smart Greenhouse Market Estimates And Forecasts, By End Use (2020-2032) (USD Billion)
12.6 Latin America
12.6.1 Trends Analysis
12.6.2 Latin America Smart Greenhouse Market Estimates And Forecasts, By Country (2020-2032) (USD Billion)
12.6.3 Latin America Smart Greenhouse Market Estimates And Forecasts, By Type (2020-2032) (USD Billion)
12.6.4 Latin America Smart Greenhouse Market Estimates And Forecasts, By Material Type (2020-2032) (USD Billion)
12.6.5 Latin America Smart Greenhouse Market Estimates And Forecasts, By Offering (2020-2032) (USD Billion)
12.6.6 Latin America Smart Greenhouse Market Estimates And Forecasts, By Component (2020-2032) (USD Billion)
12.6.7 Latin America Smart Greenhouse Market Estimates And Forecasts, By End Use (2020-2032) (USD Billion)
12.6.8 Brazil
12.6.8.1 Brazil Smart Greenhouse Market Estimates And Forecasts, By Type (2020-2032) (USD Billion)
12.6.8.2 Brazil Smart Greenhouse Market Estimates And Forecasts, By Material Type (2020-2032) (USD Billion)
12.6.8.3 Brazil Smart Greenhouse Market Estimates And Forecasts, By Offering (2020-2032) (USD Billion)
12.6.8.4 Brazil Smart Greenhouse Market Estimates And Forecasts, By Component (2020-2032) (USD Billion)
12.6.8.5 Brazil Smart Greenhouse Market Estimates And Forecasts, By End Use (2020-2032) (USD Billion)
12.6.9 Argentina
12.6.9.1 Argentina Smart Greenhouse Market Estimates And Forecasts, By Type (2020-2032) (USD Billion)
12.6.9.2 Argentina Smart Greenhouse Market Estimates And Forecasts, By Material Type (2020-2032) (USD Billion)
12.6.9.3 Argentina Smart Greenhouse Market Estimates And Forecasts, By Offering (2020-2032) (USD Billion)
12.6.9.4 Argentina Smart Greenhouse Market Estimates And Forecasts, By Component (2020-2032) (USD Billion)
12.6.9.5 Argentina Smart Greenhouse Market Estimates And Forecasts, By End Use (2020-2032) (USD Billion)
12.6.10 Colombia
12.6.10.1 Colombia Smart Greenhouse Market Estimates And Forecasts, By Type (2020-2032) (USD Billion)
12.6.10.2 Colombia Smart Greenhouse Market Estimates And Forecasts, By Material Type (2020-2032) (USD Billion)
12.6.10.3 Colombia Smart Greenhouse Market Estimates And Forecasts, By Offering (2020-2032) (USD Billion)
12.6.10.4 Colombia Smart Greenhouse Market Estimates And Forecasts, By Component (2020-2032) (USD Billion)
12.6.10.5 Colombia Smart Greenhouse Market Estimates And Forecasts, By End Use (2020-2032) (USD Billion)
12.6.11 Rest Of Latin America
12.6.11.1 Rest Of Latin America Smart Greenhouse Market Estimates And Forecasts, By Type (2020-2032) (USD Billion)
12.6.11.2 Rest Of Latin America Smart Greenhouse Market Estimates And Forecasts, By Material Type (2020-2032) (USD Billion)
12.6.11.3 Rest Of Latin America Smart Greenhouse Market Estimates And Forecasts, By Offering (2020-2032) (USD Billion)
12.6.11.4 Rest Of Latin America Smart Greenhouse Market Estimates And Forecasts, By Component (2020-2032) (USD Billion)
12.6.11.5 Rest Of Latin America Smart Greenhouse Market Estimates And Forecasts, By End Use (2020-2032) (USD Billion)
13. Company Profiles
13.1 Heliospectra AB
13.1.1 Company Overview
13.1.2 Financial
13.1.3 Products/ Services Offered
13.1.4 SWOT Analysis
13.2 Argus Control Systems Ltd
13.2.1 Company Overview
13.2.2 Financial
13.2.3 Products/ Services Offered
13.2.4 SWOT Analysis
13.3 Rough Brothers Inc
13.3.1 Company Overview
13.3.2 Financial
13.3.3 Products/ Services Offered
13.3.4 SWOT Analysis
13.4 Certhon
13.4.1 Company Overview
13.4.2 Financial
13.4.3 Products/ Services Offered
13.4.4 SWOT Analysis
13.5 Greentech Agro LLC
13.5.1 Company Overview
13.5.2 Financial
13.5.3 Products/ Services Offered
13.5.4 SWOT Analysis
13.6 Netafim
13.6.1 Company Overview
13.6.2 Financial
13.6.3 Products/ Services Offered
13.6.4 SWOT Analysis
13.7 LumiGrow Inc
13.7.1 Company Overview
13.7.2 Financial
13.7.3 Products/ Services Offered
13.7.4 SWOT Analysis
13.8 Hort Americas
13.8.1 Company Overview
13.8.2 Financial
13.8.3 Products/ Services Offered
13.8.4 SWOT Analysis
13.9 Cultivar Ltd
13.9.1 Company Overview
13.9.2 Financial
13.9.3 Products/ Services Offered
13.9.4 SWOT Analysis
13.10 Nexus Corporation
13.10.1 Company Overview
13.10.2 Financial
13.10.3 Products/ Services Offered
13.10.4 SWOT Analysis
14. Use Cases and Best Practices
15. Conclusion
An accurate research report requires proper strategizing as well as implementation. There are multiple factors involved in the completion of good and accurate research report and selecting the best methodology to compete the research is the toughest part. Since the research reports we provide play a crucial role in any company’s decision-making process, therefore we at SNS Insider always believe that we should choose the best method which gives us results closer to reality. This allows us to reach at a stage wherein we can provide our clients best and accurate investment to output ratio.
Each report that we prepare takes a timeframe of 350-400 business hours for production. Starting from the selection of titles through a couple of in-depth brain storming session to the final QC process before uploading our titles on our website we dedicate around 350 working hours. The titles are selected based on their current market cap and the foreseen CAGR and growth.
The 5 steps process:
Step 1: Secondary Research:
Secondary Research or Desk Research is as the name suggests is a research process wherein, we collect data through the readily available information. In this process we use various paid and unpaid databases which our team has access to and gather data through the same. This includes examining of listed companies’ annual reports, Journals, SEC filling etc. Apart from this our team has access to various associations across the globe across different industries. Lastly, we have exchange relationships with various university as well as individual libraries.

Step 2: Primary Research
When we talk about primary research, it is a type of study in which the researchers collect relevant data samples directly, rather than relying on previously collected data. This type of research is focused on gaining content specific facts that can be sued to solve specific problems. Since the collected data is fresh and first hand therefore it makes the study more accurate and genuine.
We at SNS Insider have divided Primary Research into 2 parts.
Part 1 wherein we interview the KOLs of major players as well as the upcoming ones across various geographic regions. This allows us to have their view over the market scenario and acts as an important tool to come closer to the accurate market numbers. As many as 45 paid and unpaid primary interviews are taken from both the demand and supply side of the industry to make sure we land at an accurate judgement and analysis of the market.
This step involves the triangulation of data wherein our team analyses the interview transcripts, online survey responses and observation of on filed participants. The below mentioned chart should give a better understanding of the part 1 of the primary interview.

Part 2: In this part of primary research the data collected via secondary research and the part 1 of the primary research is validated with the interviews from individual consultants and subject matter experts.
Consultants are those set of people who have at least 12 years of experience and expertise within the industry whereas Subject Matter Experts are those with at least 15 years of experience behind their back within the same space. The data with the help of two main processes i.e., FGDs (Focused Group Discussions) and IDs (Individual Discussions). This gives us a 3rd party nonbiased primary view of the market scenario making it a more dependable one while collation of the data pointers.
Step 3: Data Bank Validation
Once all the information is collected via primary and secondary sources, we run that information for data validation. At our intelligence centre our research heads track a lot of information related to the market which includes the quarterly reports, the daily stock prices, and other relevant information. Our data bank server gets updated every fortnight and that is how the information which we collected using our primary and secondary information is revalidated in real time.

Step 4: QA/QC Process
After all the data collection and validation our team does a final level of quality check and quality assurance to get rid of any unwanted or undesired mistakes. This might include but not limited to getting rid of the any typos, duplication of numbers or missing of any important information. The people involved in this process include technical content writers, research heads and graphics people. Once this process is completed the title gets uploader on our platform for our clients to read it.
Step 5: Final QC/QA Process:
This is the last process and comes when the client has ordered the study. In this process a final QA/QC is done before the study is emailed to the client. Since we believe in giving our clients a good experience of our research studies, therefore, to make sure that we do not lack at our end in any way humanly possible we do a final round of quality check and then dispatch the study to the client.
By Type
Hydroponics
Non-hydroponics
By Material Type
Polyethylene
Polycarbonate
Other
By Offering
Hardware
Software & Services
By Component
HVAC Systems
LED Grow Lights
Control Systems & Sensors
By End Use
Commercial Growers
Research & Educational Institutes
Retail Gardens
Others
Request for Segment Customization as per your Business Requirement: Segment Customization Request
Regional Coverage:
North America
US
Canada
Mexico
Europe
Eastern Europe
Poland
Romania
Hungary
Turkey
Rest of Eastern Europe
Western Europe
Germany
France
UK
Italy
Spain
Netherlands
Switzerland
Austria
Rest of Western Europe
Asia Pacific
China
India
Japan
South Korea
Vietnam
Singapore
Australia
Rest of Asia Pacific
Middle East & Africa
Middle East
UAE
Egypt
Saudi Arabia
Qatar
Rest of Middle East
Africa
Nigeria
South Africa
Rest of Africa
Latin America
Brazil
Argentina
Colombia
Rest of Latin America
Request for Country Level Research Report: Country Level Customization Request
Available Customization
With the given market data, SNS Insider offers customization as per the company’s specific needs. The following customization options are available for the report:
Detailed Volume Analysis
Criss-Cross segment analysis (e.g. Product X Application)
Competitive Product Benchmarking
Geographic Analysis
Additional countries in any of the regions
Customized Data Representation
Detailed analysis and profiling of additional market players
The Robotic Pool Cleaner Market was valued at 1.31 Billion in 2023 and is projected to reach USD 5.18 Billion by 2032, growing at a CAGR of 16.51% from 2024 to 2032.
The Switch Mode Power Supply Market Size was valued at USD 2.71 billion in 2023 and is expected to grow at 4.83% CAGR to reach USD 4.12 billion by 2032.
The Medical Electronic Market size was valued at USD 10.51 billion in 2023 and expected to reach USD 19.04 billion by 2032 and grow at a CAGR of 6.83% over the forecast period 2024-2032.
The Satellite Modem Market Size was valued at USD 507.2 million in 2023, and is expected to reach USD 1391.88 million by 2032, and grow at a CAGR of 11.87% over the forecast period 2024-2032.
The Smart Antenna Market Size was valued at USD 6.88 Billion in 2023 and is expected to grow at a CAGR of 8.68% to reach USD 14.54 Billion by 2032.
The Grow Lights Market Size was valued at USD 4.30 billion in 2023 and is expecting to grow at a CAGR of 16.37% to reach USD 16.38 billion by 2032.

Hi! Click one of our member below to chat on Phone
© 2025 All Rights Reserved by SNS Insider Pvt Ltd


