image

Smart Government Market Report Scope & Overview:

The Smart Government Market Size was valued at USD 34.35 Billion in 2023 and is expected to reach USD 167.47 Billion by 2032 and grow at a CAGR of 19.3% over the forecast period 2024-2032.

The market is driven by digital transformation, automation, and data-driven decision-making in public administration. Governments are adopting AI, blockchain, IoT, and big data analytics to enhance efficiency, transparency, and service delivery. Cloud computing enables seamless data exchange, while cybersecurity solutions safeguard sensitive information. Key initiatives include e-governance portals, AI-powered chatbots, and automated permitting systems. Investments in smart cities, 5G, and edge computing are fueling innovations like real-time traffic management and digital identity verification. Public-private partnerships play a vital role in modernizing government infrastructure, fostering innovation, and ensuring sustainable urban development.

Smart Government Market Dynamics

Key Drivers:

  • Increasing Adoption of AI, IoT, and Blockchain Enhances Smart Government Market Growth

Governments worldwide are increasingly integrating artificial intelligence (AI), the Internet of Things (IoT), and blockchain into public administration to enhance operational efficiency and transparency. AI-driven solutions enable predictive analytics, improving decision-making and resource allocation, while IoT facilitates real-time monitoring of infrastructure, public safety, and smart city initiatives. Blockchain ensures secure, tamper-proof transactions, enhancing trust in digital governance. Additionally, cloud-based platforms streamline interdepartmental communication and public service delivery. The growing demand for e-governance solutions, AI-powered citizen engagement tools, and automated workflows is accelerating digital transformation in the public sector, and driving market growth.

Restrain:

  • High Implementation Costs and Budget Constraints Hamper Smart Government Market Expansion

Despite the benefits, high costs associated with deploying smart government solutions hinder market expansion. Governments face budget constraints, especially in developing economies, where funding is prioritized for essential services. The integration of AI, IoT, and blockchain requires substantial initial investment in infrastructure, software, and workforce training. Additionally, maintaining cybersecurity and ensuring compliance with evolving regulatory frameworks add to financial burdens. Smaller municipalities and local governments often struggle to adopt smart technologies due to limited technical expertise and funding, slowing overall market adoption.

Opportunities:

  • Rising Investments in Smart City Initiatives Create Lucrative Opportunities for the Smart Government Market

Governments globally are investing in smart city projects, driving opportunities for smart governance solutions. These initiatives focus on sustainable urban development, intelligent transportation systems, and digital citizen services. Increased funding for smart infrastructure, including AI-driven traffic management, public safety solutions, and digital identity verification, is propelling market growth. Public-private partnerships (PPPs) are also expanding, enabling cost-effective technology adoption. As urbanization accelerates, smart city projects will continue to fuel demand for integrated governance platforms, creating lucrative opportunities in the market.

Challenges:

  • Data Privacy and Cybersecurity Threats Pose Major Challenges to the Smart Government Market

The increasing digitization of government services exposes sensitive data to cyber threats, hacking attempts, and data breaches. Smart governance relies on cloud platforms, IoT devices, and AI-powered analytics, making systems vulnerable to ransomware attacks, identity theft, and unauthorized access. Governments must implement strict data protection laws, advanced encryption, and multi-layered cybersecurity measures to mitigate risks. Additionally, compliance with global regulations such as GDPR and data sovereignty laws adds complexity to implementation. Without robust cybersecurity frameworks, concerns over data privacy and security vulnerabilities may hinder the widespread adoption of smart government technologies.

Smart Government Market Segments Analysis

By Services

The Professional Services segment led the Smart Government Market in 2023, capturing 61% of the revenue share, driven by the rising demand for consulting, integration, and training services in digital governance. Governments increasingly rely on IT service providers to implement cloud solutions, AI-driven citizen engagement platforms, and cybersecurity frameworks. Microsoft introduced Cloud for Sovereignty, designed to help governments maintain compliance and security in cloud-based operations. The segment’s dominance is further reinforced by smart city projects, e-governance initiatives, and regulatory reforms that require specialized expertise for implementation. As public sector agencies continue their shift toward digitalization, professional services firms play a crucial role in streamlining technology adoption, ensuring smooth integration, and offering cybersecurity training to enhance data protection and operational efficiency.

The Managed Services segment is projected to grow at the highest CAGR during the forecast period, fueled by government demand for outsourced IT solutions, cloud-based infrastructure management, and real-time cybersecurity monitoring. Amazon Web Services (AWS) and IBM expanded their managed cloud services for government agencies, with AWS launching AWS GovCloud updates for enhanced data sovereignty, and IBM introducing AI-driven managed security solutions to protect critical infrastructure.

Additionally, Cisco unveiled its Managed Detection and Response (MDR) service for public sector cybersecurity, helping agencies counter increasing cyber threats. The growing reliance on smart governance tools, predictive analytics, and AI-powered decision-making is driving demand for managed services.

By Solutions

The Government Resource Planning System segment led the Smart Government Market in 2023, capturing 32% of the revenue share, driven by the increasing adoption of centralized resource management, automation, and data-driven governance solutions. GRP systems help governments streamline budgeting, procurement, financial management, and human resources, ensuring efficient service delivery launched Oracle Cloud ERP for Public Sector, providing AI-powered analytics and automation to improve financial transparency and compliance. SAP introduced S/4HANA for the Government, enabling agencies to optimize their resource planning and improve efficiency. Additionally, Microsoft expanded its Dynamics 365 for the Public Sector, integrating AI-driven insights to enhance decision-making and operational efficiency.

The Remote Monitoring segment is set to grow at the highest CAGR in the forecast period, fueled by the increasing demand for real-time surveillance, predictive maintenance, and AI-powered monitoring systems in smart governance. Governments are leveraging IoT sensors, AI-driven analytics, and cloud-based platforms to monitor critical infrastructure, environmental conditions, and public safety. Cisco introduced AI-enhanced Smart City Monitoring Solutions, allowing real-time traffic and environmental tracking. Huawei launched its Intelligent Remote Monitoring System, utilizing 5G and edge computing for smart governance. IBM expanded its Watson IoT for the Public Sector, enabling predictive analytics for urban infrastructure and emergency response.

By Deployment

The Cloud segment led the Smart Government Market in 2023, driven by the increasing adoption of cloud-based digital governance solutions, scalable infrastructure, and AI-driven public service applications. Governments worldwide are migrating to cloud platforms to enhance data accessibility, interdepartmental collaboration, and cybersecurity resilience while reducing infrastructure costs.

AWS expanded its GovCloud platform, enhancing secure cloud storage and AI-based analytics for smart city initiatives. Microsoft introduced Cloud for Sovereignty, offering secure and compliant cloud solutions for government agencies handling sensitive data.

The On-Premise segment is projected to grow at the highest CAGR during the forecast period, driven by rising concerns over data sovereignty, security regulations, and mission-critical government applications. Many government agencies, particularly in defense, law enforcement, and public administration, require on-premise infrastructure to maintain full control over sensitive citizen data and national security systems. Palantir introduced on-premise AI analytics platforms for real-time decision-making in the security and defense sectors. As cybersecurity threats and regulatory compliance concerns rise, governments are increasingly investing in on-premise infrastructure, driving its high growth rate in the Smart Government Market.
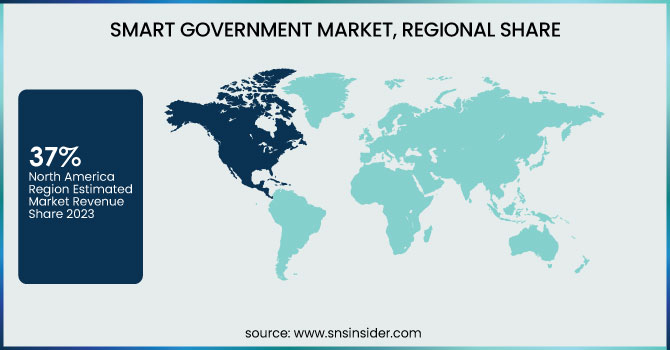
Regional Analysis

North America led the Smart Government Market in 2023, accounting for an estimated market share of over 37%, driven by strong investments in digital governance, AI-powered public services, and cybersecurity initiatives. The U.S. and Canada have been at the forefront of smart city projects, e-governance solutions, and cloud adoption in public administration. For example, the U.S. federal government expanded its FedRAMP (Federal Risk and Authorization Management Program) initiative, ensuring secure cloud adoption across agencies.

Additionally, Microsoft and AWS have enhanced their cloud-based solutions for public sector clients, supporting AI-driven citizen engagement and digital infrastructure. Cities like New York, San Francisco, and Toronto are heavily investing in IoT-based traffic monitoring, AI-powered emergency response systems, and blockchain-enabled government transactions, reinforcing North America’s leadership in the market.

Asia-Pacific is the fastest-growing region, expected to expand at an estimated CAGR of over 20.5% due to rapid urbanization, rising government digitization initiatives, and increasing smart city investments. Countries like China, India, Japan, and South Korea are implementing large-scale e-governance projects, AI-driven surveillance, and cloud-based government services.

For example, China’s Digital China initiative focuses on AI, big data, and blockchain-powered governance, while India’s Digital India program is promoting cloud-based service delivery for citizens.

Additionally, Huawei and Alibaba Cloud are launching AI-driven cloud solutions for public sector applications, while Singapore has integrated blockchain-based identity verification in government services. The region’s increasing focus on cybersecurity, IoT-based public infrastructure, and AI-powered governance solutions is fueling its high growth rate, making Asia-Pacific the most dynamic and rapidly expanding market for smart government technologies.

Key Players

Some of the major players in the Smart Government Market are:

  • Accela (Accela Civic Platform, Accela Permitting & Licensing) 

  • Amazon Web Services, Inc.  (AWS GovCloud, AWS Lambda for Government) 

  • ABB Ltd.  (ABB Ability Smart Cities, ABB Intelligent Transportation Systems) 

  • Capgemini S.A.  (Capgemini Smart City Solutions, Capgemini Government Digital Services) 

  • CivicPlus (CivicEngage, CivicRec) 

  • Cisco Systems, Inc.  (Cisco Kinetic for Cities, Cisco Smart+Connected Digital Platform) 

  • Entrust Datacard Corporation (Entrust IdentityGuard, Entrust Public Sector Security Solutions) 

  • Google LLC (Google Cloud for Government, Google Public Data Explorer) 

  • Hughes Identification Devices Global Corporation (HID Citizen ID Solutions, HID Government Smart Cards) 

  • Huawei Technologies Co., Ltd.  (Huawei Smart City Solutions, Huawei Cloud for Government) 

  • IBM Corporation (IBM Intelligent Operations Center, IBM Cloud for Government) 

  • Imex Systems, Inc.  (iGov Smart City Platform, iCity Digital Government Solutions) 

  • Microsoft Corporation (Microsoft Azure Government, Microsoft Dynamics 365 for Public Sector) 

  • Nokia Corporation (Nokia Smart City Solutions, Nokia Public Safety LTE) 

  • OpenGov (OpenGov Budgeting & Planning, OpenGov Reporting & Transparency) 

  • Oracle Corporation (Oracle Cloud for Government, Oracle Public Sector Compliance & Regulation) 

  • Palantir Technologies (Palantir Gotham, Palantir Foundry for Government) 

  • Salesforce, Inc.  (Salesforce Government Cloud, Salesforce Public Sector Solutions) 

  • Snowflake Inc.  (Snowflake Data Cloud for Government, Snowflake Secure Data Sharing) 

Recent Trends

  • January 2025: AWS announced plans to invest approximately $11 billion in Georgia to enhance its cloud computing and AI infrastructure. This expansion aims to support the growing demand for advanced data centers for AI-driven innovations and cloud services, aligning with broader industry trends in AI infrastructure development.

  • February 2025: ABB partnered with Indore Smart City Development Limited (ISCDL) to deploy next-generation digital technology, enabling a continuous electricity supply to homes and businesses in Indore, India. This collaboration positions Indore as a model for smart city projects across India.

  • December 2024: Accela announced the continuation of its Regional User Group Program for 2025, aiming to connect government agencies nationwide. Building on the success of previous events, the program fosters collaboration and innovation among public sector professionals.

Smart Government Market Report Scope:

Report Attributes Details
Market Size in 2023 US$ 34.35 Billion
Market Size by 2032 US$ 167.47 Billion
CAGR CAGR of 19.3 % From 2024 to 2032
Base Year 2023
Forecast Period 2024-2032
Historical Data 2020-2022
Report Scope & Coverage Market Size, Segments Analysis, Competitive  Landscape, Regional Analysis, DROC & SWOT Analysis, Forecast Outlook
Key Segments •By Services (Professional Services, Managed Services)
•By Solutions (Analytics, Security, Government Resource Planning System, Remote Monitoring, Network Management, Others)
•By Deployment (On-Premise, Cloud)
Regional Analysis/Coverage North America (US, Canada, Mexico), Europe (Eastern Europe [Poland, Romania, Hungary, Turkey, Rest of Eastern Europe] Western Europe] Germany, France, UK, Italy, Spain, Netherlands, Switzerland, Austria, Rest of Western Europe]), Asia Pacific (China, India, Japan, South Korea, Vietnam, Singapore, Australia, Rest of Asia Pacific), Middle East & Africa (Middle East [UAE, Egypt, Saudi Arabia, Qatar, Rest of Middle East], Africa [Nigeria, South Africa, Rest of Africa], Latin America (Brazil, Argentina, Colombia, Rest of Latin America)
Company Profiles Accela, Amazon Web Services, Inc., ABB Ltd., Capgemini S.A., CivicPlus, Cisco Systems, Inc., Entrust Datacard Corporation, Google LLC, Hughes Identification Devices Global Corporation, Huawei Technologies Co., Ltd., IBM Corporation, Imex Systems, Inc., Microsoft Corporation, Nokia Corporation, OpenGov, Oracle Corporation, Palantir Technologies, Salesforce, Inc., Snowflake Inc.

Frequently Asked Questions

Ans: The Smart Government Market is expected to grow at a CAGR of 19.3% during 2024-2032.

Ans: The Smart Government Market size was USD 34.35 billion in 2023 and is expected to Reach USD 167.47 billion by 2032.

Ans: The major growth factor of the Smart Government Market is the increasing adoption of AI, IoT, cloud computing, and blockchain to enhance digital governance, cybersecurity, and public service efficiency.

Ans: The Professional Services segment dominated the Smart Government Market.

Ans: North America dominated the Smart Government Market in 2023.

Table of Contents

1. Introduction

1.1 Market Definition

1.2 Scope (Inclusion and Exclusions)

1.3 Research Assumptions

2. Executive Summary

2.1 Market Overview

2.2 Regional Synopsis

2.3 Competitive Summary

3. Research Methodology

3.1 Top-Down Approach

3.2 Bottom-up Approach

3.3. Data Validation

3.4 Primary Interviews

4. Market Dynamics Impact Analysis

4.1 Market Driving Factors Analysis

4.1.1 Drivers

4.1.2 Restraints

4.1.3 Opportunities

4.1.4 Challenges

4.2 PESTLE Analysis

4.3 Porter’s Five Forces Model

5. Statistical Insights and Trends Reporting

5.1 Government IT Spending Trends (2023)

5.2 Digital Transformation Index for Government (2023)

5.3 Cybersecurity Breach Statistics in Public Sector (2023)

5.4 Citizen Engagement & Satisfaction Rate (2023)

6. Competitive Landscape

6.1 List of Major Companies, By Region

6.2 Market Share Analysis, By Region

6.3 Product Benchmarking

6.3.1 Product specifications and features

6.3.2 Pricing

6.4 Strategic Initiatives

6.4.1 Marketing and promotional activities

6.4.2 Distribution and Supply Chain Strategies

6.4.3 Expansion plans and new product launches

6.4.4 Strategic partnerships and collaborations

6.5 Technological Advancements

6.6 Market Positioning and Branding

7. Smart Government Market Segmentation, By Services

7.1 Chapter Overview

7.2 Professional Services

7.2.1 Professional Services Market Trends Analysis (2020-2032)

7.2.2 Professional Services Market Size Estimates and Forecasts to 2032 (USD Billion)

7.3 Managed Services

7.3.1 Managed Services Market Trends Analysis (2020-2032)

7.3.2 Managed Services Market Size Estimates and Forecasts to 2032 (USD Billion)

8. Smart Government Market Segmentation, By Solutions

8.1 Chapter Overview

8.2 Analytics 

8.2.1 Analytics Market Trends Analysis (2020-2032)

8.2.2 Analytics Market Size Estimates and Forecasts to 2032 (USD Billion)

8.3 Security

8.3.1 Security Market Trends Analysis (2020-2032)

8.3.2 Security Market Size Estimates and Forecasts to 2032 (USD Billion)

8.4 Government Resource Planning System

8.4.1 Government Resource Planning System Market Trends Analysis (2020-2032)

8.4.2 Government Resource Planning System Market Size Estimates and Forecasts to 2032 (USD Billion)

8.5 Remote Monitoring 

8.5.1 Remote Monitoring Market Trends Analysis (2020-2032)

8.5.2 Remote Monitoring Market Size Estimates and Forecasts to 2032 (USD Billion)

8.6 Network Management

8.6.1 Network Management Market Trends Analysis (2020-2032)

8.6.2 Network Management Market Size Estimates and Forecasts to 2032 (USD Billion)

8.7 Others

8.7.1 Others Market Trends Analysis (2020-2032)

8.7.2 Others Market Size Estimates and Forecasts to 2032 (USD Billion)

9. Smart Government Market Segmentation, By Deployment

9.1 Chapter Overview

9.2 On-Premise

9.2.1 On-Premise Market Trends Analysis (2020-2032)

9.2.2 On-Premise Market Size Estimates and Forecasts to 2032 (USD Billion)

9.3 Cloud

9.3.1 Cloud Market Trends Analysis (2020-2032)

9.3.2 Cloud Market Size Estimates and Forecasts to 2032 (USD Billion)

10. Regional Analysis

10.1 Chapter Overview

10.2 North America

10.2.1 Trends Analysis

10.2.2 North America Smart Government Market Estimates and Forecasts, by Country (2020-2032) (USD Billion)

10.2.3 North America Smart Government Market Estimates and Forecasts, By Services (2020-2032) (USD Billion) 

10.2.4 North America Smart Government Market Estimates and Forecasts, By Solutions (2020-2032) (USD Billion)

10.2.5 North America Smart Government Market Estimates and Forecasts, By Deployment (2020-2032) (USD Billion)

10.2.6 USA

10.2.6.1 USA Smart Government Market Estimates and Forecasts, By Services (2020-2032) (USD Billion)

10.2.6.2 USA Smart Government Market Estimates and Forecasts, By Solutions (2020-2032) (USD Billion)

10.2.6.3 USA Smart Government Market Estimates and Forecasts, By Deployment (2020-2032) (USD Billion)

10.2.7 Canada

10.2.7.1 Canada Smart Government Market Estimates and Forecasts, By Services (2020-2032) (USD Billion)

10.2.7.2 Canada Smart Government Market Estimates and Forecasts, By Solutions (2020-2032) (USD Billion)

10.2.7.3 Canada Smart Government Market Estimates and Forecasts, By Deployment (2020-2032) (USD Billion)

10.2.8 Mexico

10.2.8.1 Mexico Smart Government Market Estimates and Forecasts, By Services (2020-2032) (USD Billion)

10.2.8.2 Mexico Smart Government Market Estimates and Forecasts, By Solutions (2020-2032) (USD Billion)

10.2.8.3 Mexico Smart Government Market Estimates and Forecasts, By Deployment (2020-2032) (USD Billion)

10.3 Europe

10.3.1 Eastern Europe

10.3.1.1 Trends Analysis

10.3.1.2 Eastern Europe Smart Government Market Estimates and Forecasts, by Country (2020-2032) (USD Billion)

10.3.1.3 Eastern Europe Smart Government Market Estimates and Forecasts, By Services (2020-2032) (USD Billion) 

10.3.1.4 Eastern Europe Smart Government Market Estimates and Forecasts, By Solutions (2020-2032) (USD Billion)

10.3.1.5 Eastern Europe Smart Government Market Estimates and Forecasts, By Deployment (2020-2032) (USD Billion)

10.3.1.6 Poland

10.3.1.6.1 Poland Smart Government Market Estimates and Forecasts, By Services (2020-2032) (USD Billion)

10.3.1.6.2 Poland Smart Government Market Estimates and Forecasts, By Solutions (2020-2032) (USD Billion)

10.3.1.6.3 Poland Smart Government Market Estimates and Forecasts, By Deployment (2020-2032) (USD Billion)

10.3.1.7 Romania

10.3.1.7.1 Romania Smart Government Market Estimates and Forecasts, By Services (2020-2032) (USD Billion)

10.3.1.7.2 Romania Smart Government Market Estimates and Forecasts, By Solutions (2020-2032) (USD Billion)

10.3.1.7.3 Romania Smart Government Market Estimates and Forecasts, By Deployment (2020-2032) (USD Billion)

10.3.1.8 Hungary

10.3.1.8.1 Hungary Smart Government Market Estimates and Forecasts, By Services (2020-2032) (USD Billion)

10.3.1.8.2 Hungary Smart Government Market Estimates and Forecasts, By Solutions (2020-2032) (USD Billion)

10.3.1.8.3 Hungary Smart Government Market Estimates and Forecasts, By Deployment (2020-2032) (USD Billion)

10.3.1.9 Turkey

10.3.1.9.1 Turkey Smart Government Market Estimates and Forecasts, By Services (2020-2032) (USD Billion)

10.3.1.9.2 Turkey Smart Government Market Estimates and Forecasts, By Solutions (2020-2032) (USD Billion)

10.3.1.9.3 Turkey Smart Government Market Estimates and Forecasts, By Deployment (2020-2032) (USD Billion)

10.3.1.10 Rest of Eastern Europe

10.3.1.10.1 Rest of Eastern Europe Smart Government Market Estimates and Forecasts, By Services (2020-2032) (USD Billion)

10.3.1.10.2 Rest of Eastern Europe Smart Government Market Estimates and Forecasts, By Solutions (2020-2032) (USD Billion)

10.3.1.10.3 Rest of Eastern Europe Smart Government Market Estimates and Forecasts, By Deployment (2020-2032) (USD Billion)

10.3.2 Western Europe

10.3.2.1 Trends Analysis

10.3.2.2 Western Europe Smart Government Market Estimates and Forecasts, by Country (2020-2032) (USD Billion)

10.3.2.3 Western Europe Smart Government Market Estimates and Forecasts, By Services (2020-2032) (USD Billion) 

10.3.2.4 Western Europe Smart Government Market Estimates and Forecasts, By Solutions (2020-2032) (USD Billion)

10.3.2.5 Western Europe Smart Government Market Estimates and Forecasts, By Deployment (2020-2032) (USD Billion)

10.3.2.6 Germany

10.3.2.6.1 Germany Smart Government Market Estimates and Forecasts, By Services (2020-2032) (USD Billion)

10.3.2.6.2 Germany Smart Government Market Estimates and Forecasts, By Solutions (2020-2032) (USD Billion)

10.3.2.6.3 Germany Smart Government Market Estimates and Forecasts, By Deployment (2020-2032) (USD Billion)

10.3.2.7 France

10.3.2.7.1 France Smart Government Market Estimates and Forecasts, By Services (2020-2032) (USD Billion)

10.3.2.7.2 France Smart Government Market Estimates and Forecasts, By Solutions (2020-2032) (USD Billion)

10.3.2.7.3 France Smart Government Market Estimates and Forecasts, By Deployment (2020-2032) (USD Billion)

10.3.2.8 UK

10.3.2.8.1 UK Smart Government Market Estimates and Forecasts, By Services (2020-2032) (USD Billion)

10.3.2.8.2 UK Smart Government Market Estimates and Forecasts, By Solutions (2020-2032) (USD Billion)

10.3.2.8.3 UK Smart Government Market Estimates and Forecasts, By Deployment (2020-2032) (USD Billion)

10.3.2.9 Italy

10.3.2.9.1 Italy Smart Government Market Estimates and Forecasts, By Services (2020-2032) (USD Billion)

10.3.2.9.2 Italy Smart Government Market Estimates and Forecasts, By Solutions (2020-2032) (USD Billion)

10.3.2.9.3 Italy Smart Government Market Estimates and Forecasts, By Deployment (2020-2032) (USD Billion)

10.3.2.10 Spain

10.3.2.10.1 Spain Smart Government Market Estimates and Forecasts, By Services (2020-2032) (USD Billion)

10.3.2.10.2 Spain Smart Government Market Estimates and Forecasts, By Solutions (2020-2032) (USD Billion)

10.3.2.10.3 Spain Smart Government Market Estimates and Forecasts, By Deployment (2020-2032) (USD Billion)

10.3.2.11 Netherlands

10.3.2.11.1 Netherlands Smart Government Market Estimates and Forecasts, By Services (2020-2032) (USD Billion)

10.3.2.11.2 Netherlands Smart Government Market Estimates and Forecasts, By Solutions (2020-2032) (USD Billion)

10.3.2.11.3 Netherlands Smart Government Market Estimates and Forecasts, By Deployment (2020-2032) (USD Billion)

10.3.2.12 Switzerland

10.3.2.12.1 Switzerland Smart Government Market Estimates and Forecasts, By Services (2020-2032) (USD Billion)

10.3.2.12.2 Switzerland Smart Government Market Estimates and Forecasts, By Solutions (2020-2032) (USD Billion)

10.3.2.12.3 Switzerland Smart Government Market Estimates and Forecasts, By Deployment (2020-2032) (USD Billion)

10.3.2.13 Austria

10.3.2.13.1 Austria Smart Government Market Estimates and Forecasts, By Services (2020-2032) (USD Billion)

10.3.2.13.2 Austria Smart Government Market Estimates and Forecasts, By Solutions (2020-2032) (USD Billion)

10.3.2.13.3 Austria Smart Government Market Estimates and Forecasts, By Deployment (2020-2032) (USD Billion)

10.3.2.14 Rest of Western Europe

10.3.2.14.1 Rest of Western Europe Smart Government Market Estimates and Forecasts, By Services (2020-2032) (USD Billion)

10.3.2.14.2 Rest of Western Europe Smart Government Market Estimates and Forecasts, By Solutions (2020-2032) (USD Billion)

10.3.2.14.3 Rest of Western Europe Smart Government Market Estimates and Forecasts, By Deployment (2020-2032) (USD Billion)

10.4 Asia Pacific

10.4.1 Trends Analysis

10.4.2 Asia Pacific Smart Government Market Estimates and Forecasts, by Country (2020-2032) (USD Billion)

10.4.3 Asia Pacific Smart Government Market Estimates and Forecasts, By Services (2020-2032) (USD Billion) 

10.4.4 Asia Pacific Smart Government Market Estimates and Forecasts, By Solutions (2020-2032) (USD Billion)

10.4.5 Asia Pacific Smart Government Market Estimates and Forecasts, By Deployment (2020-2032) (USD Billion)

10.4.6 China

10.4.6.1 China Smart Government Market Estimates and Forecasts, By Services (2020-2032) (USD Billion)

10.4.6.2 China Smart Government Market Estimates and Forecasts, By Solutions (2020-2032) (USD Billion)

10.4.6.3 China Smart Government Market Estimates and Forecasts, By Deployment (2020-2032) (USD Billion)

10.4.7 India

10.4.7.1 India Smart Government Market Estimates and Forecasts, By Services (2020-2032) (USD Billion)

10.4.7.2 India Smart Government Market Estimates and Forecasts, By Solutions (2020-2032) (USD Billion)

10.4.7.3 India Smart Government Market Estimates and Forecasts, By Deployment (2020-2032) (USD Billion)

10.4.8 Japan

10.4.8.1 Japan Smart Government Market Estimates and Forecasts, By Services (2020-2032) (USD Billion)

10.4.8.2 Japan Smart Government Market Estimates and Forecasts, By Solutions (2020-2032) (USD Billion)

10.4.8.3 Japan Smart Government Market Estimates and Forecasts, By Deployment (2020-2032) (USD Billion)

10.4.9 South Korea

10.4.9.1 South Korea Smart Government Market Estimates and Forecasts, By Services (2020-2032) (USD Billion)

10.4.9.2 South Korea Smart Government Market Estimates and Forecasts, By Solutions (2020-2032) (USD Billion)

10.4.9.3 South Korea Smart Government Market Estimates and Forecasts, By Deployment (2020-2032) (USD Billion)

10.4.10 Vietnam

10.4.10.1 Vietnam Smart Government Market Estimates and Forecasts, By Services (2020-2032) (USD Billion)

10.4.10.2 Vietnam Smart Government Market Estimates and Forecasts, By Solutions (2020-2032) (USD Billion)

10.4.10.3 Vietnam Smart Government Market Estimates and Forecasts, By Deployment (2020-2032) (USD Billion)

10.4.11 Singapore

10.4.11.1 Singapore Smart Government Market Estimates and Forecasts, By Services (2020-2032) (USD Billion)

10.4.11.2 Singapore Smart Government Market Estimates and Forecasts, By Solutions (2020-2032) (USD Billion)

10.4.11.3 Singapore Smart Government Market Estimates and Forecasts, By Deployment (2020-2032) (USD Billion)

10.4.12 Australia

10.4.12.1 Australia Smart Government Market Estimates and Forecasts, By Services (2020-2032) (USD Billion)

10.4.12.2 Australia Smart Government Market Estimates and Forecasts, By Solutions (2020-2032) (USD Billion)

10.4.12.3 Australia Smart Government Market Estimates and Forecasts, By Deployment (2020-2032) (USD Billion)

10.4.13 Rest of Asia Pacific

10.4.13.1 Rest of Asia Pacific Smart Government Market Estimates and Forecasts, By Services (2020-2032) (USD Billion)

10.4.13.2 Rest of Asia Pacific Smart Government Market Estimates and Forecasts, By Solutions (2020-2032) (USD Billion)

10.4.13.3 Rest of Asia Pacific Smart Government Market Estimates and Forecasts, By Deployment (2020-2032) (USD Billion)

10.5 Middle East and Africa

10.5.1 Middle East

10.5.1.1 Trends Analysis

10.5.1.2 Middle East Smart Government Market Estimates and Forecasts, by Country (2020-2032) (USD Billion)

10.5.1.3 Middle East Smart Government Market Estimates and Forecasts, By Services (2020-2032) (USD Billion) 

10.5.1.4 Middle East Smart Government Market Estimates and Forecasts, By Solutions (2020-2032) (USD Billion)

10.5.1.5 Middle East Smart Government Market Estimates and Forecasts, By Deployment (2020-2032) (USD Billion)

10.5.1.6 UAE

10.5.1.6.1 UAE Smart Government Market Estimates and Forecasts, By Services (2020-2032) (USD Billion)

10.5.1.6.2 UAE Smart Government Market Estimates and Forecasts, By Solutions (2020-2032) (USD Billion)

10.5.1.6.3 UAE Smart Government Market Estimates and Forecasts, By Deployment (2020-2032) (USD Billion)

10.5.1.7 Egypt

10.5.1.7.1 Egypt Smart Government Market Estimates and Forecasts, By Services (2020-2032) (USD Billion)

10.5.1.7.2 Egypt Smart Government Market Estimates and Forecasts, By Solutions (2020-2032) (USD Billion)

10.5.1.7.3 Egypt Smart Government Market Estimates and Forecasts, By Deployment (2020-2032) (USD Billion)

10.5.1.8 Saudi Arabia

10.5.1.8.1 Saudi Arabia Smart Government Market Estimates and Forecasts, By Services (2020-2032) (USD Billion)

10.5.1.8.2 Saudi Arabia Smart Government Market Estimates and Forecasts, By Solutions (2020-2032) (USD Billion)

10.5.1.8.3 Saudi Arabia Smart Government Market Estimates and Forecasts, By Deployment (2020-2032) (USD Billion)

10.5.1.9 Qatar

10.5.1.9.1 Qatar Smart Government Market Estimates and Forecasts, By Services (2020-2032) (USD Billion)

10.5.1.9.2 Qatar Smart Government Market Estimates and Forecasts, By Solutions (2020-2032) (USD Billion)

10.5.1.9.3 Qatar Smart Government Market Estimates and Forecasts, By Deployment (2020-2032) (USD Billion)

10.5.1.10 Rest of Middle East

10.5.1.10.1 Rest of Middle East Smart Government Market Estimates and Forecasts, By Services (2020-2032) (USD Billion)

10.5.1.10.2 Rest of Middle East Smart Government Market Estimates and Forecasts, By Solutions (2020-2032) (USD Billion)

10.5.1.10.3 Rest of Middle East Smart Government Market Estimates and Forecasts, By Deployment (2020-2032) (USD Billion)

10.5.2 Africa

10.5.2.1 Trends Analysis

10.5.2.2 Africa Smart Government Market Estimates and Forecasts, by Country (2020-2032) (USD Billion)

10.5.2.3 Africa Smart Government Market Estimates and Forecasts, By Services (2020-2032) (USD Billion) 

10.5.2.4 Africa Smart Government Market Estimates and Forecasts, By Solutions (2020-2032) (USD Billion)

10.5.2.5 Africa Smart Government Market Estimates and Forecasts, By Deployment (2020-2032) (USD Billion)

10.5.2.6 South Africa

10.5.2.6.1 South Africa Smart Government Market Estimates and Forecasts, By Services (2020-2032) (USD Billion)

10.5.2.6.2 South Africa Smart Government Market Estimates and Forecasts, By Solutions (2020-2032) (USD Billion)

10.5.2.6.3 South Africa Smart Government Market Estimates and Forecasts, By Deployment (2020-2032) (USD Billion)

10.5.2.7 Nigeria

10.5.2.7.1 Nigeria Smart Government Market Estimates and Forecasts, By Services (2020-2032) (USD Billion)

10.5.2.7.2 Nigeria Smart Government Market Estimates and Forecasts, By Solutions (2020-2032) (USD Billion)

10.5.2.7.3 Nigeria Smart Government Market Estimates and Forecasts, By Deployment (2020-2032) (USD Billion)

10.5.2.8 Rest of Africa

10.5.2.8.1 Rest of Africa Smart Government Market Estimates and Forecasts, By Services (2020-2032) (USD Billion)

10.5.2.8.2 Rest of Africa Smart Government Market Estimates and Forecasts, By Solutions (2020-2032) (USD Billion)

10.5.2.8.3 Rest of Africa Smart Government Market Estimates and Forecasts, By Deployment (2020-2032) (USD Billion)

10.6 Latin America

10.6.1 Trends Analysis

10.6.2 Latin America Smart Government Market Estimates and Forecasts, by Country (2020-2032) (USD Billion)

10.6.3 Latin America Smart Government Market Estimates and Forecasts, By Services (2020-2032) (USD Billion) 

10.6.4 Latin America Smart Government Market Estimates and Forecasts, By Solutions (2020-2032) (USD Billion)

10.6.5 Latin America Smart Government Market Estimates and Forecasts, By Deployment (2020-2032) (USD Billion)

10.6.6 Brazil

10.6.6.1 Brazil Smart Government Market Estimates and Forecasts, By Services (2020-2032) (USD Billion)

10.6.6.2 Brazil Smart Government Market Estimates and Forecasts, By Solutions (2020-2032) (USD Billion)

10.6.6.3 Brazil Smart Government Market Estimates and Forecasts, By Deployment (2020-2032) (USD Billion)

10.6.7 Argentina

10.6.7.1 Argentina Smart Government Market Estimates and Forecasts, By Services (2020-2032) (USD Billion)

10.6.7.2 Argentina Smart Government Market Estimates and Forecasts, By Solutions (2020-2032) (USD Billion)

10.6.7.3 Argentina Smart Government Market Estimates and Forecasts, By Deployment (2020-2032) (USD Billion)

10.6.8 Colombia

10.6.8.1 Colombia Smart Government Market Estimates and Forecasts, By Services (2020-2032) (USD Billion)

10.6.8.2 Colombia Smart Government Market Estimates and Forecasts, By Solutions (2020-2032) (USD Billion)

10.6.8.3 Colombia Smart Government Market Estimates and Forecasts, By Deployment (2020-2032) (USD Billion)

10.6.9 Rest of Latin America

10.6.9.1 Rest of Latin America Smart Government Market Estimates and Forecasts, By Services (2020-2032) (USD Billion)

10.6.9.2 Rest of Latin America Smart Government Market Estimates and Forecasts, By Solutions (2020-2032) (USD Billion)

10.6.9.3 Rest of Latin America Smart Government Market Estimates and Forecasts, By Deployment (2020-2032) (USD Billion)

11. Company Profiles

11.1 Accela

11.1.1 Company Overview

11.1.2 Financial

11.1.3 Products/ Services Offered

11.1.4 SWOT Analysis

11.2 Amazon Web Services, Inc.

11.2.1 Company Overview

11.2.2 Financial

11.2.3 Products/ Services Offered

11.2.4 SWOT Analysis

11.3 ABB Ltd.

11.3.1 Company Overview

11.3.2 Financial

11.3.3 Products/ Services Offered

11.3.4 SWOT Analysis

11.4 Capgemini S.A.

11.4.1 Company Overview

11.4.2 Financial

11.4.3 Products/ Services Offered

11.4.4 SWOT Analysis

11.5 CivicPlus

11.5.1 Company Overview

11.5.2 Financial

11.5.3 Products/ Services Offered

11.5.4 SWOT Analysis

11.6 Cisco Systems, Inc.

11.6.1 Company Overview

11.6.2 Financial

11.6.3 Products/ Services Offered

11.6.4 SWOT Analysis

11.7 Entrust Datacard Corporation

           11.7.1 Company Overview

11.7.2 Financial

11.7.3 Products/ Services Offered

11.7.4 SWOT Analysis

11.8 Google LLC

11.8.1 Company Overview

11.8.2 Financial

11.8.3 Products/ Services Offered

11.8.4 SWOT Analysis

11.9 Hughes Identification Devices Global Corporation

11.9.1 Company Overview

11.9.2 Financial

11.9.3 Products/ Services Offered

11.9.4 SWOT Analysis

11.10 Huawei Technologies Co., Ltd.

11.10.1 Company Overview

11.10.2 Financial

11.10.3 Products/ Services Offered

11.10.4 SWOT Analysis

12. Use Cases and Best Practices

13. Conclusion

An accurate research report requires proper strategizing as well as implementation. There are multiple factors involved in the completion of good and accurate research report and selecting the best methodology to compete the research is the toughest part. Since the research reports we provide play a crucial role in any company’s decision-making process, therefore we at SNS Insider always believe that we should choose the best method which gives us results closer to reality. This allows us to reach at a stage wherein we can provide our clients best and accurate investment to output ratio.

Each report that we prepare takes a timeframe of 350-400 business hours for production. Starting from the selection of titles through a couple of in-depth brain storming session to the final QC process before uploading our titles on our website we dedicate around 350 working hours. The titles are selected based on their current market cap and the foreseen CAGR and growth.


The 5 steps process:

Step 1: Secondary Research:

Secondary Research or Desk Research is as the name suggests is a research process wherein, we collect data through the readily available information. In this process we use various paid and unpaid databases which our team has access to and gather data through the same. This includes examining of listed companies’ annual reports, Journals, SEC filling etc. Apart from this our team has access to various associations across the globe across different industries. Lastly, we have exchange relationships with various university as well as individual libraries.

Secondary Research

Step 2: Primary Research

When we talk about primary research, it is a type of study in which the researchers collect relevant data samples directly, rather than relying on previously collected data.  This type of research is focused on gaining content specific facts that can be sued to solve specific problems. Since the collected data is fresh and first hand therefore it makes the study more accurate and genuine.

We at SNS Insider have divided Primary Research into 2 parts.

Part 1 wherein we interview the KOLs of major players as well as the upcoming ones across various geographic regions. This allows us to have their view over the market scenario and acts as an important tool to come closer to the accurate market numbers. As many as 45 paid and unpaid primary interviews are taken from both the demand and supply side of the industry to make sure we land at an accurate judgement and analysis of the market.

This step involves the triangulation of data wherein our team analyses the interview transcripts, online survey responses and observation of on filed participants. The below mentioned chart should give a better understanding of the part 1 of the primary interview.

Primary Research

Part 2: In this part of primary research the data collected via secondary research and the part 1 of the primary research is validated with the interviews from individual consultants and subject matter experts.

Consultants are those set of people who have at least 12 years of experience and expertise within the industry whereas Subject Matter Experts are those with at least 15 years of experience behind their back within the same space. The data with the help of two main processes i.e., FGDs (Focused Group Discussions) and IDs (Individual Discussions). This gives us a 3rd party nonbiased primary view of the market scenario making it a more dependable one while collation of the data pointers.

Step 3: Data Bank Validation

Once all the information is collected via primary and secondary sources, we run that information for data validation. At our intelligence centre our research heads track a lot of information related to the market which includes the quarterly reports, the daily stock prices, and other relevant information. Our data bank server gets updated every fortnight and that is how the information which we collected using our primary and secondary information is revalidated in real time.

Data Bank Validation

Step 4: QA/QC Process

After all the data collection and validation our team does a final level of quality check and quality assurance to get rid of any unwanted or undesired mistakes. This might include but not limited to getting rid of the any typos, duplication of numbers or missing of any important information. The people involved in this process include technical content writers, research heads and graphics people. Once this process is completed the title gets uploader on our platform for our clients to read it.

Step 5: Final QC/QA Process:

This is the last process and comes when the client has ordered the study. In this process a final QA/QC is done before the study is emailed to the client. Since we believe in giving our clients a good experience of our research studies, therefore, to make sure that we do not lack at our end in any way humanly possible we do a final round of quality check and then dispatch the study to the client.

Key Segments:

  • By Services

    • Professional Services

    • Managed Services

  • By Solutions

    • Analytics  

    • Security

    • Government Resource Planning System

    • Remote Monitoring  

    • Network Management

    • Others

  • By Deployment

    • On-Premise

    • Cloud

Request for Segment Customization as per your Business Requirement: Segment Customization Request

Regional Coverage:

North America

  • US

  • Canada

  • Mexico

Europe

  • Eastern Europe

    • Poland

    • Romania

    • Hungary

    • Turkey

    • Rest of Eastern Europe

  • Western Europe

    • Germany

    • France

    • UK

    • Italy

    • Spain

    • Netherlands

    • Switzerland

    • Austria

    • Rest of Western Europe

Asia Pacific

  • China

  • India

  • Japan

  • South Korea

  • Vietnam

  • Singapore

  • Australia

  • Rest of Asia Pacific

Middle East & Africa

  • Middle East

    • UAE

    • Egypt

    • Saudi Arabia

    • Qatar

    • Rest of Middle East

  • Africa

    • Nigeria

    • South Africa

    • Rest of Africa

Latin America

  • Brazil

  • Argentina

  • Colombia

  • Rest of Latin America

Request for Country Level Research Report: Country Level Customization Request

Available Customization

With the given market data, SNS Insider offers customization as per the company’s specific needs. The following customization options are available for the report:

  • Detailed Volume Analysis

  • Criss-Cross segment analysis (e.g. Product X Application)

  • Competitive Product Benchmarking

  • Geographic Analysis

  • Additional countries in any of the regions

  • Customized Data Representation

  • Detailed analysis and profiling of additional market players


  •            5000 (33% Discount)


  •            8950 (40% Discount)


  •            3050 (23% Discount)

Start a Conversation

Hi! Click one of our member below to chat on Phone