Smart Display Market Size & Trends:
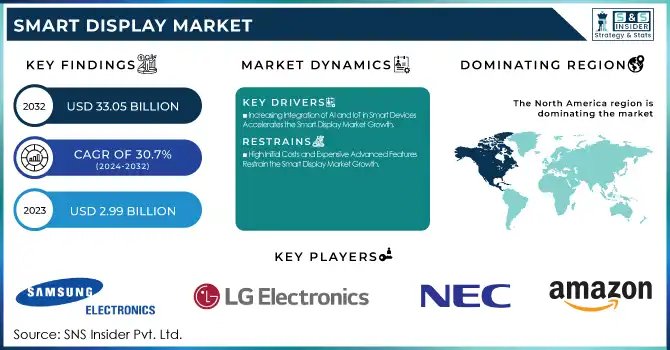
The Smart Display Market Size was valued at USD 3.90 Billion in 2024 and is expected to reach USD 33.05 Billion by 2032 and grow at a CAGR of 30.7% over the forecast period 2025-2032. The Market is driven by AI, IoT integration, and evolving consumer preferences across industries like residential, automotive, healthcare, and retail. Key insights include adoption rates, price trends, and the impact of production costs on affordability. Voice-controlled smart displays are gaining traction in home automation, security, and entertainment. Survey data highlights buying factors such as display size, resolution, and ecosystem compatibility. Increasing R&D investment signals continuous innovation, while integration with virtual assistants like Alexa and Google Assistant reflects ecosystem expansion.
Get More Information About This Research Report - Request Sample Report
Key Smart Display Market Trends:
-
Increasing integration of AI and IoT in smart displays for personalized, real-time, and automated functionalities across multiple sectors.
-
Rising adoption of voice assistants, gesture recognition, and advanced interfaces to improve user experience.
-
Growing use of smart displays in automotive applications, including dashboards, infotainment, and ADAS systems.
-
Expansion of smart home automation driving demand for intelligent and connected display solutions.
-
Surge in digital cockpit innovations fueled by electric and autonomous vehicles.
Smart Display Market Growth Drivers:
-
Increasing Integration of AI and IoT in Smart Devices Accelerates the Smart Display Market Growth
The rising adoption of AI and IoT in consumer electronics is a key driver of the smart display market. Smart displays equipped with voice assistants, real-time data processing, and automated functionalities enhance user experience across smart homes, healthcare, automotive, and retail sectors. AI-powered smart displays offer personalized recommendations, voice recognition, and seamless connectivity, increasing their appeal among consumers. Additionally, businesses leverage these displays for interactive marketing and customer engagement. The growing trend of smart home automation and demand for intelligent interfaces further fuels market expansion, making AI and IoT integration a significant growth catalyst.
Smart Display Market Restraints:
-
High Initial Costs and Expensive Advanced Features Restrain the Smart Display Market Growth
Despite increasing adoption, the high cost of smart displays limits market expansion, particularly in price-sensitive regions. Advanced features such as AI-powered voice assistants, high-resolution touchscreens, and IoT connectivity significantly increase production costs, making these devices expensive for consumers. Additionally, the integration of premium components like OLED displays and advanced sensors further escalates costs, restricting affordability. Businesses and consumers often hesitate to invest due to high upfront expenses and ongoing maintenance costs. This price barrier slows market penetration, particularly in developing economies, where cost-effectiveness remains a crucial factor influencing purchasing decisions.
Smart Display Market Opportunities:
-
Growing Adoption of Smart Displays in the Automotive Industry Creates Lucrative Market Opportunities
The increasing use of smart displays in automotive applications presents a major growth opportunity. Automakers are integrating smart displays into dashboards, infotainment systems, and advanced driver-assistance systems (ADAS) to enhance vehicle functionality and safety. Features such as voice-controlled navigation, real-time traffic updates, and gesture recognition are driving demand. Additionally, the rise of electric and autonomous vehicles is fueling the need for interactive and connected displays. With automotive manufacturers prioritizing digital cockpit solutions, the integration of AI-powered smart displays is expected to revolutionize in-car experiences, offering a significant opportunity for market expansion.
Smart Display Market Segment Analysis:
By Type
The Smart Home Display segment leads the smart display market, contributing 44.00% of revenue in 2024, driven by increasing smart home adoption and AI-powered virtual assistants. Leading brands like Amazon, Google, and Apple continue innovating with devices such as Amazon Echo Show, Google Nest Hub, and Apple’s HomePod with display integration, enhancing home automation, security, and entertainment. Companies are introducing features like facial recognition, adaptive brightness, and seamless IoT connectivity, making smart home displays central hubs for smart ecosystems.
The Smart Signage segment is witnessing the fastest growth, with a 31.26% CAGR, fueled by digital transformation in the retail, transportation, and corporate sectors. Businesses increasingly adopt interactive digital signage for dynamic content delivery, customer engagement, and targeted advertising. Major players like Samsung, LG, and Sony are introducing AI-powered and cloud-integrated signage solutions to enhance real-time content management.
By Technology
The LCD segment holds the largest revenue share in the smart display market, accounting for 67% in 2024, driven by its cost-effectiveness, energy efficiency, and widespread adoption across consumer electronics, retail, and automotive applications. LCD smart displays are preferred due to their affordability, high resolution, and compatibility with various smart ecosystems. Major players such as Samsung, LG, and Sharp continue to innovate with advanced LCD panels featuring improved refresh rates, enhanced brightness, and touch capabilities.
The LED segment is experiencing the highest CAGR at 31.62% within the forecasted period, driven by increasing demand for high-brightness, energy-efficient, and long-lasting smart displays. LED technology is widely adopted in smart signage, automotive dashboards, and high-end consumer electronics due to its superior color accuracy, contrast, and durability. Leading manufacturers like Samsung, Sony, and LG are launching innovative LED-based smart displays to enhance user experiences. In 2023, Samsung unveiled its latest MicroLED smart displays, offering ultra-high resolution and seamless modular designs for commercial and luxury home applications.
By End-user
The Smart City segment leads the smart display market, holding a 49% revenue share in 2024, driven by the increasing adoption of digital infrastructure, IoT-enabled urban solutions, and AI-powered public services. Governments and municipalities worldwide are investing in smart displays for real-time traffic updates, public safety alerts, interactive kiosks, and digital billboards to enhance city management and citizen engagement. Companies like Samsung, LG, and Panasonic are at the forefront, launching advanced smart signage solutions tailored for urban environments. In 2023, Samsung introduced AI-integrated smart street displays with real-time data analytics to provide commuters with traffic, weather, and emergency updates.
The Retail segment is experiencing the fastest growth in the smart display market, with a 32.79% CAGR, fueled by increasing digital transformation, personalized customer engagement, and AI-driven advertising solutions. Retailers are leveraging smart displays for interactive product promotions, digital price tags, self-checkout kiosks, and targeted advertising to enhance the shopping experience. Leading brands like Samsung, LG, and NEC are introducing AI-powered smart signage with real-time content customization, audience analytics, and gesture recognition.
Smart Display Market Regional Analysis:
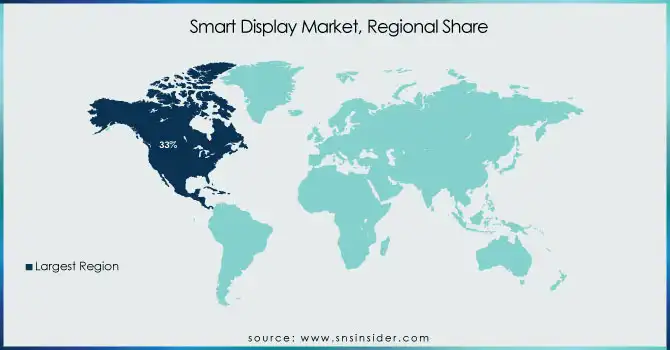
North America Smart Display Market Insights
North America led the smart display market in 2024, holding an estimated 33% market share, driven by strong consumer demand for smart home devices, rapid adoption of AI and IoT, and significant investments in smart city projects. The U.S. and Canada have witnessed widespread deployment of smart displays across industries, including retail, automotive, and healthcare. Additionally, North America’s thriving retail sector has seen the adoption of AI-driven digital signage for personalized advertising and customer engagement. Government initiatives supporting smart city infrastructure, such as interactive kiosks and real-time traffic displays, further bolster market growth. The presence of advanced 5G networks and high disposable incomes accelerates the adoption of smart displays across homes and businesses, reinforcing North America’s market dominance.
Asia Pacific Smart Display Market Insights
The Asia Pacific region is the fastest-growing market for smart displays, with an estimated CAGR of 32.15% in 2024, fueled by rapid urbanization, expanding smart home adoption, and increasing investments in digital infrastructure. Countries like China, Japan, South Korea, and India are driving this growth through government-backed smart city initiatives, rising disposable incomes, and increasing consumer awareness of AI-driven home automation. Leading companies such as Xiaomi, Huawei, and Samsung are launching cost-effective and technologically advanced smart displays, making them more accessible to a broader consumer base.
Europe Smart Display Market Insights
The Europe smart display market is expanding rapidly, fueled by strong adoption of smart home technologies, rising consumer demand for connected devices, and advancements in AI-powered voice assistants. The region benefits from robust infrastructure, high internet penetration, and growing emphasis on energy-efficient and secure smart solutions. Additionally, smart displays are increasingly deployed in retail, automotive, and healthcare sectors, enhancing interactive experiences and productivity. Regulatory support for digitalization further accelerates market growth across Europe.
Latin America (LATAM) and Middle East & Africa (MEA) Smart Display Market Insights
The Latin America (LATAM) and Middle East & Africa (MEA) smart display market is witnessing steady growth, driven by rising smartphone penetration, growing demand for affordable smart home devices, and expanding internet connectivity. In LATAM, increasing urbanization and adoption of voice-assisted technologies fuel market expansion. Meanwhile, MEA benefits from government-led smart city initiatives and investments in digital infrastructure, encouraging the use of AI-powered smart displays across residential, retail, and automotive applications.
Need any customization research on Smart Display Market - Enquiry Now
Smart Display Companies are:
-
Samsung Electronics
-
LG Electronics
-
NEC Corporation
-
Sony
-
Amazon(Amazon Echo Show, Amazon Fire TV Omni Series)
-
Apple
-
Facebook (Meta)
-
Magna
-
Google LLC (Alphabet Inc.)
-
JBL (Harman International)
-
Lenovo
-
HP Inc.
-
Dell Technologies
-
Sharp Corporation
-
TCL Electronics
-
ViewSonic Corporation
-
Huawei Technologies Co., Ltd.
-
Barco NV
Competitive Landscape for Smart Display Market:
Samsung is a leading player in the smart display market, offering advanced solutions such as Smart Monitors and Interactive Displays. Leveraging AI, IoT, and high-quality display technologies, Samsung drives adoption across smart homes, offices, and automotive applications. Its strong global presence and continuous innovation position it as a market leader.
-
In January 2025, Samsung unveiled its AI-powered Interactive Display (WAFX-P model) at Bett 2025, Europe's largest education technology exhibition. The display integrates Samsung AI Assistant, offering features like real-time transcription and generative AI to create more engaging and collaborative learning environments.
LG Electronics plays a significant role in the smart display market with products like the LG MyView Smart Monitor and Transparent OLED Signage. The company focuses on delivering AI-powered, energy-efficient, and immersive display solutions for smart homes, commercial spaces, and automotive applications, strengthening its global market presence through innovation and advanced connectivity.
-
In April 2024, LG launched its MyView Smart Monitors in India. These monitors cater to the growing demand for smart displays, offering enhanced connectivity and integrated applications suitable for both work and entertainment purposes.
| Report Attributes | Details |
|---|---|
| Market Size in 2024 | USD 3.90 Billion |
| Market Size by 2032 | USD 33.05 Billion |
| CAGR | CAGR of 30.7% From 2025 to 2032 |
| Base Year | 2024 |
| Forecast Period | 2025-2032 |
| Historical Data | 2021-2023 |
| Report Scope & Coverage | Market Size, Segments Analysis, Competitive Landscape, Regional Analysis, DROC & SWOT Analysis, Forecast Outlook |
| Key Segments | • By Technology (LED, LCD) • By Type (Smart Display Mirror, Smart Home Display, Smart Signage) • By End-user (Smart City, Automotive, Retail, Sports & Entertainment, Healthcare, Others) |
| Regional Analysis/Coverage | North America (US, Canada, Mexico), Europe (Germany, France, UK, Italy, Spain, Poland, Turkey, Rest of Europe), Asia Pacific (China, India, Japan, South Korea, Singapore, Australia, Taiwan, Rest of Asia Pacific), Middle East & Africa (UAE, Saudi Arabia, Qatar, South Africa, Rest of Middle East & Africa), Latin America (Brazil, Argentina, Rest of Latin America) |
| Company Profiles | Samsung Electronics, LG Electronics, NEC Corporation, Sony, Panasonic Corporation, Amazon, Apple, Facebook (Meta), Gentex, Magna, Google LLC (Alphabet Inc.), JBL (Harman International), Lenovo, HP Inc., Dell Technologies, Sharp Corporation, TCL Electronics, ViewSonic Corporation, Huawei Technologies, Barco NV. |
