Get more Information on Smart Contracts Market - Request Sample Report
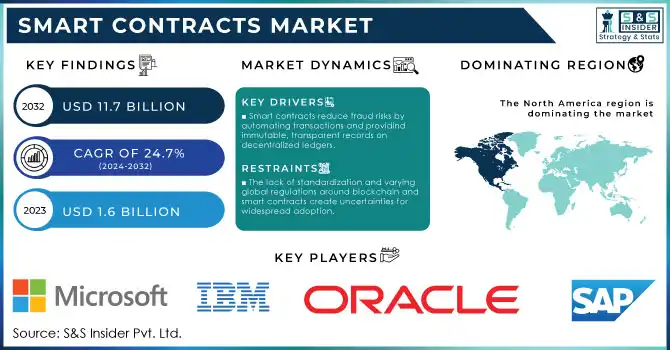
Smart Contracts Market Size was valued at USD 1.6 Billion in 2023 and is expected to reach USD 11.7 Billion by 2032, growing at a CAGR of 24.7% over the forecast period 2024-2032.
The smart contracts market has been growing swiftly due to an increasing acceptance of blockchain technology and its potential among the players of different industries. Smart contracts are self-executing contracts with the terms of the agreement directly written into lines of code, reducing costs, eliminating the need for intermediaries, and making transactions quick. Governments across the world are championing the adoption of smart contracts due to their potential to transform sectors such as finance, supply chain, and energy.
In the U.S., the Department of Energy has allocated significant funds toward blockchain and smart contract projects, signaling strong governmental backing for this technology in energy trading and management. Similarly, China has intensified its efforts to incorporate blockchain into trade finance, with the Ministry of Industry and Information Technology pushing for more blockchain-driven financial systems. Increased government-induced initiatives will further reaffirm their commitment to improve transparency, security, and efficiency in all digital systems which will have an indirect but a positive impact on the smart contracts market. In financial services, the use of smart contracts for blockchain-based solutions is also seeing strong momentum, with these technologies also being applied in areas such as loan management, securities trading, and claims processing. The ongoing adoption of blockchain in diverse industries, coupled with rising demand for automation and improved contract security, will continue to propel market growth. Regulatory frameworks, such as those being established by governments in North America, Europe, and Asia, will further enhance the credibility and reach of smart contracts, ensuring their application across more sectors in the coming years.
Market Dynamics
Drivers
The increasing adoption of blockchain technology in sectors like finance, supply chain, and real estate drives smart contracts' growth due to their ability to automate and secure transactions.
Smart contracts reduce fraud risks by automating transactions and providing immutable, transparent records on decentralized ledgers.
By eliminating intermediaries, smart contracts help reduce transaction costs and processing time, benefiting enterprises aiming to streamline operations.
Increasing adoption of blockchain technology across different industries such as finance, supply chain, healthcare, and real estate is one of the major factors driving the growth of the smart contracts market. The rise in popularity is driven by the understanding that blockchain has the potential to automate transactions, eliminate the need for third parties, and increase transparency and security. As an illustration, within the finance business, blockchain-based mostly good contracts at the moment are automating and enhancing processes equivalent to world funds and insurance coverage declare settlements. In 2023, The Adoption of Smart Contracts (FTI) stated that 70% of financial institutions will be exploring or implementing blockchain, with smart contracts forming a central part of their strategy. These institutions are adopting blockchain to enable faster processing and lower transaction fees, giving them an edge over competitors.
In supply chain management Walmart and IBM, are applying smart contracts for goods to be traced in real time, effectively preventing fraud and aiding compliance with regulatory standards. For instance, the blockchain-based food traceability system of Walmart speeds the tracing of food from six days to seconds. This is not limited to real estate, where smart contracts streamline the process of transferring ownership of properties, reducing the amount of paperwork needed to complete property transfers and, consequently, the amount of time it typically takes to do so. Increasing adoption across various industries is one of the key factors driving the growth of the Smart Contracts market.
Restraints
Designing, coding, and deploying smart contracts require advanced technical skills, which can pose a barrier for non-technical enterprises, Errors in code can lead to vulnerabilities, potentially resulting in financial losses or data breaches.
The lack of standardization and varying global regulations around blockchain and smart contracts create uncertainties for widespread adoption.
The technical complexity associated with developing and deploying smart contracts is one of the major restraining factors for the growth of the smart contracts market. Blockchain technology provides automation and efficiency, but it also demands specialized knowledge in coding and blockchain development to write smart contracts. This complexity can be daunting for organizations without in-house technical expertise, leading to increased reliance on third-party developers or blockchain experts. Additionally, just a minor coding mistake in the smart contracts can lead to huge loopholes which are very easily exploitable resulting in monetary losses. This is another technical barrier that is also applicable to the implementation process itself because organizations must ensure proper integration of smart contracts with existing systems. Consequently, this complexity dissuades many potential adopters from seeking this technology, predominantly in smaller businesses that do not have the time to mitigate these challenges .
Segment analysis
By Platform
In 2023, Ethereum dominated the smart contracts market, accounting for more than 48% of the market share. Ethereum benefits from wide adoption, a rich developer ecosystem, and a vibrant ecosystem of dApps and smart contracts that run on the platform. The blockchain takes a distinct appeal for being able to host a wide variety of contract types, in particular contracts that power decentralized finance (DeFi) apps. Its ecosystem facilitates the creation and execution of self-executing contracts for industries ranging from finance to real estate, making it the preferred platform for businesses and developers.
Ethereum’s growth has been further supported by continuous technological advancements, including the transition to Ethereum 2.0 in 2023, which switched the platform from energy-intensive proof-of-work (PoW) to proof-of-stake (PoS), significantly improving scalability and reducing transaction costs. Government backing in regions like Europe further reinforces Ethereum’s dominance. The European Blockchain Observatory, for example, acknowledges Ethereum as a foundational blockchain platform for public-private partnerships, leveraging its transparency and security for sectors such as governance and finance. Moreover, Ethereum also supports new technologies in crypto such as non-fungible tokens (NFTs) and dApps, thus bringing it to the forefront of blockchain development. Both the wide developer community, along with the major institutions on Ethereum guarantee a healthy level of adaptability in the platform, permitting it to change and adjust alongside the newly arrived regulatory and technological paradigms. With the continued adoption of blockchain technology, Ethereum is well-positioned to capture a significant portion of the market share, particularly if the platform demonstrates scalability and regulatory support over the long term.
By Contract Type
DAOs are another major segment of the smart contracts market, accounting for 36% of the type of contract in 2023. The DAO enables organizations to be governed by code, without the need for intermediaries and other typical governance infrastructure. Such a smart contract is gaining momentum in industries that put high value on decentralization in control and transparency like fintech, supply chain, and social governance. Most governments have realized the benefits of DAOs, especially because of how they help promote transparency and eliminate bureaucratic inefficiencies. For example, in Wyoming, USA, DAOs are now legally recognized as business entities, one of the most progressive moves regarding blockchain to date. This legal recognition has paved the way for the establishment of DAO-led enterprises that rely on blockchain-based smart contracts for governance, decision-making, and operations. DAOs are desirable because they self-execute as they are not piloted based upon human parties, but rather by a set of code so they are shielded from human error or corruption and can hold people more accountable.
Another factor adding to the rise of DAOs is the technical infrastructure provided by platforms such as Ethereum that can create and support DAOs. As they become a stronger tool for governance, finance, and the formation of new decentralized communities. Government involvement and the legal frameworks being built around DAOs will play a critical role in shaping their growth trajectory.
By Enterprises size
In 2023, the smart contracts market was dominated by the large enterprise segment, which accounted for 68% of the market share. Big organizations, especially in finance, trade, and supply chain, have been adopting blockchain, since it reduces costs, fastens operations, and improves visibility of the entire process. The adoption of smart contracts by these enterprises increases the automation of complex workflows while reducing the susceptibility to errors or fraud, an important feature for high-value transactions and cross-border trade. All over the globe, governments have invented industries on the back of large enterprises to smart contracts and blockchain. As an example, the SEC has promoted innovation on the blockchain in major financial markets in the USA, which has prompted many large firms to investigate solutions on the blockchain. Moreover, according to the U.S. Census Bureau, 76% of the Fortune 500 firms have undertaken blockchain projects which indicates the important contribution of large-scale companies to the growth of the market.
In addition, global enterprises in sectors such as automotive, logistics, and healthcare are utilizing smart contracts to promote supply chain efficiency and regulatory compliance. For the enterprise of the future as operations scale, smart contracts provide better audit trails and secure transaction mechanisms that will become essential for the enterprise doing big data and transaction volume. Nevertheless, as regulations become more favorable and the number of tailored smart contract solutions becomes more available, the prevalence of larger enterprises in the smart contracts market will likely continue for several years.
By End-user
The Banking, Financial Services, and Insurance (BFSI) sector continued to dominate the smart contracts market in 2023, contributing more than 37% to the global market share. There has been a growing need among the BFSI sector propelled by the use of blockchain technology to perform their works, like trade finance, insurance claims, and loan agreements, utilizing smart contract methods to ensure secure, transparent, and relatively cheap solutions to their daily problems via blockchain technology. Smart contracts automate these processes, ensuring reliability, minimizing human error, and fraud, and faster settlements.
The support of the government has been a significant factor in the integration of smart contracts in the BFSI sector. The Monetary Authority of Singapore (MAS) has, for example, been very active in encouraging the adoption of blockchain technology in financial services, with a focus on applications targeted to cross-border payments and smart contract-driven lending. Likewise, the European Central Bank (ECB) is considering the possibility of using blockchain to secure financial transactions, necessarily accelerating the broader use of smart contracts throughout European financial markets. As regulation becomes clearer and blockchain infrastructure matures, the market of smart contracts in BFSI will be larger. Smart contracts in BFSI help streamline operations, reduce settlement times, and ensure compliance with regulatory standards, which is especially critical in the wake of the 2008 financial crisis. As governments continue to support blockchain adoption through favorable regulatory frameworks, the BFSI sector’s reliance on smart contracts will likely continue to grow.
Need any customization research on Smart Contracts Market - Enquiry Now
Regional Analysis
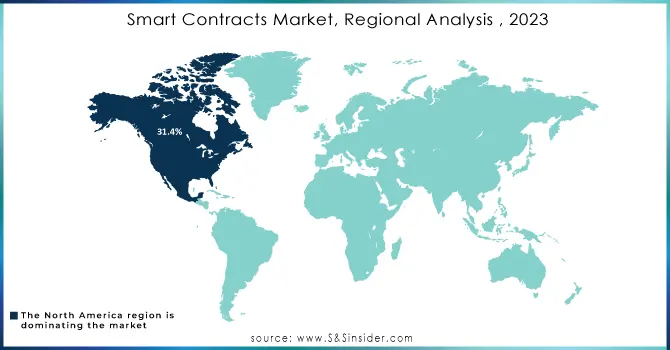
North America maintained its position as the dominant region for smart contracts, which accounted for a 32% share of the region. Factors like the technologically advanced infrastructure of the region together with a high adoption rate of blockchain technologies and powerful government initiatives have contributed to this dominance. The U.S. has seen substantial investments in blockchain startups, while Canada has made significant strides in integrating blockchain into government services.
On the other hand, the smart contracts market in Asia-Pacific is projected to be the fastest-growing region because of its highest CAGR. China, Japan, and South Korea countries launched massive blockchain initiatives, and substantial growth in such projects led by the government is only expected in the future. For instance, China’s Ministry of Industry and Information Technology has made substantial investments in blockchain research and application, with a focus on improving trade and finance mechanisms. Additionally, the vibrant tech startup ecosystem in India and other ASEAN countries further accelerates the adoption of smart contracts in industries like supply chain, fintech, and healthcare. The Asia-Pacific region’s rapid adoption is attributed to its lower transaction costs, faster scalability, and increasing government support for the development of the blockchain. The region captured a significant share of the worldwide smart contracts market share in 2023, and their share is expected to grow as nations in the region continue to adopt digital transformation.
Key Players
Service Providers / Manufacturers
IBM (IBM Blockchain, IBM Food Trust)
Microsoft (Azure Blockchain Service, Ethereum on Azure)
Amazon Web Services (AWS Blockchain Templates, Amazon Managed Blockchain)
Oracle (Oracle Blockchain Platform, Oracle Intelligent Track and Trace)
Accenture (Accenture Blockchain for Supply Chain, Accenture Blockchain for Finance)
SAP (SAP Leonardo, SAP Blockchain Technology)
R3 (Corda, Corda Enterprise)
Ethereum Foundation (Ethereum, Ethereum 2.0)
Blockchain Foundry (Smart Contracts on Bitcoin, Blockpress)
Hyperledger (Hyperledger Fabric, Hyperledger Indy)
Key Users
Deutsche Bank
JPMorgan Chase
HSBC
Wells Fargo
Nestlé
Walmart
L’Oreal
Maersk
Microsoft
UPS
Recent Developments:
June 2023: In order to make the EON Smart Contract Platform more accessible and robust, Horizen, a provider of public blockchain technology as well as Ankr, Web3's Infrastructure Provider are working together. A package of developer tools has been made available by this collaboration to enable the deployment of smart contract applications.
In March 2023, Chainlink Functions created the first serverless platform for integrating their smart contracts and decentralized applications (dApps) directly into the Web 2.0 API ecosystem. This service enables Web 2.0 API customization via the Chainlink network.
January 2023: Bunzz, a web3 development platform for decentralized applications, has raised USD 4.5 million in seed funding. Over 8,000 developers of DApps have made use of this platform, and the funding has helped strengthen Bunzzus's smart contract network.
Report Attributes | Details |
Market Size in 2023 | USD 1.6 Billion |
Market Size by 2032 | USD 11.7 Billion |
CAGR | CAGR of 24.7% From 2024 to 2032 |
Base Year | 2023 |
Forecast Period | 2024-2032 |
Historical Data | 2020-2022 |
Report Scope & Coverage | Market Size, Segments Analysis, Competitive Landscape, Regional Analysis, DROC & SWOT Analysis, Forecast Outlook |
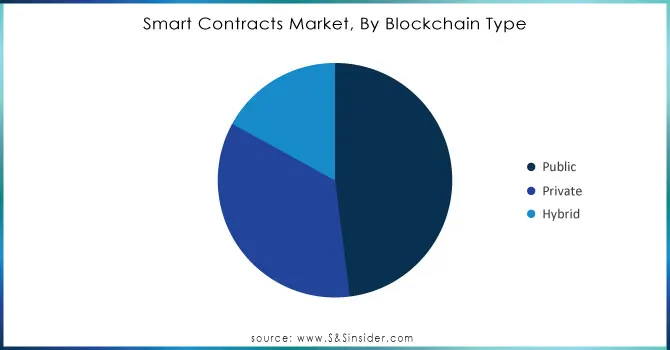
Key Segments | • By Platform (Ethereum, Cardano, BNB Chain, Polkadot, Others) • By Blockchain Type (Public, Private, Hybrid) • By Contract Type (Smart Legal Contracts, Decentralized Autonomous Organizations (DAO), Application Logic Contracts) • By Enterprise Size (Small & Medium Enterprises, Large Enterprises) • By End-Use (BFSI, Retail, Healthcare, Real Estate, Logistics, Others) |
Regional Analysis/Coverage | North America (US, Canada, Mexico), Europe (Eastern Europe [Poland, Romania, Hungary, Turkey, Rest of Eastern Europe] Western Europe] Germany, France, UK, Italy, Spain, Netherlands, Switzerland, Austria, Rest of Western Europe]), Asia Pacific (China, India, Japan, South Korea, Vietnam, Singapore, Australia, Rest of Asia Pacific), Middle East & Africa (Middle East [UAE, Egypt, Saudi Arabia, Qatar, Rest of Middle East], Africa [Nigeria, South Africa, Rest of Africa], Latin America (Brazil, Argentina, Colombia, Rest of Latin America) |
Company Profiles |
IBM, Microsoft, Amazon Web Services, Oracle, Accenture, SAP, R3, Ethereum Foundation, Blockchain Foundry, Hyperledger. |
Key Drivers | •The increasing adoption of blockchain technology in sectors like finance, supply chain, and real estate drives smart contracts' growth due to their ability to automate and secure transactions •Smart contracts reduce fraud risks by automating transactions and providing immutable, transparent records on decentralized ledgers. •By eliminating intermediaries, smart contracts help reduce transaction costs and processing time, benefiting enterprises aiming to streamline operations |
Market Retraints | •Designing, coding, and deploying smart contracts require advanced technical skills, which can pose a barrier for non-technical enterprises, Errors in code can lead to vulnerabilities, potentially resulting in financial losses or data breaches •The lack of standardization and varying global regulations around blockchain and smart contracts create uncertainties for widespread adoption. |
Ans. The projected market size for the Smart Contracts Market is USD 11.7 billion by 2032.
Ans. The CAGR of the Smart Contracts Market is 24.7% During the forecast period of 2024-2032.
Ans:- North America is likely to lead the smart contracts market over the forecast period.
Ans:- The primary growth tactics of Artificial Intelligence in Accounting market participants include merger and acquisition, business expansion, and product launch.
Ans:- The study includes a comprehensive analysis of Smart contracts Market trends, as well as present and future market forecasts as well as impact analysis for the projected period.
Porter's five forces analysis aids in the study of buyer and supplier potential as well as the competitive landscape etc
Table of Contents:
1. Introduction
1.1 Market Definition
1.2 Scope (Inclusion and Exclusions)
1.3 Research Assumptions
2. Executive Summary
2.1 Market Overview
2.2 Regional Synopsis
2.3 Competitive Summary
3. Research Methodology
3.1 Top-Down Approach
3.2 Bottom-up Approach
3.3. Data Validation
3.4 Primary Interviews
4. Market Dynamics Impact Analysis
4.1 Market Driving Factors Analysis
4.1.1 Drivers
4.1.2 Restraints
4.1.3 Opportunities
4.1.4 Challenges
4.2 PESTLE Analysis
4.3 Porter’s Five Forces Model
5. Statistical Insights and Trends Reporting
5.1 Feature Analysis, 2023
5.2 User Demographics, 2023
5.3 Integration Capabilities, by Software, 2023
5.4 Impact on Decision-making
6. Competitive Landscape
6.1 List of Major Companies, By Region
6.2 Market Share Analysis, By Region
6.3 Product Benchmarking
6.3.1 Product specifications and features
6.3.2 Pricing
6.4 Strategic Initiatives
6.4.1 Marketing and promotional activities
6.4.2 Distribution and supply chain strategies
6.4.3 Expansion plans and new product launches
6.4.4 Strategic partnerships and collaborations
6.5 Technological Advancements
6.6 Market Positioning and Branding
7. Smart Contracts Market Segmentation, By Platform
7.1 Chapter Overview
7.2 Ethereum
7.2.1 Ethereum Market Trends Analysis (2020-2032)
7.2.2 Ethereum Market Size Estimates And Forecasts To 2032 (USD Billion)
7.3 Cardano
7.3.1 Cardano Market Trends Analysis (2020-2032)
7.3.2 Cardano Deposition Market Size Estimates And Forecasts To 2032 (USD Billion)
7.4 BNB Chain
7.4.1 BNB Chain Market Trends Analysis (2020-2032)
7.4.2 BNB Chain Deposition Market Size Estimates And Forecasts To 2032 (USD Billion)
7.5 Polkadot
7.5.1 Polkadot Market Trends Analysis (2020-2032)
7.5.2 Polkadot Deposition Market Size Estimates And Forecasts To 2032 (USD Billion)
7.6 Others
7.6.1 Others Market Trends Analysis (2020-2032)
7.6.2 Others Market Size Estimates And Forecasts To 2032 (USD Billion)
8. Smart Contracts Market Segmentation, By Enterprise Size
8.1 Chapter Overview
8.2 Small & Medium Enterprises
8.2.1 Small & Medium Enterprises Market Trends Analysis (2020-2032)
8.2.2 Small & Medium Enterprises Market Size Estimates And Forecasts To 2032 (USD Billion)
8.3 Large Enterprises
8.3.1 Large Enterprises Market Trends Analysis (2020-2032)
8.3.2 Large Enterprises Market Size Estimates And Forecasts To 2032 (USD Billion)
9. Smart Contracts Market Segmentation, By Blockchain Type
9.1 Chapter Overview
9.2 Public
9.2.1 Public Market Trends Analysis (2020-2032)
9.2.2 Public Market Size Estimates And Forecasts To 2032 (USD Billion)
9.3 Private
9.3.1 Private Market Trends Analysis (2020-2032)
9.3.2 Private Market Size Estimates And Forecasts To 2032 (USD Billion)
9.4 Hybrid
9.4.1 Hybrid Market Trends Analysis (2020-2032)
9.4.2 Hybrid Market Size Estimates And Forecasts To 2032 (USD Billion)
10. Smart Contracts Market Segmentation, By Contract Type
10.1 Chapter Overview
10.2 Smart Legal Contracts
10.2.1 Smart Legal Contracts Market Trends Analysis (2020-2032)
10.2.2 Smart Legal Contracts Market Size Estimates And Forecasts To 2032 (USD Billion)
10.3 Decentralized Autonomous Organizations (DAOs)
10.3.1 Decentralized Autonomous Organizations (DAOs) Market Trends Analysis (2020-2032)
10.3.2 Decentralized Autonomous Organizations (DAOs) Market Size Estimates And Forecasts To 2032 (USD Billion)
10.4 Application Logic Contracts
10.4.1 Application Logic Contracts Market Trends Analysis (2020-2032)
10.4.2 Application Logic Contracts Market Size Estimates And Forecasts To 2032 (USD Billion)
11. Smart Contracts Market Segmentation, By End-use
11.1 Chapter Overview
11.2 BFSI
11.2.1 BFSI Market Trends Analysis (2020-2032)
11.2.2 BFSI Market Size Estimates And Forecasts To 2032 (USD Billion)
11.3 Retail
11.3.1 Retail Market Trends Analysis (2020-2032)
11.3.2 Retail Market Size Estimates And Forecasts To 2032 (USD Billion)
11.4 Healthcare
11.4.1 Healthcare Market Trends Analysis (2020-2032)
11.4.2 Healthcare Market Size Estimates And Forecasts To 2032 (USD Billion)
11.5 Real Estate
11.5.1 Real Estate Market Trends Analysis (2020-2032)
11.5.2 Real Estate Market Size Estimates And Forecasts To 2032 (USD Billion)
11.6 Logistics
11.6.1 Logistics Market Trends Analysis (2020-2032)
11.6.2 Logistics Market Size Estimates And Forecasts To 2032 (USD Billion)
11.7 Others
11.7.1 Others Market Trends Analysis (2020-2032)
11.7.2 Others Market Size Estimates And Forecasts To 2032 (USD Billion)
12. Regional Analysis
12.1 Chapter Overview
12.2 North America
12.2.1 Trends Analysis
12.2.2 North America Smart Contracts Market Estimates And Forecasts, By Country (2020-2032) (USD Billion)
12.2.3 North America Smart Contracts Market Estimates And Forecasts, By Platform (2020-2032) (USD Billion)
12.2.4 North America Smart Contracts Market Estimates And Forecasts, By Enterprise Size (2020-2032) (USD Billion)
12.2.5 North America Smart Contracts Market Estimates And Forecasts, By Blockchain Type (2020-2032) (USD Billion)
12.2.6 North America Smart Contracts Market Estimates And Forecasts, By Contract Type (2020-2032) (USD Billion)
12.2.7 North America Smart Contracts Market Estimates And Forecasts, By End-use (2020-2032) (USD Billion)
12.2.8 USA
12.2.8.1 USA Smart Contracts Market Estimates And Forecasts, By Platform (2020-2032) (USD Billion)
12.2.8.2 USA Smart Contracts Market Estimates And Forecasts, By Enterprise Size (2020-2032) (USD Billion)
12.2.8.3 USA Smart Contracts Market Estimates And Forecasts, By Blockchain Type (2020-2032) (USD Billion)
12.2.8.4 USA Smart Contracts Market Estimates And Forecasts, By Contract Type (2020-2032) (USD Billion)
12.2.8.5 USA Smart Contracts Market Estimates And Forecasts, By End-use (2020-2032) (USD Billion)
12.2.9 Canada
12.2.9.1 Canada Smart Contracts Market Estimates And Forecasts, By Platform (2020-2032) (USD Billion)
12.2.9.2 Canada Smart Contracts Market Estimates And Forecasts, By Enterprise Size (2020-2032) (USD Billion)
12.2.9.3 Canada Smart Contracts Market Estimates And Forecasts, By Blockchain Type (2020-2032) (USD Billion)
12.2.9.4 Canada Smart Contracts Market Estimates And Forecasts, By Contract Type (2020-2032) (USD Billion)
12.2.9.5 Canada Smart Contracts Market Estimates And Forecasts, By End-use (2020-2032) (USD Billion)
12.2.10 Mexico
12.2.10.1 Mexico Smart Contracts Market Estimates And Forecasts, By Platform (2020-2032) (USD Billion)
12.2.10.2 Mexico Smart Contracts Market Estimates And Forecasts, By Enterprise Size (2020-2032) (USD Billion)
12.2.10.3 Mexico Smart Contracts Market Estimates And Forecasts, By Blockchain Type (2020-2032) (USD Billion)
12.2.10.4 Mexico Smart Contracts Market Estimates And Forecasts, By Contract Type (2020-2032) (USD Billion)
12.2.10.5 Mexico Smart Contracts Market Estimates And Forecasts, By End-use (2020-2032) (USD Billion)
12.3 Europe
12.3.1 Eastern Europe
12.3.1.1 Trends Analysis
12.3.1.2 Eastern Europe Smart Contracts Market Estimates And Forecasts, By Country (2020-2032) (USD Billion)
12.3.1.3 Eastern Europe Smart Contracts Market Estimates And Forecasts, By Platform (2020-2032) (USD Billion)
12.3.1.4 Eastern Europe Smart Contracts Market Estimates And Forecasts, By Enterprise Size (2020-2032) (USD Billion)
12.3.1.5 Eastern Europe Smart Contracts Market Estimates And Forecasts, By Blockchain Type (2020-2032) (USD Billion)
12.3.1.6 Eastern Europe Smart Contracts Market Estimates And Forecasts, By Contract Type (2020-2032) (USD Billion)
12.3.1.7 Eastern Europe Smart Contracts Market Estimates And Forecasts, By End-use (2020-2032) (USD Billion)
12.3.1.8 Poland
12.3.1.8.1 Poland Smart Contracts Market Estimates And Forecasts, By Platform (2020-2032) (USD Billion)
12.3.1.8.2 Poland Smart Contracts Market Estimates And Forecasts, By Enterprise Size (2020-2032) (USD Billion)
12.3.1.8.3 Poland Smart Contracts Market Estimates And Forecasts, By Blockchain Type (2020-2032) (USD Billion)
12.3.1.8.4 Poland Smart Contracts Market Estimates And Forecasts, By Contract Type (2020-2032) (USD Billion)
12.3.1.8.5 Poland Smart Contracts Market Estimates And Forecasts, By End-use (2020-2032) (USD Billion)
12.3.1.9 Romania
12.3.1.9.1 Romania Smart Contracts Market Estimates And Forecasts, By Platform (2020-2032) (USD Billion)
12.3.1.9.2 Romania Smart Contracts Market Estimates And Forecasts, By Enterprise Size (2020-2032) (USD Billion)
12.3.1.9.3 Romania Smart Contracts Market Estimates And Forecasts, By Blockchain Type (2020-2032) (USD Billion)
12.3.1.9.4 Romania Smart Contracts Market Estimates And Forecasts, By Contract Type (2020-2032) (USD Billion)
12.3.1.9.5 Romania Smart Contracts Market Estimates And Forecasts, By End-use (2020-2032) (USD Billion)
12.3.1.10 Hungary
12.3.1.10.1 Hungary Smart Contracts Market Estimates And Forecasts, By Platform (2020-2032) (USD Billion)
12.3.1.10.2 Hungary Smart Contracts Market Estimates And Forecasts, By Enterprise Size (2020-2032) (USD Billion)
12.3.1.10.3 Hungary Smart Contracts Market Estimates And Forecasts, By Blockchain Type (2020-2032) (USD Billion)
12.3.1.10.4 Hungary Smart Contracts Market Estimates And Forecasts, By Contract Type (2020-2032) (USD Billion)
12.3.1.10.5 Hungary Smart Contracts Market Estimates And Forecasts, By End-use (2020-2032) (USD Billion)
12.3.1.11 Turkey
12.3.1.11.1 Turkey Smart Contracts Market Estimates And Forecasts, By Platform (2020-2032) (USD Billion)
12.3.1.11.2 Turkey Smart Contracts Market Estimates And Forecasts, By Enterprise Size (2020-2032) (USD Billion)
12.3.1.11.3 Turkey Smart Contracts Market Estimates And Forecasts, By Blockchain Type (2020-2032) (USD Billion)
12.3.1.11.4 Turkey Smart Contracts Market Estimates And Forecasts, By Contract Type (2020-2032) (USD Billion)
12.3.1.11.5 Turkey Smart Contracts Market Estimates And Forecasts, By End-use (2020-2032) (USD Billion)
12.3.1.12 Rest Of Eastern Europe
12.3.1.12.1 Rest Of Eastern Europe Smart Contracts Market Estimates And Forecasts, By Platform (2020-2032) (USD Billion)
12.3.1.12.2 Rest Of Eastern Europe Smart Contracts Market Estimates And Forecasts, By Enterprise Size (2020-2032) (USD Billion)
12.3.1.12.3 Rest Of Eastern Europe Smart Contracts Market Estimates And Forecasts, By Blockchain Type (2020-2032) (USD Billion)
12.3.1.12.4 Rest Of Eastern Europe Smart Contracts Market Estimates And Forecasts, By Contract Type (2020-2032) (USD Billion)
12.3.1.12.5 Rest Of Eastern Europe Smart Contracts Market Estimates And Forecasts, By End-use (2020-2032) (USD Billion)
12.3.2 Western Europe
12.3.2.1 Trends Analysis
12.3.2.2 Western Europe Smart Contracts Market Estimates And Forecasts, By Country (2020-2032) (USD Billion)
12.3.2.3 Western Europe Smart Contracts Market Estimates And Forecasts, By Platform (2020-2032) (USD Billion)
12.3.2.4 Western Europe Smart Contracts Market Estimates And Forecasts, By Enterprise Size (2020-2032) (USD Billion)
12.3.2.5 Western Europe Smart Contracts Market Estimates And Forecasts, By Blockchain Type (2020-2032) (USD Billion)
12.3.2.6 Western Europe Smart Contracts Market Estimates And Forecasts, By Contract Type (2020-2032) (USD Billion)
12.3.2.7 Western Europe Smart Contracts Market Estimates And Forecasts, By End-use (2020-2032) (USD Billion)
12.3.2.8 Germany
12.3.2.8.1 Germany Smart Contracts Market Estimates And Forecasts, By Platform (2020-2032) (USD Billion)
12.3.2.8.2 Germany Smart Contracts Market Estimates And Forecasts, By Enterprise Size (2020-2032) (USD Billion)
12.3.2.8.3 Germany Smart Contracts Market Estimates And Forecasts, By Blockchain Type (2020-2032) (USD Billion)
12.3.2.8.4 Germany Smart Contracts Market Estimates And Forecasts, By Contract Type (2020-2032) (USD Billion)
12.3.2.8.5 Germany Smart Contracts Market Estimates And Forecasts, By End-use (2020-2032) (USD Billion)
12.3.2.9 France
12.3.2.9.1 France Smart Contracts Market Estimates And Forecasts, By Platform (2020-2032) (USD Billion)
12.3.2.9.2 France Smart Contracts Market Estimates And Forecasts, By Enterprise Size (2020-2032) (USD Billion)
12.3.2.9.3 France Smart Contracts Market Estimates And Forecasts, By Blockchain Type (2020-2032) (USD Billion)
12.3.2.9.4 France Smart Contracts Market Estimates And Forecasts, By Contract Type (2020-2032) (USD Billion)
12.3.2.9.5 France Smart Contracts Market Estimates And Forecasts, By End-use (2020-2032) (USD Billion)
12.3.2.10 UK
12.3.2.10.1 UK Smart Contracts Market Estimates And Forecasts, By Platform (2020-2032) (USD Billion)
12.3.2.10.2 UK Smart Contracts Market Estimates And Forecasts, By Enterprise Size (2020-2032) (USD Billion)
12.3.2.10.3 UK Smart Contracts Market Estimates And Forecasts, By Blockchain Type (2020-2032) (USD Billion)
12.3.2.10.4 UK Smart Contracts Market Estimates And Forecasts, By Contract Type (2020-2032) (USD Billion)
12.3.2.10.5 UK Smart Contracts Market Estimates And Forecasts, By End-use (2020-2032) (USD Billion)
12.3.2.11 Italy
12.3.2.11.1 Italy Smart Contracts Market Estimates And Forecasts, By Platform (2020-2032) (USD Billion)
12.3.2.11.2 Italy Smart Contracts Market Estimates And Forecasts, By Enterprise Size (2020-2032) (USD Billion)
12.3.2.11.3 Italy Smart Contracts Market Estimates And Forecasts, By Blockchain Type (2020-2032) (USD Billion)
12.3.2.11.4 Italy Smart Contracts Market Estimates And Forecasts, By Contract Type (2020-2032) (USD Billion)
12.3.2.11.5 Italy Smart Contracts Market Estimates And Forecasts, By End-use (2020-2032) (USD Billion)
12.3.2.12 Spain
12.3.2.12.1 Spain Smart Contracts Market Estimates And Forecasts, By Platform (2020-2032) (USD Billion)
12.3.2.12.2 Spain Smart Contracts Market Estimates And Forecasts, By Enterprise Size (2020-2032) (USD Billion)
12.3.2.12.3 Spain Smart Contracts Market Estimates And Forecasts, By Blockchain Type (2020-2032) (USD Billion)
12.3.2.12.4 Spain Smart Contracts Market Estimates And Forecasts, By Contract Type (2020-2032) (USD Billion)
12.3.2.12.5 Spain Smart Contracts Market Estimates And Forecasts, By End-use (2020-2032) (USD Billion)
12.3.2.13 Netherlands
12.3.2.13.1 Netherlands Smart Contracts Market Estimates And Forecasts, By Platform (2020-2032) (USD Billion)
12.3.2.13.2 Netherlands Smart Contracts Market Estimates And Forecasts, By Enterprise Size (2020-2032) (USD Billion)
12.3.2.13.3 Netherlands Smart Contracts Market Estimates And Forecasts, By Blockchain Type (2020-2032) (USD Billion)
12.3.2.13.4 Netherlands Smart Contracts Market Estimates And Forecasts, By Contract Type (2020-2032) (USD Billion)
12.3.2.13.5 Netherlands Smart Contracts Market Estimates And Forecasts, By End-use (2020-2032) (USD Billion)
12.3.2.14 Switzerland
12.3.2.14.1 Switzerland Smart Contracts Market Estimates And Forecasts, By Platform (2020-2032) (USD Billion)
12.3.2.14.2 Switzerland Smart Contracts Market Estimates And Forecasts, By Enterprise Size (2020-2032) (USD Billion)
12.3.2.14.3 Switzerland Smart Contracts Market Estimates And Forecasts, By Blockchain Type (2020-2032) (USD Billion)
12.3.2.14.4 Switzerland Smart Contracts Market Estimates And Forecasts, By Contract Type (2020-2032) (USD Billion)
12.3.2.12.5 Switzerland Smart Contracts Market Estimates And Forecasts, By End-use (2020-2032) (USD Billion)
12.3.2.15 Austria
12.3.2.15.1 Austria Smart Contracts Market Estimates And Forecasts, By Platform (2020-2032) (USD Billion)
12.3.2.15.2 Austria Smart Contracts Market Estimates And Forecasts, By Enterprise Size (2020-2032) (USD Billion)
12.3.2.15.3 Austria Smart Contracts Market Estimates And Forecasts, By Blockchain Type (2020-2032) (USD Billion)
12.3.2.15.4 Austria Smart Contracts Market Estimates And Forecasts, By Contract Type (2020-2032) (USD Billion)
12.3.2.15.5 Austria Smart Contracts Market Estimates And Forecasts, By End-use (2020-2032) (USD Billion)
12.3.2.16 Rest Of Western Europe
12.3.2.16.1 Rest Of Western Europe Smart Contracts Market Estimates And Forecasts, By Platform (2020-2032) (USD Billion)
12.3.2.16.2 Rest Of Western Europe Smart Contracts Market Estimates And Forecasts, By Enterprise Size (2020-2032) (USD Billion)
12.3.2.16.3 Rest Of Western Europe Smart Contracts Market Estimates And Forecasts, By Blockchain Type (2020-2032) (USD Billion)
12.3.2.16.4 Rest Of Western Europe Smart Contracts Market Estimates And Forecasts, By Contract Type (2020-2032) (USD Billion)
12.3.2.16.5 Rest Of Western Europe Smart Contracts Market Estimates And Forecasts, By End-use (2020-2032) (USD Billion)
12.4 Asia Pacific
12.4.1 Trends Analysis
12.4.2 Asia Pacific Smart Contracts Market Estimates And Forecasts, By Country (2020-2032) (USD Billion)
12.4.3 Asia Pacific Smart Contracts Market Estimates And Forecasts, By Platform (2020-2032) (USD Billion)
12.4.4 Asia Pacific Smart Contracts Market Estimates And Forecasts, By Enterprise Size (2020-2032) (USD Billion)
12.4.5 Asia Pacific Smart Contracts Market Estimates And Forecasts, By Blockchain Type (2020-2032) (USD Billion)
12.4.6 Asia Pacific Smart Contracts Market Estimates And Forecasts, By Contract Type (2020-2032) (USD Billion)
12.4.7 Asia Pacific Smart Contracts Market Estimates And Forecasts, By End-use (2020-2032) (USD Billion)
12.4.8 China
12.4.8.1 China Smart Contracts Market Estimates And Forecasts, By Platform (2020-2032) (USD Billion)
12.4.8.2 China Smart Contracts Market Estimates And Forecasts, By Enterprise Size (2020-2032) (USD Billion)
12.4.8.3 China Smart Contracts Market Estimates And Forecasts, By Blockchain Type (2020-2032) (USD Billion)
12.4.8.4 China Smart Contracts Market Estimates And Forecasts, By Contract Type (2020-2032) (USD Billion)
12.4.8.5 China Smart Contracts Market Estimates And Forecasts, By End-use (2020-2032) (USD Billion)
12.4.9 India
12.4.9.1 India Smart Contracts Market Estimates And Forecasts, By Platform (2020-2032) (USD Billion)
12.4.9.2 India Smart Contracts Market Estimates And Forecasts, By Enterprise Size (2020-2032) (USD Billion)
12.4.9.3 India Smart Contracts Market Estimates And Forecasts, By Blockchain Type (2020-2032) (USD Billion)
12.4.9.4 India Smart Contracts Market Estimates And Forecasts, By Contract Type (2020-2032) (USD Billion)
12.4.9.5 India Smart Contracts Market Estimates And Forecasts, By End-use (2020-2032) (USD Billion)
12.4.10 Japan
12.4.10.1 Japan Smart Contracts Market Estimates And Forecasts, By Platform (2020-2032) (USD Billion)
12.4.10.2 Japan Smart Contracts Market Estimates And Forecasts, By Enterprise Size (2020-2032) (USD Billion)
12.4.10.3 Japan Smart Contracts Market Estimates And Forecasts, By Blockchain Type (2020-2032) (USD Billion)
12.4.10.4 Japan Smart Contracts Market Estimates And Forecasts, By Contract Type (2020-2032) (USD Billion)
12.4.10.5 Japan Smart Contracts Market Estimates And Forecasts, By End-use (2020-2032) (USD Billion)
12.4.11 South Korea
12.4.11.1 South Korea Smart Contracts Market Estimates And Forecasts, By Platform (2020-2032) (USD Billion)
12.4.11.2 South Korea Smart Contracts Market Estimates And Forecasts, By Enterprise Size (2020-2032) (USD Billion)
12.4.11.3 South Korea Smart Contracts Market Estimates And Forecasts, By Blockchain Type (2020-2032) (USD Billion)
12.4.11.4 South Korea Smart Contracts Market Estimates And Forecasts, By Contract Type (2020-2032) (USD Billion)
12.4.11.5 South Korea Smart Contracts Market Estimates And Forecasts, By End-use (2020-2032) (USD Billion)
12.4.12 Vietnam
12.4.12.1 Vietnam Smart Contracts Market Estimates And Forecasts, By Platform (2020-2032) (USD Billion)
12.4.12.2 Vietnam Smart Contracts Market Estimates And Forecasts, By Enterprise Size (2020-2032) (USD Billion)
12.4.12.3 Vietnam Smart Contracts Market Estimates And Forecasts, By Blockchain Type (2020-2032) (USD Billion)
12.4.12.4 Vietnam Smart Contracts Market Estimates And Forecasts, By Contract Type (2020-2032) (USD Billion)
12.4.12.5 Vietnam Smart Contracts Market Estimates And Forecasts, By End-use (2020-2032) (USD Billion)
12.4.13 Singapore
12.4.13.1 Singapore Smart Contracts Market Estimates And Forecasts, By Platform (2020-2032) (USD Billion)
12.4.13.2 Singapore Smart Contracts Market Estimates And Forecasts, By Enterprise Size (2020-2032) (USD Billion)
12.4.13.3 Singapore Smart Contracts Market Estimates And Forecasts, By Blockchain Type (2020-2032) (USD Billion)
12.4.13.4 Singapore Smart Contracts Market Estimates And Forecasts, By Contract Type (2020-2032) (USD Billion)
12.4.13.5 Singapore Smart Contracts Market Estimates And Forecasts, By End-use (2020-2032) (USD Billion)
12.4.14 Australia
12.4.14.1 Australia Smart Contracts Market Estimates And Forecasts, By Platform (2020-2032) (USD Billion)
12.4.14.2 Australia Smart Contracts Market Estimates And Forecasts, By Enterprise Size (2020-2032) (USD Billion)
12.4.14.3 Australia Smart Contracts Market Estimates And Forecasts, By Blockchain Type (2020-2032) (USD Billion)
12.4.14.4 Australia Smart Contracts Market Estimates And Forecasts, By Contract Type (2020-2032) (USD Billion)
12.4.14.5 Australia Smart Contracts Market Estimates And Forecasts, By End-use (2020-2032) (USD Billion)
12.4.15 Rest Of Asia Pacific
12.4.15.1 Rest Of Asia Pacific Smart Contracts Market Estimates And Forecasts, By Platform (2020-2032) (USD Billion)
12.4.15.2 Rest Of Asia Pacific Smart Contracts Market Estimates And Forecasts, By Enterprise Size (2020-2032) (USD Billion)
12.4.15.3 Rest Of Asia Pacific Smart Contracts Market Estimates And Forecasts, By Blockchain Type (2020-2032) (USD Billion)
12.4.15.4 Rest Of Asia Pacific Smart Contracts Market Estimates And Forecasts, By Contract Type (2020-2032) (USD Billion)
12.4.15.5 Rest Of Asia Pacific Smart Contracts Market Estimates And Forecasts, By End-use (2020-2032) (USD Billion)
12.5 Middle East And Africa
12.5.1 Middle East
12.5.1.1 Trends Analysis
12.5.1.2 Middle East Smart Contracts Market Estimates And Forecasts, By Country (2020-2032) (USD Billion)
12.5.1.3 Middle East Smart Contracts Market Estimates And Forecasts, By Platform (2020-2032) (USD Billion)
12.5.1.4 Middle East Smart Contracts Market Estimates And Forecasts, By Enterprise Size (2020-2032) (USD Billion)
12.5.1.5 Middle East Smart Contracts Market Estimates And Forecasts, By Blockchain Type (2020-2032) (USD Billion)
12.5.1.6 Middle East Smart Contracts Market Estimates And Forecasts, By Contract Type (2020-2032) (USD Billion)
12.5.1.7 Middle East Smart Contracts Market Estimates And Forecasts, By End-use (2020-2032) (USD Billion)
12.5.1.8 UAE
12.5.1.8.1 UAE Smart Contracts Market Estimates And Forecasts, By Platform (2020-2032) (USD Billion)
12.5.1.8.2 UAE Smart Contracts Market Estimates And Forecasts, By Enterprise Size (2020-2032) (USD Billion)
12.5.1.8.3 UAE Smart Contracts Market Estimates And Forecasts, By Blockchain Type (2020-2032) (USD Billion)
12.5.1.8.4 UAE Smart Contracts Market Estimates And Forecasts, By Contract Type (2020-2032) (USD Billion)
12.5.1.8.5 UAE Smart Contracts Market Estimates And Forecasts, By End-use (2020-2032) (USD Billion)
12.5.1.9 Egypt
12.5.1.9.1 Egypt Smart Contracts Market Estimates And Forecasts, By Platform (2020-2032) (USD Billion)
12.5.1.9.2 Egypt Smart Contracts Market Estimates And Forecasts, By Enterprise Size (2020-2032) (USD Billion)
12.5.1.9.3 Egypt Smart Contracts Market Estimates And Forecasts, By Blockchain Type (2020-2032) (USD Billion)
12.5.1.9.4 Egypt Smart Contracts Market Estimates And Forecasts, By Contract Type (2020-2032) (USD Billion)
12.5.1.9.5 Egypt Smart Contracts Market Estimates And Forecasts, By End-use (2020-2032) (USD Billion)
12.5.1.10 Saudi Arabia
12.5.1.10.1 Saudi Arabia Smart Contracts Market Estimates And Forecasts, By Platform (2020-2032) (USD Billion)
12.5.1.10.2 Saudi Arabia Smart Contracts Market Estimates And Forecasts, By Enterprise Size (2020-2032) (USD Billion)
12.5.1.10.3 Saudi Arabia Smart Contracts Market Estimates And Forecasts, By Blockchain Type (2020-2032) (USD Billion)
12.5.1.10.4 Saudi Arabia Smart Contracts Market Estimates And Forecasts, By Contract Type (2020-2032) (USD Billion)
12.5.1.10.5 Saudi Arabia Smart Contracts Market Estimates And Forecasts, By End-use (2020-2032) (USD Billion)
12.5.1.11 Qatar
12.5.1.11.1 Qatar Smart Contracts Market Estimates And Forecasts, By Platform (2020-2032) (USD Billion)
12.5.1.11.2 Qatar Smart Contracts Market Estimates And Forecasts, By Enterprise Size (2020-2032) (USD Billion)
12.5.1.11.3 Qatar Smart Contracts Market Estimates And Forecasts, By Blockchain Type (2020-2032) (USD Billion)
12.5.1.11.4 Qatar Smart Contracts Market Estimates And Forecasts, By Contract Type (2020-2032) (USD Billion)
12.5.1.11.5 Qatar Smart Contracts Market Estimates And Forecasts, By End-use (2020-2032) (USD Billion)
12.5.1.12 Rest Of Middle East
12.5.1.12.1 Rest Of Middle East Smart Contracts Market Estimates And Forecasts, By Platform (2020-2032) (USD Billion)
12.5.1.12.2 Rest Of Middle East Smart Contracts Market Estimates And Forecasts, By Enterprise Size (2020-2032) (USD Billion)
12.5.1.12.3 Rest Of Middle East Smart Contracts Market Estimates And Forecasts, By Blockchain Type (2020-2032) (USD Billion)
12.5.1.12.4 Rest Of Middle East Smart Contracts Market Estimates And Forecasts, By Contract Type (2020-2032) (USD Billion)
12.5.1.12.5 Rest Of Middle East Smart Contracts Market Estimates And Forecasts, By End-use (2020-2032) (USD Billion)
12.5.2 Africa
12.5.2.1 Trends Analysis
12.5.2.2 Africa Smart Contracts Market Estimates And Forecasts, By Country (2020-2032) (USD Billion)
12.5.2.3 Africa Smart Contracts Market Estimates And Forecasts, By Platform (2020-2032) (USD Billion)
12.5.2.4 Africa Smart Contracts Market Estimates And Forecasts, By Enterprise Size (2020-2032) (USD Billion)
12.5.2.5 Africa Smart Contracts Market Estimates And Forecasts, By Blockchain Type (2020-2032) (USD Billion)
12.5.2.6 Africa Smart Contracts Market Estimates And Forecasts, By Contract Type (2020-2032) (USD Billion)
12.5.2.7 Africa Smart Contracts Market Estimates And Forecasts, By End-use (2020-2032) (USD Billion)
12.5.2.8 South Africa
12.5.2.8.1 South Africa Smart Contracts Market Estimates And Forecasts, By Platform (2020-2032) (USD Billion)
12.5.2.8.2 South Africa Smart Contracts Market Estimates And Forecasts, By Enterprise Size (2020-2032) (USD Billion)
12.5.2.8.3 South Africa Smart Contracts Market Estimates And Forecasts, By Blockchain Type (2020-2032) (USD Billion)
12.5.2.8.4 South Africa Smart Contracts Market Estimates And Forecasts, By Contract Type (2020-2032) (USD Billion)
12.5.2.8.5 South Africa Smart Contracts Market Estimates And Forecasts, By End-use (2020-2032) (USD Billion)
12.5.2.9 Nigeria
12.5.2.9.1 Nigeria Smart Contracts Market Estimates And Forecasts, By Platform (2020-2032) (USD Billion)
12.5.2.9.2 Nigeria Smart Contracts Market Estimates And Forecasts, By Enterprise Size (2020-2032) (USD Billion)
12.5.2.9.3 Nigeria Smart Contracts Market Estimates And Forecasts, By Blockchain Type (2020-2032) (USD Billion)
12.5.2.9.4 Nigeria Smart Contracts Market Estimates And Forecasts, By Contract Type (2020-2032) (USD Billion)
12.5.2.9.5 Nigeria Smart Contracts Market Estimates And Forecasts, By End-use (2020-2032) (USD Billion)
12.5.2.10 Rest Of Africa
12.5.2.10.1 Rest Of Africa Smart Contracts Market Estimates And Forecasts, By Platform (2020-2032) (USD Billion)
12.5.2.10.2 Rest Of Africa Smart Contracts Market Estimates And Forecasts, By Enterprise Size (2020-2032) (USD Billion)
12.5.2.10.3 Rest Of Africa Smart Contracts Market Estimates And Forecasts, By Blockchain Type (2020-2032) (USD Billion)
12.5.2.10.4 Rest Of Africa Smart Contracts Market Estimates And Forecasts, By Contract Type (2020-2032) (USD Billion)
12.5.2.10.5 Rest Of Africa Smart Contracts Market Estimates And Forecasts, By End-use (2020-2032) (USD Billion)
12.6 Latin America
12.6.1 Trends Analysis
12.6.2 Latin America Smart Contracts Market Estimates And Forecasts, By Country (2020-2032) (USD Billion)
12.6.3 Latin America Smart Contracts Market Estimates And Forecasts, By Platform (2020-2032) (USD Billion)
12.6.4 Latin America Smart Contracts Market Estimates And Forecasts, By Enterprise Size (2020-2032) (USD Billion)
12.6.5 Latin America Smart Contracts Market Estimates And Forecasts, By Blockchain Type (2020-2032) (USD Billion)
12.6.6 Latin America Smart Contracts Market Estimates And Forecasts, By Contract Type (2020-2032) (USD Billion)
12.6.7 Latin America Smart Contracts Market Estimates And Forecasts, By End-use (2020-2032) (USD Billion)
12.6.8 Brazil
12.6.8.1 Brazil Smart Contracts Market Estimates And Forecasts, By Platform (2020-2032) (USD Billion)
12.6.8.2 Brazil Smart Contracts Market Estimates And Forecasts, By Enterprise Size (2020-2032) (USD Billion)
12.6.8.3 Brazil Smart Contracts Market Estimates And Forecasts, By Blockchain Type (2020-2032) (USD Billion)
12.6.8.4 Brazil Smart Contracts Market Estimates And Forecasts, By Contract Type (2020-2032) (USD Billion)
12.6.8.5 Brazil Smart Contracts Market Estimates And Forecasts, By End-use (2020-2032) (USD Billion)
12.6.9 Argentina
12.6.9.1 Argentina Smart Contracts Market Estimates And Forecasts, By Platform (2020-2032) (USD Billion)
12.6.9.2 Argentina Smart Contracts Market Estimates And Forecasts, By Enterprise Size (2020-2032) (USD Billion)
12.6.9.3 Argentina Smart Contracts Market Estimates And Forecasts, By Blockchain Type (2020-2032) (USD Billion)
12.6.9.4 Argentina Smart Contracts Market Estimates And Forecasts, By Contract Type (2020-2032) (USD Billion)
12.6.9.5 Argentina Smart Contracts Market Estimates And Forecasts, By End-use (2020-2032) (USD Billion)
12.6.10 Colombia
12.6.10.1 Colombia Smart Contracts Market Estimates And Forecasts, By Platform (2020-2032) (USD Billion)
12.6.10.2 Colombia Smart Contracts Market Estimates And Forecasts, By Enterprise Size (2020-2032) (USD Billion)
12.6.10.3 Colombia Smart Contracts Market Estimates And Forecasts, By Blockchain Type (2020-2032) (USD Billion)
12.6.10.4 Colombia Smart Contracts Market Estimates And Forecasts, By Contract Type (2020-2032) (USD Billion)
12.6.10.5 Colombia Smart Contracts Market Estimates And Forecasts, By End-use (2020-2032) (USD Billion)
12.6.11 Rest Of Latin America
12.6.11.1 Rest Of Latin America Smart Contracts Market Estimates And Forecasts, By Platform (2020-2032) (USD Billion)
12.6.11.2 Rest Of Latin America Smart Contracts Market Estimates And Forecasts, By Enterprise Size (2020-2032) (USD Billion)
12.6.11.3 Rest Of Latin America Smart Contracts Market Estimates And Forecasts, By Blockchain Type (2020-2032) (USD Billion)
12.6.11.4 Rest Of Latin America Smart Contracts Market Estimates And Forecasts, By Contract Type (2020-2032) (USD Billion)
12.6.11.5 Rest Of Latin America Smart Contracts Market Estimates And Forecasts, By End-use (2020-2032) (USD Billion)
13. Company Profiles
13.1 IBM
13.1.1 Company Overview
13.1.2 Financial
13.1.3 Products/ Services Offered
13.1.4 SWOT Analysis
13.2 Microsoft
13.2.1 Company Overview
13.2.2 Financial
13.2.3 Products/ Services Offered
13.2.4 SWOT Analysis
13.3 Amazon Web Services
13.3.1 Company Overview
13.3.2 Financial
13.3.3 Products/ Services Offered
13.3.4 SWOT Analysis
13.4 Oracle
13.4.1 Company Overview
13.4.2 Financial
13.4.3 Products/ Services Offered
13.4.4 SWOT Analysis
13.5 Accenture
13.5.1 Company Overview
13.5.2 Financial
13.5.3 Products/ Services Offered
13.5.4 SWOT Analysis
13.6 SAP
13.6.1 Company Overview
13.6.2 Financial
13.6.3 Products/ Services Offered
13.6.4 SWOT Analysis
13.7 R3
13.7.1 Company Overview
13.7.2 Financial
13.7.3 Products/ Services Offered
13.7.4 SWOT Analysis
13.8 Ethereum Foundation
13.8.1 Company Overview
13.8.2 Financial
13.8.3 Products/ Services Offered
13.8.4 SWOT Analysis
13.9 Blockchain Foundry
13.9.1 Company Overview
13.9.2 Financial
13.9.3 Products/ Services Offered
13.9.4 SWOT Analysis
13.10 Hyperledger.
13.12.1 Company Overview
13.12.2 Financial
13.12.3 Products/ Services Offered
13.12.4 SWOT Analysis
14. Use Cases and Best Practices
15. Conclusion
An accurate research report requires proper strategizing as well as implementation. There are multiple factors involved in the completion of good and accurate research report and selecting the best methodology to compete the research is the toughest part. Since the research reports we provide play a crucial role in any company’s decision-making process, therefore we at SNS Insider always believe that we should choose the best method which gives us results closer to reality. This allows us to reach at a stage wherein we can provide our clients best and accurate investment to output ratio.
Each report that we prepare takes a timeframe of 350-400 business hours for production. Starting from the selection of titles through a couple of in-depth brain storming session to the final QC process before uploading our titles on our website we dedicate around 350 working hours. The titles are selected based on their current market cap and the foreseen CAGR and growth.
The 5 steps process:
Step 1: Secondary Research:
Secondary Research or Desk Research is as the name suggests is a research process wherein, we collect data through the readily available information. In this process we use various paid and unpaid databases which our team has access to and gather data through the same. This includes examining of listed companies’ annual reports, Journals, SEC filling etc. Apart from this our team has access to various associations across the globe across different industries. Lastly, we have exchange relationships with various university as well as individual libraries.
Step 2: Primary Research
When we talk about primary research, it is a type of study in which the researchers collect relevant data samples directly, rather than relying on previously collected data. This type of research is focused on gaining content specific facts that can be sued to solve specific problems. Since the collected data is fresh and first hand therefore it makes the study more accurate and genuine.
We at SNS Insider have divided Primary Research into 2 parts.
Part 1 wherein we interview the KOLs of major players as well as the upcoming ones across various geographic regions. This allows us to have their view over the market scenario and acts as an important tool to come closer to the accurate market numbers. As many as 45 paid and unpaid primary interviews are taken from both the demand and supply side of the industry to make sure we land at an accurate judgement and analysis of the market.
This step involves the triangulation of data wherein our team analyses the interview transcripts, online survey responses and observation of on filed participants. The below mentioned chart should give a better understanding of the part 1 of the primary interview.
Part 2: In this part of primary research the data collected via secondary research and the part 1 of the primary research is validated with the interviews from individual consultants and subject matter experts.
Consultants are those set of people who have at least 12 years of experience and expertise within the industry whereas Subject Matter Experts are those with at least 15 years of experience behind their back within the same space. The data with the help of two main processes i.e., FGDs (Focused Group Discussions) and IDs (Individual Discussions). This gives us a 3rd party nonbiased primary view of the market scenario making it a more dependable one while collation of the data pointers.
Step 3: Data Bank Validation
Once all the information is collected via primary and secondary sources, we run that information for data validation. At our intelligence centre our research heads track a lot of information related to the market which includes the quarterly reports, the daily stock prices, and other relevant information. Our data bank server gets updated every fortnight and that is how the information which we collected using our primary and secondary information is revalidated in real time.
Step 4: QA/QC Process
After all the data collection and validation our team does a final level of quality check and quality assurance to get rid of any unwanted or undesired mistakes. This might include but not limited to getting rid of the any typos, duplication of numbers or missing of any important information. The people involved in this process include technical content writers, research heads and graphics people. Once this process is completed the title gets uploader on our platform for our clients to read it.
Step 5: Final QC/QA Process:
This is the last process and comes when the client has ordered the study. In this process a final QA/QC is done before the study is emailed to the client. Since we believe in giving our clients a good experience of our research studies, therefore, to make sure that we do not lack at our end in any way humanly possible we do a final round of quality check and then dispatch the study to the client.
Key Segments:
By Platform
Ethereum
Cardano
BNB Chain
Polkadot
Others
By Enterprise Size
Small & Medium Enterprises
Large Enterprises
By Blockchain Type
Public
Private
Hybrid
By Contract Type
Smart Legal Contracts
Decentralized Autonomous Organizations (DAOs)
Application Logic Contracts
By End-Use
BFSI
Retail
Healthcare
Real Estate
Logistics
Others
Request for Segment Customization as per your Business Requirement: Segment Customization Request
REGIONAL COVERAGE:
North America
US
Canada
Mexico
Europe
Eastern Europe
Poland
Romania
Hungary
Turkey
Rest of Eastern Europe
Western Europe
Germany
France
UK
Italy
Spain
Netherlands
Switzerland
Austria
Rest of Western Europe
Asia Pacific
China
India
Japan
South Korea
Vietnam
Singapore
Australia
Rest of Asia Pacific
Middle East & Africa
Middle East
UAE
Egypt
Saudi Arabia
Qatar
Rest of the Middle East
Africa
Nigeria
South Africa
Rest of Africa
Latin America
Brazil
Argentina
Colombia
Rest of Latin America
Request for Country Level Research Report: Country Level Customization Request
Available Customization
With the given market data, SNS Insider offers customization as per the company’s specific needs. The following customization options are available for the report:
Product Analysis
Criss-Cross segment analysis (e.g. Product X Application)
Product Matrix which gives a detailed comparison of product portfolio of each company
Geographic Analysis
Additional countries in any of the regions
Company Information
Detailed analysis and profiling of additional market players (Up to five)
Customer Intelligence Platform Market was valued at USD 2.5 billion and is expected to reach USD 22.1 billion by 2032, growing at a CAGR of 27.4% over 2024-2032
Team Collaboration Software Market was valued at USD 25.9 billion in 2023 and is expected to reach USD 62.4 billion by 2032, at a CAGR of 10.3% over 2024-2032.
The Embedded Hypervisor Market Size was USD 12.02 Billion in 2023 and will reach to USD 23.63 Billion by 2032 and grow at a CAGR of 7.80% by 2024-2032.
The Property Management Market size was valued at USD 23.52 billion in 2023 and is expected to grow to USD 49.61 billion by 2032 and grow at a CAGR of 8.70% over the forecast period of 2024-2032.
The Voice Biometrics Market Size was $1.8 billion in 2023 and is expected to reach USD 10.85 billion by 2032 and grow at a CAGR of 22.1% by 2024-2032.
The Eye Tracking Market size was USD 1.01 Billion in 2023 and is expected to Reach USD 11.4 Billion by 2032 and grow at a CAGR of 30.6% by 2032.
Hi! Click one of our member below to chat on Phone