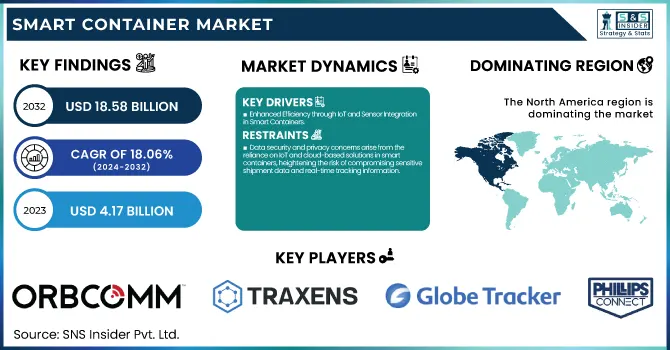
The Smart Container Market size was valued at USD 4.17 Billion in 2023 and expected to reach USD 18.58 Billion by 2032, growing at a CAGR of 18.06% during 2024-2032. The major market drivers of this market include growing demand of real-time monitoring and visibility in supply chains, increasing adoption of IoT and sensor technologies, and growing need of cost-efficient and effective logistics solutions.
To Get more information on Smart Container Market - Request Free Sample Report
The market is also being driven by the growth of temperature-sensitive transportation, especially the pharmaceutical and food sectors, as well as the use of smart containers in e-commerce. Businesses are looking to increase operational efficiencies, and the incorporation of sensors and tracking systems have led to shifts in consumer behavior toward the demand for transparency, which is increasing adoption rates. Sensor accuracy and reliability are helping regain trust and confidence in the supply chain.
Drivers:
Enhanced Efficiency through IoT and Sensor Integration in Smart Containers
The integration of IoT (Internet of Things) and sensor technologies is a key driver in the growth of the smart container market. With integrated sensors and IoT connectivity, containers now monitor critical parameters such as temperature, humidity, location, and safety in real-time. OI and machine learning also make for more efficient and precise monitoring, enabling real-time shipment and container tracking as well as notifications when spoilage, theft or loss occurs. This enables ongoing data collection via sensors, which are exchanged across IoT-enabled platforms for a holistic view of the cargo's condition. Not only does this drive operational effectiveness with timely deliveries, but it also encourages proactive management by alerting all relevant stakeholders of any areas of concern before they spiral out of control. Moreover, integrating the IoT and devices allows companies to enhance supply chains, lower expenses and comply with laws, especially when dealing with temperature-sensitive commodities such as medicines and perishables. Furthermore, the integration of IoT and sensors helps businesses optimize their supply chains, reduce costs, and meet regulatory requirements, particularly for temperature-sensitive goods like pharmaceuticals and perishable items.
Restraints:
Data security and privacy concerns arise from the reliance on IoT and cloud-based solutions in smart containers, heightening the risk of compromising sensitive shipment data and real-time tracking information.
Data security and privacy concerns are significant challenges for the smart container market. As the industry increasingly relies on IoT and cloud-based solutions, the real-time tracking and sensitive shipment information collected by smart containers become vulnerable to potential breaches or unauthorized access. These concerns are heightened by the transmission of data across multiple networks and devices, which can expose the data to cyberattacks. Additionally, companies must comply with varying regulations concerning data storage and privacy, which can add complexity to implementing secure systems. Ensuring the protection of this data requires robust encryption, advanced cybersecurity measures, and adherence to global data protection standards. As the market continues to grow, these security risks need to be addressed to ensure trust and widespread adoption of smart container technologies.
Opportunities:
Leveraging IoT and AI for Enhanced Smart Container Efficiency
Smart containers are embedded with advanced IoT and AI technologies that allow real-time tracking, predictive analytics, and condition monitoring, leading to the optimization of logistics operations, enhanced supply chain visibility, and improved efficiencies for businesses. Utilizing IoT sensors and AI algorithms allows companies to manage inventory preemptively, prevent delays, and track conditions (temperature, humidity, location, etc.), enabling them to improve decision-making and save money. By facilitating smarter and more responsive supply chains, this technological breakthrough is enhancing the operational performance of businesses across sectors.
Challenges:
Managing Maintenance Costs and Operational Challenges in Smart Containers
Smart containers, while offering enhanced efficiency and real-time tracking, come with their own set of challenges related to maintenance and operational costs. These containers are heavily dependent on IoT, sensors, and advanced tech that allows for the real-time collection of data and monitoring, which requires continuous maintenance and periodic upgrades to ensure they work properly. Faulty Hardware: Due to wear and tear, the sensors, communication systems, and hardware components may result in repair or replacement cost over-time. Software updates to add new functions, or add security might also require special resources to be done, incurring additional costs. The operation becomes even more complex due to the need for constant monitoring, troubleshooting, and ensuring that all the connected systems work well together. If not properly managed, these factors can disrupt operations, causing delays or inefficiencies, ultimately increasing the total cost of ownership. Therefore, businesses need to factor in these maintenance requirements and costs when adopting smart container technologies.
By Offering
In 2023, the hardware segment held the largest revenue share in the smart container market, accounting for around 69%. This substantial market share is primarily driven by the increasing demand for advanced hardware components like sensors, RFID tags, GPS systems, and temperature control units, which are essential for enabling real-time tracking, condition monitoring, and improved visibility across supply chains. With industries embarking on journeys towards logistics optimization and asset safety during transit, the demand for hardware solutions has inherently matured in becoming more reliable and durable. In addition, IoT and AI technologies can help to collect and analyze data from these hardware components, leading to better operational efficiency and decision-making. The increasing adoption of smart containers in various sectors, including logistics, pharmaceuticals, and food delivery, is also driving the growth of this hardware segment.
The software segment is expected to be the fastest-growing in the smart container market during the forecast period 2024-2032. This growth has been attributed to the rising need for sophisticated data analytics, real-time monitoring, and IoT integration in container management. Software solutions allow better monitoring, route optimization, and visibility in the supply chain — in short, a huge competitive advantage. The Logistics and transportation sector is looking for more relevant, derived solutions that can be automated, the adoption of smart container software (predictive maintenance and condition monitoring) is growing. These developments enable for increased operational efficiency, lower costs, and improved customer satisfaction, driving the segment’s growth in the upcoming years.
By Technology
In 2023, the GPS segment dominated the largest share of revenue in the smart container market, accounting for approximately 78%. Due to the importance of GPS technology to provide the most accurate and real-time monitoring related to the location of a container throughout the logistics and supply chain process. GPS for systems allow organisations to track their containers at all times, making routing easier, reducing the likelihood of theft or loss and enabling operational visibility. The combination of space with this, GPS integrated with IoT enabled smart containers, keep track of the exact location, speed, and route of the containers while in transit, so that companies can optimize delivery time, improve asset utilization, and better avoid/manage delays or disruptions. Therefore, the factors include the accuracy, cost-effectiveness, and real-time ability of GPS technology are the key reasons fueling the major share of the market in 2023. The growth of GPS vehicle tracking solutions is expected to continue as logistics and supply chain industries get more operational efficiencies.
The LoRa WAN segment is the fastest-growing in the smart container market from 2024 to 2032, due to the importance of GPS technology to provide the most accurate and real-time monitoring related to the location of a container throughout the logistics and supply chain process. GPS for ContainerisationGPS systems allow organisations to track their containers at all times, making routing easier, reducing the likelihood of theft or loss and enabling operational visibility. The combination of space with this, GPS integrated with IoT enabled smart containers, keep track of the exact location, speed, and route of the containers while in transit, so that companies can optimize delivery time, improve asset utilization, and better avoid/manage delays or disruptions. Therefore, the factors include the accuracy, cost-effectiveness, and real-time ability of GPS technology are the key reasons fueling the major share of the market in 2023. The growth of GPS vehicle tracking solutions is expected to continue as logistics and supply chain industries get more operational efficiencies.
By Application
The Asset Tracking & Management segment dominated the smart container market with around 68% of the revenue share in 2023. The growing demand for real-time visibility and control over in-transit assets has contributed to the large market share of this segment. Smart containers, integrated with technologies like GPS, RFID, and IoT sensors enable companies to track the condition, location, and status of their containers at every point in the supply chain. We can increase the operational efficiency and minimize losses while ensuring the goods in transit stay secure through the tracking of assets in real-time. Moreover, with the booming logistics and e-commerce sectors, the need for real-time asset tracking solutions to ensure on-time deliveries, lower operational expenditure, and gain insights on the use of assets is predicted to add to the segment’s persistent dominance in the smart container market.
The Supply Chain Optimization segment is the fastest-growing in the smart container market over the forecast period from 2024 to 2032. This change is due to the progressively increasing demand for more efficient, transparent, and automated supply chain processes. Data from smart containers integrated with IoT sensors, GPS, and live tracking systems yield insights that help businesses streamline logistics and inventory management. Improving visibility throughout the supply chain helps streamline operations, reduce delays, minimize errors, and positively impact overall delivery performance. Additionally, AI and predictive analytics enable improved demand forecasting, inventory control, and route optimization that lead to cost savings and increased operational efficiency.
By End Use
The Food and Beverages segment dominated the largest share of the smart container market, accounting for around 54% of the revenue in 2023. This dominance is driven by the increasing need for temperature-controlled and time-sensitive shipments in the food and beverage industry. Smart containers equipped with IoT sensors ensure real-time monitoring of temperature, humidity, and other conditions, ensuring that perishable goods are stored and transported under optimal conditions. The technology helps to minimize waste, improve product quality, and enhance supply chain efficiency. Additionally, the rise in e-commerce and consumer demand for fresh, quality food products has pushed companies to adopt smarter, more reliable logistics solutions. As the need for secure, efficient, and traceable food transport continues to rise, this segment is expected to maintain its leading position in the smart container market.
The Pharmaceuticals segment is the fastest-growing in the smart container market from 2024 to 2032. This growth is driven by the increasing demand for secure, temperature-sensitive shipments, particularly vaccines, biologics, and other temperature-sensitive medications. IoT and sensor equipment inside smart containers can monitor the environmental conditions, optimizing them according to regulatory frameworks such as Good Distribution Practices (GDP) in real time and preventing spoilage. For sensitive drugs, the need for improved quality and reliability in shipping is driving the use of advanced smart containers, increasing efficiency and minimizing the chances of product spoilage or damage during an expedition.
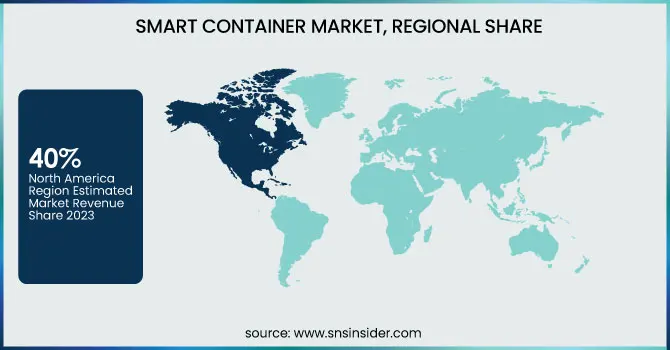
The North America region dominated the largest share of the smart container market, accounting for around 40% of the revenue in 2023. This is primarily due to the presence of dominant players in this region along with almost sophisticated infrastructure related to logistics & supply chain management. Over the years, significant adoption of IoT, AI, and sensor technologies this has also accelerated the demand for smart containers in North America, especially for the pharmaceuticals, food & beverages, and manufacturing industries. The growing e-commerce in the region and the growing requirement for real-time tracking and improved security of the shipments are also expected to add to the growth of the market. Developmental strides in regulations and North America having a strong focus on supply chain optimization further propel the adoption of smart containers in the region, maintaining their dominance in the global market.
The Asia-Pacific region is expected to be the fastest-growing market for smart containers over the forecast period from 2024 to 2032. Growing demand for real-time tracking and supply chain optimisation implicated by the fast-growing region-wide e-commerce and manufacturing sectors is driving the growth of the smart container market. Examples are China, India, Japan, and South Korea, which are seeing significant advances in logistics infrastructure and technology adoption. The region is investing in IoT, AI, and sensor technologies to drive operational efficiency in its supply chains across diverse industries including food and beverages, pharmaceuticals, and automotive. Moreover, there is an increasing focus on cold chain logistics for temperature-sensitive goods, which is also boosting the demand for smart containers.
Get Customized Report as per Your Business Requirement - Enquiry Now
Some of the major Key Players in Smart Container Market along with their product:
ORBCOMM (USA) – IoT-based solutions for asset tracking, including smart containers, telematics, and real-time monitoring systems.
Traxens (France) – Smart container tracking solutions, providing real-time data for temperature, humidity, and location monitoring.
Globe Tracker ApS (Denmark) – IoT-based solutions for container and cargo tracking, providing real-time information and analytics.
Phillips Connect Technologies (USA) – Telematics solutions for fleet and container management, including monitoring of container conditions.
Emerson Electric Co. (USA) – Smart container technologies for temperature, humidity, and pressure monitoring, as well as wireless sensors.
Hapag-Lloyd AG (Germany) – Container shipping and logistics services, offering remote container monitoring and tracking solutions.
Seaco (UK) – Shipping container solutions, including temperature-controlled smart containers and IoT tracking technology.
Savvy Telematics (USA) – Telematics and asset tracking solutions, providing real-time monitoring of containers and trailers.
Sensitech Inc. (USA) – Supply chain visibility solutions, specializing in temperature-controlled container monitoring and asset tracking.
Robert Bosch GmbH (Germany) – Smart container solutions for real-time tracking, temperature monitoring, and condition monitoring using IoT and sensor technology.
A.P. Moller - Maersk (Denmark) – Global shipping and logistics services, offering IoT-enabled container tracking and remote monitoring.
Roambee Corporation (USA) – Real-time asset tracking, including temperature, humidity, and location monitoring for containers.
Nexxiot (Switzerland) – IoT-based solutions for container tracking and monitoring, including real-time data on location, temperature, and conditions.
List of Suppliers who Provide Raw Material and component in Smart Container Market:
3M (USA)
Honeywell International, Inc. (USA)
Sensirion AG (Switzerland)
STMicroelectronics (Switzerland)
NXP Semiconductors (Netherlands)
Bosch Sensortec (Germany)
Texas Instruments (USA)
Analog Devices (USA)
Murata Manufacturing Co., Ltd. (Japan)
Infineon Technologies (Germany)
Verizon Communications (USA)
Qualcomm (USA)
Kyocera Corporation (Japan)
Broadcom Inc. (USA)
On July 1, 2024, ORBCOMM launched its latest reefer container monitoring device, the CT 3600, The device offers faster installation, improved performance, and seamless compatibility with refrigerated containers from all major OEMs, featuring a durable rechargeable battery and wireless Bluetooth sensor support.
On October 2, 2024, Philips Avent launched its Premium Connected Baby featuring SenseIQ sleep and breathing tracking, and Cry Detection and Translation technology, offering AI-driven insights into baby’s wellbeing. The monitor provides reassurance through camera connections, whether via the Parent Unit or the Baby Monitor+ app.
| Report Attributes | Details |
|---|---|
| Market Size in 2023 | USD 4.17 Billion |
| Market Size by 2032 | USD 18.58 Billion |
| CAGR | CAGR of 18.06% From 2024 to 2032 |
| Base Year | 2023 |
| Forecast Period | 2024-2032 |
| Historical Data | 2020-2022 |
| Report Scope & Coverage | Market Size, Segments Analysis, Competitive Landscape, Regional Analysis, DROC & SWOT Analysis, Forecast Outlook |
| Key Segments | • By Offering (Hardware, Software, Services) • By Technology (GPS, LoRa WAN) • By Application (Asset Tracking & Management, Supply Chain Optimization, Safety and Security, Others) • By End Use(Food and Beverages, Pharmaceuticals, Oil and Gas, Chemicals, Others) |
| Regional Analysis/Coverage | North America (US, Canada, Mexico), Europe (Eastern Europe [Poland, Romania, Hungary, Turkey, Rest of Eastern Europe] Western Europe] Germany, France, UK, Italy, Spain, Netherlands, Switzerland, Austria, Rest of Western Europe]), Asia Pacific (China, India, Japan, South Korea, Vietnam, Singapore, Australia, Rest of Asia Pacific), Middle East & Africa (Middle East [UAE, Egypt, Saudi Arabia, Qatar, Rest of Middle East], Africa [Nigeria, South Africa, Rest of Africa], Latin America (Brazil, Argentina, Colombia, Rest of Latin America) |
| Company Profiles | ORBCOMM (USA), Traxens (France), Globe Tracker ApS (Denmark), Phillips Connect Technologies (USA), Emerson Electric Co. (USA), Hapag-Lloyd AG (Germany), Seaco (UK), Savvy Telematics (USA), Sensitech Inc. (USA), Robert Bosch GmbH (Germany), A.P. Moller - Maersk (Denmark), Roambee Corporation (USA), and Nexxiot (Switzerland). |
Ans: The Smart Container Market is expected to grow at a CAGR of 18.06% during 2024-2032.
Ans: The Smart Container Market was USD 4.17 Billion in 2023 and is expected to Reach USD 18.58 Billion by 2032.
Ans: Key drivers of the Smart Container Market include the increasing demand for real-time tracking, enhanced supply chain visibility, and the need for efficient inventory management across industries.
Ans: The “Hardware” segment dominated the Smart Container Market.
Ans: North America dominated the Smart Container Market in 2023
1. Introduction
1.1 Market Definition
1.2 Scope (Inclusion and Exclusions)
1.3 Research Assumptions
2. Executive Summary
2.1 Market Overview
2.2 Regional Synopsis
2.3 Competitive Summary
3. Research Methodology
3.1 Top-Down Approach
3.2 Bottom-up Approach
3.3. Data Validation
3.4 Primary Interviews
4. Market Dynamics Impact Analysis
4.1 Market Driving Factors Analysis
4.1.1 Drivers
4.1.2 Restraints
4.1.3 Opportunities
4.1.4 Challenges
4.2 PESTLE Analysis
4.3 Porter’s Five Forces Model
5. Statistical Insights and Trends Reporting
5.1 Adoption Rates
5.2 Technology Integration Rate
5.3 Consumer Behavior Data
5.4 Sensor Accuracy and Reliability
6. Competitive Landscape
6.1 List of Major Companies, By Region
6.2 Market Share Analysis, By Region
6.3 Product Benchmarking
6.3.1 Product specifications and features
6.3.2 Pricing
6.4 Strategic Initiatives
6.4.1 Marketing and promotional activities
6.4.2 Distribution and supply chain strategies
6.4.3 Expansion plans and new product launches
6.4.4 Strategic partnerships and collaborations
6.5 Technological Advancements
6.6 Market Positioning and Branding
7. Smart Container Market Segmentation, by Offering
7.1 Chapter Overview
7.2 Hardware
7.2.1 Hardware Market Trends Analysis (2020-2032)
7.2.2 Hardware Market Size Estimates and Forecasts to 2032 (USD Billion)
7.3 Software
7.3.1 Software Market Trends Analysis (2020-2032)
7.3.2 Software Market Size Estimates and Forecasts to 2032 (USD Billion)
7.4 Services
7.4.1 Services Market Trends Analysis (2020-2032)
7.4.2 Services Market Size Estimates and Forecasts to 2032 (USD Billion)
8. Smart Container Market Segmentation, by Technology
8.1 Chapter Overview
8.2 GPS
8.2.1 GPS Market Trends Analysis (2020-2032)
8.2.2 GPS Market Size Estimates and Forecasts to 2032 (USD Billion)
8.3 LoRa WAN
8.3.1 LoRa WAN Market Trends Analysis (2020-2032)
8.3.2 LoRa WAN Market Size Estimates and Forecasts to 2032 (USD Billion)
9. Smart Container Market Segmentation, by Application
9.1 Chapter Overview
9.2 Asset Tracking & Management
9.2.1 Asset Tracking & Management Market Trends Analysis (2020-2032)
9.2.2 Asset Tracking & Management Market Size Estimates and Forecasts to 2032 (USD Billion)
9.3 Supply Chain Optimization
9.3.1 Supply Chain Optimization Market Trends Analysis (2020-2032)
9.3.2 Supply Chain Optimization Market Size Estimates and Forecasts to 2032 (USD Billion)
9.4 Safety and Security
9.4.1 Safety and Security Market Trends Analysis (2020-2032)
9.4.2 Safety and Security Market Size Estimates and Forecasts to 2032 (USD Billion)
9.5 Others
9.5.1 Others Market Trends Analysis (2020-2032)
9.5.2 Others Market Size Estimates and Forecasts to 2032 (USD Billion)
10. Smart Container Market Segmentation, by End Use
10.1 Chapter Overview
10.2 Food and Beverages
10.2.1 Food and Beverages Market Trends Analysis (2020-2032)
10.2.2 Food and Beverages Market Size Estimates and Forecasts to 2032 (USD Billion)
10.3 Pharmaceuticals
10.3.1 Pharmaceuticals Market Trends Analysis (2020-2032)
10.3.2 Pharmaceuticals Market Size Estimates and Forecasts to 2032 (USD Billion)
10.4 Oil and Gas
10.4.1 Oil and Gas Market Trends Analysis (2020-2032)
10.4.2 Oil and Gas Market Size Estimates and Forecasts to 2032 (USD Billion)
10.5 Chemicals
10.5.1 Chemicals Market Trends Analysis (2020-2032)
10.5.2 Chemicals Market Size Estimates and Forecasts to 2032 (USD Billion)
10.6 Others
10.6.1 Others Market Trends Analysis (2020-2032)
10.6.2 Others Market Size Estimates and Forecasts to 2032 (USD Billion)
11. Regional Analysis
11.1 Chapter Overview
11.2 North America
11.2.1 Trends Analysis
11.2.2 North America Smart Container Market Estimates and Forecasts, by Country (2020-2032) (USD Billion)
11.2.3 North America Smart Container Market Estimates and Forecasts, by Offering (2020-2032) (USD Billion)
11.2.4 North America Smart Container Market Estimates and Forecasts, by Technology (2020-2032) (USD Billion)
11.2.5 North America Smart Container Market Estimates and Forecasts, by Application (2020-2032) (USD Billion)
11.2.6 North America Smart Container Market Estimates and Forecasts, by End Use (2020-2032) (USD Billion)
11.2.7 USA
11.2.7.1 USA Smart Container Market Estimates and Forecasts, by Offering (2020-2032) (USD Billion)
11.2.7.2 USA Smart Container Market Estimates and Forecasts, by Technology (2020-2032) (USD Billion)
11.2.7.3 USA Smart Container Market Estimates and Forecasts, by Application (2020-2032) (USD Billion)
11.2.7.4 USA Smart Container Market Estimates and Forecasts, by End Use (2020-2032) (USD Billion)
11.2.8 Canada
11.2.8.1 Canada Smart Container Market Estimates and Forecasts, by Offering (2020-2032) (USD Billion)
11.2.8.2 Canada Smart Container Market Estimates and Forecasts, by Technology (2020-2032) (USD Billion)
11.2.8.3 Canada Smart Container Market Estimates and Forecasts, by Application (2020-2032) (USD Billion)
11.2.8.4 Canada Smart Container Market Estimates and Forecasts, by End Use (2020-2032) (USD Billion)
11.2.9 Mexico
11.2.9.1 Mexico Smart Container Market Estimates and Forecasts, by Offering (2020-2032) (USD Billion)
11.2.9.2 Mexico Smart Container Market Estimates and Forecasts, by Technology (2020-2032) (USD Billion)
11.2.9.3 Mexico Smart Container Market Estimates and Forecasts, by Application (2020-2032) (USD Billion)
11.2.9.4 Mexico Smart Container Market Estimates and Forecasts, by End Use (2020-2032) (USD Billion)
11.3 Europe
11.3.1 Eastern Europe
11.3.1.1 Trends Analysis
11.3.1.2 Eastern Europe Smart Container Market Estimates and Forecasts, by Country (2020-2032) (USD Billion)
11.3.1.3 Eastern Europe Smart Container Market Estimates and Forecasts, by Offering (2020-2032) (USD Billion)
11.3.1.4 Eastern Europe Smart Container Market Estimates and Forecasts, by Technology (2020-2032) (USD Billion)
11.3.1.5 Eastern Europe Smart Container Market Estimates and Forecasts, by Application (2020-2032) (USD Billion)
11.3.1.6 Eastern Europe Smart Container Market Estimates and Forecasts, by End Use (2020-2032) (USD Billion)
11.3.1.7 Poland
11.3.1.7.1 Poland Smart Container Market Estimates and Forecasts, by Offering (2020-2032) (USD Billion)
11.3.1.7.2 Poland Smart Container Market Estimates and Forecasts, by Technology (2020-2032) (USD Billion)
11.3.1.7.3 Poland Smart Container Market Estimates and Forecasts, by Application (2020-2032) (USD Billion)
11.3.1.7.4 Poland Smart Container Market Estimates and Forecasts, by End Use (2020-2032) (USD Billion)
11.3.1.8 Romania
11.3.1.8.1 Romania Smart Container Market Estimates and Forecasts, by Offering (2020-2032) (USD Billion)
11.3.1.8.2 Romania Smart Container Market Estimates and Forecasts, by Technology (2020-2032) (USD Billion)
11.3.1.8.3 Romania Smart Container Market Estimates and Forecasts, by Application (2020-2032) (USD Billion)
11.3.1.8.4 Romania Smart Container Market Estimates and Forecasts, by End Use (2020-2032) (USD Billion)
11.3.1.9 Hungary
11.3.1.9.1 Hungary Smart Container Market Estimates and Forecasts, by Offering (2020-2032) (USD Billion)
11.3.1.9.2 Hungary Smart Container Market Estimates and Forecasts, by Technology (2020-2032) (USD Billion)
11.3.1.9.3 Hungary Smart Container Market Estimates and Forecasts, by Application (2020-2032) (USD Billion)
11.3.1.9.4 Hungary Smart Container Market Estimates and Forecasts, by End Use (2020-2032) (USD Billion)
11.3.1.10 Turkey
11.3.1.10.1 Turkey Smart Container Market Estimates and Forecasts, by Offering (2020-2032) (USD Billion)
11.3.1.10.2 Turkey Smart Container Market Estimates and Forecasts, by Technology (2020-2032) (USD Billion)
11.3.1.10.3 Turkey Smart Container Market Estimates and Forecasts, by Application (2020-2032) (USD Billion)
11.3.1.10.4 Turkey Smart Container Market Estimates and Forecasts, by End Use (2020-2032) (USD Billion)
11.3.1.11 Rest of Eastern Europe
11.3.1.11.1 Rest of Eastern Europe Smart Container Market Estimates and Forecasts, by Offering (2020-2032) (USD Billion)
11.3.1.11.2 Rest of Eastern Europe Smart Container Market Estimates and Forecasts, by Technology (2020-2032) (USD Billion)
11.3.1.11.3 Rest of Eastern Europe Smart Container Market Estimates and Forecasts, by Application (2020-2032) (USD Billion)
11.3.1.11.4 Rest of Eastern Europe Smart Container Market Estimates and Forecasts, by End Use (2020-2032) (USD Billion)
11.3.2 Western Europe
11.3.2.1 Trends Analysis
11.3.2.2 Western Europe Smart Container Market Estimates and Forecasts, by Country (2020-2032) (USD Billion)
11.3.2.3 Western Europe Smart Container Market Estimates and Forecasts, by Offering (2020-2032) (USD Billion)
11.3.2.4 Western Europe Smart Container Market Estimates and Forecasts, by Technology (2020-2032) (USD Billion)
11.3.2.5 Western Europe Smart Container Market Estimates and Forecasts, by Application (2020-2032) (USD Billion)
11.3.2.6 Western Europe Smart Container Market Estimates and Forecasts, by End Use (2020-2032) (USD Billion)
11.3.2.7 Germany
11.3.2.7.1 Germany Smart Container Market Estimates and Forecasts, by Offering (2020-2032) (USD Billion)
11.3.2.7.2 Germany Smart Container Market Estimates and Forecasts, by Technology (2020-2032) (USD Billion)
11.3.2.7.3 Germany Smart Container Market Estimates and Forecasts, by Application (2020-2032) (USD Billion)
11.3.2.7.4 Germany Smart Container Market Estimates and Forecasts, by End Use (2020-2032) (USD Billion)
11.3.2.8 France
11.3.2.8.1 France Smart Container Market Estimates and Forecasts, by Offering (2020-2032) (USD Billion)
11.3.2.8.2 France Smart Container Market Estimates and Forecasts, by Technology (2020-2032) (USD Billion)
11.3.2.8.3 France Smart Container Market Estimates and Forecasts, by Application (2020-2032) (USD Billion)
11.3.2.8.4 France Smart Container Market Estimates and Forecasts, by End Use (2020-2032) (USD Billion)
11.3.2.9 UK
11.3.2.9.1 UK Smart Container Market Estimates and Forecasts, by Offering (2020-2032) (USD Billion)
11.3.2.9.2 UK Smart Container Market Estimates and Forecasts, by Technology (2020-2032) (USD Billion)
11.3.2.9.3 UK Smart Container Market Estimates and Forecasts, by Application (2020-2032) (USD Billion)
11.3.2.9.4 UK Smart Container Market Estimates and Forecasts, by End Use (2020-2032) (USD Billion)
11.3.2.10 Italy
11.3.2.10.1 Italy Smart Container Market Estimates and Forecasts, by Offering (2020-2032) (USD Billion)
11.3.2.10.2 Italy Smart Container Market Estimates and Forecasts, by Technology (2020-2032) (USD Billion)
11.3.2.10.3 Italy Smart Container Market Estimates and Forecasts, by Application (2020-2032) (USD Billion)
11.3.2.10.4 Italy Smart Container Market Estimates and Forecasts, by End Use (2020-2032) (USD Billion)
11.3.2.11 Spain
11.3.2.11.1 Spain Smart Container Market Estimates and Forecasts, by Offering (2020-2032) (USD Billion)
11.3.2.11.2 Spain Smart Container Market Estimates and Forecasts, by Technology (2020-2032) (USD Billion)
11.3.2.11.3 Spain Smart Container Market Estimates and Forecasts, by Application (2020-2032) (USD Billion)
11.3.2.11.4 Spain Smart Container Market Estimates and Forecasts, by End Use (2020-2032) (USD Billion)
11.3.2.12 Netherlands
11.3.2.12.1 Netherlands Smart Container Market Estimates and Forecasts, by Offering (2020-2032) (USD Billion)
11.3.2.12.2 Netherlands Smart Container Market Estimates and Forecasts, by Technology (2020-2032) (USD Billion)
11.3.2.12.3 Netherlands Smart Container Market Estimates and Forecasts, by Application (2020-2032) (USD Billion)
11.3.2.12.4 Netherlands Smart Container Market Estimates and Forecasts, by End Use (2020-2032) (USD Billion)
11.3.2.13 Switzerland
11.3.2.13.1 Switzerland Smart Container Market Estimates and Forecasts, by Offering (2020-2032) (USD Billion)
11.3.2.13.2 Switzerland Smart Container Market Estimates and Forecasts, by Technology (2020-2032) (USD Billion)
11.3.2.13.3 Switzerland Smart Container Market Estimates and Forecasts, by Application (2020-2032) (USD Billion)
11.3.2.13.4 Switzerland Smart Container Market Estimates and Forecasts, by End Use (2020-2032) (USD Billion)
11.3.2.14 Austria
11.3.2.14.1 Austria Smart Container Market Estimates and Forecasts, by Offering (2020-2032) (USD Billion)
11.3.2.14.2 Austria Smart Container Market Estimates and Forecasts, by Technology (2020-2032) (USD Billion)
11.3.2.14.3 Austria Smart Container Market Estimates and Forecasts, by Application (2020-2032) (USD Billion)
11.3.2.14.4 Austria Smart Container Market Estimates and Forecasts, by End Use (2020-2032) (USD Billion)
11.3.2.15 Rest of Western Europe
11.3.2.15.1 Rest of Western Europe Smart Container Market Estimates and Forecasts, by Offering (2020-2032) (USD Billion)
11.3.2.15.2 Rest of Western Europe Smart Container Market Estimates and Forecasts, by Technology (2020-2032) (USD Billion)
11.3.2.15.3 Rest of Western Europe Smart Container Market Estimates and Forecasts, by Application (2020-2032) (USD Billion)
11.3.2.15.4 Rest of Western Europe Smart Container Market Estimates and Forecasts, by End Use (2020-2032) (USD Billion)
11.4 Asia-Pacific
11.4.1 Trends Analysis
11.4.2 Asia-Pacific Smart Container Market Estimates and Forecasts, by Country (2020-2032) (USD Billion)
11.4.3 Asia-Pacific Smart Container Market Estimates and Forecasts, by Offering (2020-2032) (USD Billion)
11.4.4 Asia-Pacific Smart Container Market Estimates and Forecasts, by Technology (2020-2032) (USD Billion)
11.4.5 Asia-Pacific Smart Container Market Estimates and Forecasts, by Application (2020-2032) (USD Billion)
11.4.6 Asia-Pacific Smart Container Market Estimates and Forecasts, by End Use (2020-2032) (USD Billion)
11.4.7 China
11.4.7.1 China Smart Container Market Estimates and Forecasts, by Offering (2020-2032) (USD Billion)
11.4.7.2 China Smart Container Market Estimates and Forecasts, by Technology (2020-2032) (USD Billion)
11.4.7.3 China Smart Container Market Estimates and Forecasts, by Application (2020-2032) (USD Billion)
11.4.7.4 China Smart Container Market Estimates and Forecasts, by End Use (2020-2032) (USD Billion)
11.4.8 India
11.4.8.1 India Smart Container Market Estimates and Forecasts, by Offering (2020-2032) (USD Billion)
11.4.8.2 India Smart Container Market Estimates and Forecasts, by Technology (2020-2032) (USD Billion)
11.4.8.3 India Smart Container Market Estimates and Forecasts, by Application (2020-2032) (USD Billion)
11.4.8.4 India Smart Container Market Estimates and Forecasts, by End Use (2020-2032) (USD Billion)
11.4.9 Japan
11.4.9.1 Japan Smart Container Market Estimates and Forecasts, by Offering (2020-2032) (USD Billion)
11.4.9.2 Japan Smart Container Market Estimates and Forecasts, by Technology (2020-2032) (USD Billion)
11.4.9.3 Japan Smart Container Market Estimates and Forecasts, by Application (2020-2032) (USD Billion)
11.4.9.4 Japan Smart Container Market Estimates and Forecasts, by End Use (2020-2032) (USD Billion)
11.4.10 South Korea
11.4.10.1 South Korea Smart Container Market Estimates and Forecasts, by Offering (2020-2032) (USD Billion)
11.4.10.2 South Korea Smart Container Market Estimates and Forecasts, by Technology (2020-2032) (USD Billion)
11.4.10.3 South Korea Smart Container Market Estimates and Forecasts, by Application (2020-2032) (USD Billion)
11.4.10.4 South Korea Smart Container Market Estimates and Forecasts, by End Use (2020-2032) (USD Billion)
11.4.11 Vietnam
11.4.11.1 Vietnam Smart Container Market Estimates and Forecasts, by Offering (2020-2032) (USD Billion)
11.4.11.2 Vietnam Smart Container Market Estimates and Forecasts, by Technology (2020-2032) (USD Billion)
11.4.11.3 Vietnam Smart Container Market Estimates and Forecasts, by Application (2020-2032) (USD Billion)
11.4.11.4 Vietnam Smart Container Market Estimates and Forecasts, by End Use (2020-2032) (USD Billion)
11.4.12 Singapore
11.4.12.1 Singapore Smart Container Market Estimates and Forecasts, by Offering (2020-2032) (USD Billion)
11.4.12.2 Singapore Smart Container Market Estimates and Forecasts, by Technology (2020-2032) (USD Billion)
11.4.12.3 Singapore Smart Container Market Estimates and Forecasts, by Application (2020-2032) (USD Billion)
11.4.12.4 Singapore Smart Container Market Estimates and Forecasts, by End Use (2020-2032) (USD Billion)
11.4.13 Australia
11.4.13.1 Australia Smart Container Market Estimates and Forecasts, by Offering (2020-2032) (USD Billion)
11.4.13.2 Australia Smart Container Market Estimates and Forecasts, by Technology (2020-2032) (USD Billion)
11.4.13.3 Australia Smart Container Market Estimates and Forecasts, by Application (2020-2032) (USD Billion)
11.4.13.4 Australia Smart Container Market Estimates and Forecasts, by End Use (2020-2032) (USD Billion)
11.4.14 Rest of Asia-Pacific
11.4.14.1 Rest of Asia-Pacific Smart Container Market Estimates and Forecasts, by Offering (2020-2032) (USD Billion)
11.4.14.2 Rest of Asia-Pacific Smart Container Market Estimates and Forecasts, by Technology (2020-2032) (USD Billion)
11.4.14.3 Rest of Asia-Pacific Smart Container Market Estimates and Forecasts, by Application (2020-2032) (USD Billion)
11.4.14.4 Rest of Asia-Pacific Smart Container Market Estimates and Forecasts, by End Use (2020-2032) (USD Billion)
11.5 Middle East and Africa
11.5.1 Middle East
11.5.1.1 Trends Analysis
11.5.1.2 Middle East Smart Container Market Estimates and Forecasts, by Country (2020-2032) (USD Billion)
11.5.1.3 Middle East Smart Container Market Estimates and Forecasts, by Offering (2020-2032) (USD Billion)
11.5.1.4 Middle East Smart Container Market Estimates and Forecasts, by Technology (2020-2032) (USD Billion)
11.5.1.5 Middle East Smart Container Market Estimates and Forecasts, by Application (2020-2032) (USD Billion)
11.5.1.6 Middle East Smart Container Market Estimates and Forecasts, by End Use (2020-2032) (USD Billion)
11.5.1.7 UAE
11.5.1.7.1 UAE Smart Container Market Estimates and Forecasts, by Offering (2020-2032) (USD Billion)
11.5.1.7.2 UAE Smart Container Market Estimates and Forecasts, by Technology (2020-2032) (USD Billion)
11.5.1.7.3 UAE Smart Container Market Estimates and Forecasts, by Application (2020-2032) (USD Billion)
11.5.1.7.4 UAE Smart Container Market Estimates and Forecasts, by End Use (2020-2032) (USD Billion)
11.5.1.8 Egypt
11.5.1.8.1 Egypt Smart Container Market Estimates and Forecasts, by Offering (2020-2032) (USD Billion)
11.5.1.8.2 Egypt Smart Container Market Estimates and Forecasts, by Technology (2020-2032) (USD Billion)
11.5.1.8.3 Egypt Smart Container Market Estimates and Forecasts, by Application (2020-2032) (USD Billion)
11.5.1.8.4 Egypt Smart Container Market Estimates and Forecasts, by End Use (2020-2032) (USD Billion)
11.5.1.9 Saudi Arabia
11.5.1.9.1 Saudi Arabia Smart Container Market Estimates and Forecasts, by Offering (2020-2032) (USD Billion)
11.5.1.9.2 Saudi Arabia Smart Container Market Estimates and Forecasts, by Technology (2020-2032) (USD Billion)
11.5.1.9.3 Saudi Arabia Smart Container Market Estimates and Forecasts, by Application (2020-2032) (USD Billion)
11.5.1.9.4 Saudi Arabia Smart Container Market Estimates and Forecasts, by End Use (2020-2032) (USD Billion)
11.5.1.10 Qatar
11.5.1.10.1 Qatar Smart Container Market Estimates and Forecasts, by Offering (2020-2032) (USD Billion)
11.5.1.10.2 Qatar Smart Container Market Estimates and Forecasts, by Technology (2020-2032) (USD Billion)
11.5.1.10.3 Qatar Smart Container Market Estimates and Forecasts, by Application (2020-2032) (USD Billion)
11.5.1.10.4 Qatar Smart Container Market Estimates and Forecasts, by End Use (2020-2032) (USD Billion)
11.5.1.11 Rest of Middle East
11.5.1.11.1 Rest of Middle East Smart Container Market Estimates and Forecasts, by Offering (2020-2032) (USD Billion)
11.5.1.11.2 Rest of Middle East Smart Container Market Estimates and Forecasts, by Technology (2020-2032) (USD Billion)
11.5.1.11.3 Rest of Middle East Smart Container Market Estimates and Forecasts, by Application (2020-2032) (USD Billion)
11.5.1.11.4 Rest of Middle East Smart Container Market Estimates and Forecasts, by End Use (2020-2032) (USD Billion)
11.5.2 Africa
11.5.2.1 Trends Analysis
11.5.2.2 Africa Smart Container Market Estimates and Forecasts, by Country (2020-2032) (USD Billion)
11.5.2.3 Africa Smart Container Market Estimates and Forecasts, by Offering (2020-2032) (USD Billion)
11.5.2.4 Africa Smart Container Market Estimates and Forecasts, by Technology (2020-2032) (USD Billion)
11.5.2.5 Africa Smart Container Market Estimates and Forecasts, by Application (2020-2032) (USD Billion)
11.5.2.6 Africa Smart Container Market Estimates and Forecasts, by End Use (2020-2032) (USD Billion)
11.5.2.7 South Africa
11.5.2.7.1 South Africa Smart Container Market Estimates and Forecasts, by Offering (2020-2032) (USD Billion)
11.5.2.7.2 South Africa Smart Container Market Estimates and Forecasts, by Technology (2020-2032) (USD Billion)
11.5.2.7.3 South Africa Smart Container Market Estimates and Forecasts, by Application (2020-2032) (USD Billion)
11.5.2.7.4 South Africa Smart Container Market Estimates and Forecasts, by End Use (2020-2032) (USD Billion)
11.5.2.8 Nigeria
11.5.2.8.1 Nigeria Smart Container Market Estimates and Forecasts, by Offering (2020-2032) (USD Billion)
11.5.2.8.2 Nigeria Smart Container Market Estimates and Forecasts, by Technology (2020-2032) (USD Billion)
11.5.2.8.3 Nigeria Smart Container Market Estimates and Forecasts, by Application (2020-2032) (USD Billion)
11.5.2.8.4 Nigeria Smart Container Market Estimates and Forecasts, by End Use (2020-2032) (USD Billion)
11.5.2.9 Rest of Africa
11.5.2.9.1 Rest of Africa Smart Container Market Estimates and Forecasts, by Offering (2020-2032) (USD Billion)
11.5.2.9.2 Rest of Africa Smart Container Market Estimates and Forecasts, by Technology (2020-2032) (USD Billion)
11.5.2.9.3 Rest of Africa Smart Container Market Estimates and Forecasts, by Application (2020-2032) (USD Billion)
11.5.2.9.4 Rest of Africa Smart Container Market Estimates and Forecasts, by End Use (2020-2032) (USD Billion)
11.6 Latin America
11.6.1 Trends Analysis
11.6.2 Latin America Smart Container Market Estimates and Forecasts, by Country (2020-2032) (USD Billion)
11.6.3 Latin America Smart Container Market Estimates and Forecasts, by Offering (2020-2032) (USD Billion)
11.6.4 Latin America Smart Container Market Estimates and Forecasts, by Technology (2020-2032) (USD Billion)
11.6.5 Latin America Smart Container Market Estimates and Forecasts, by Application (2020-2032) (USD Billion)
11.6.6 Latin America Smart Container Market Estimates and Forecasts, by End Use (2020-2032) (USD Billion)
11.6.7 Brazil
11.6.7.1 Brazil Smart Container Market Estimates and Forecasts, by Offering (2020-2032) (USD Billion)
11.6.7.2 Brazil Smart Container Market Estimates and Forecasts, by Technology (2020-2032) (USD Billion)
11.6.7.3 Brazil Smart Container Market Estimates and Forecasts, by Application (2020-2032) (USD Billion)
11.6.7.4 Brazil Smart Container Market Estimates and Forecasts, by End Use (2020-2032) (USD Billion)
11.6.8 Argentina
11.6.8.1 Argentina Smart Container Market Estimates and Forecasts, by Offering (2020-2032) (USD Billion)
11.6.8.2 Argentina Smart Container Market Estimates and Forecasts, by Technology (2020-2032) (USD Billion)
11.6.8.3 Argentina Smart Container Market Estimates and Forecasts, by Application (2020-2032) (USD Billion)
11.6.8.4 Argentina Smart Container Market Estimates and Forecasts, by End Use (2020-2032) (USD Billion)
11.6.9 Colombia
11.6.9.1 Colombia Smart Container Market Estimates and Forecasts, by Offering (2020-2032) (USD Billion)
11.6.9.2 Colombia Smart Container Market Estimates and Forecasts, by Technology (2020-2032) (USD Billion)
11.6.9.3 Colombia Smart Container Market Estimates and Forecasts, by Application (2020-2032) (USD Billion)
11.6.9.4 Colombia Smart Container Market Estimates and Forecasts, by End Use (2020-2032) (USD Billion)
11.6.10 Rest of Latin America
11.6.10.1 Rest of Latin America Smart Container Market Estimates and Forecasts, by Offering (2020-2032) (USD Billion)
11.6.10.2 Rest of Latin America Smart Container Market Estimates and Forecasts, by Technology (2020-2032) (USD Billion)
11.6.10.3 Rest of Latin America Smart Container Market Estimates and Forecasts, by Application (2020-2032) (USD Billion)
11.6.10.4 Rest of Latin America Smart Container Market Estimates and Forecasts, by End Use (2020-2032) (USD Billion)
12. Company Profiles
12.1 ORBCOMM
12.1.1 Company Overview
12.1.2 Financial
12.1.3 Products/ Services Offered
12.1.4 SWOT Analysis
12.2 Traxens
12.2.1 Company Overview
12.2.2 Financial
12.2.3 Products/ Services Offered
12.2.4 SWOT Analysis
12.3 Globe Tracker ApS
12.3.1 Company Overview
12.3.2 Financial
12.3.3 Products/ Services Offered
12.3.4 SWOT Analysis
12.4 Phillips Connect Technologies
12.4.1 Company Overview
12.4.2 Financial
12.4.3 Products/ Services Offered
12.4.4 SWOT Analysis
12.5 Emerson Electric Co.
12.5.1 Company Overview
12.5.2 Financial
12.5.3 Products/ Services Offered
12.5.4 SWOT Analysis
12.6 Hapag-Lloyd AG
12.6.1 Company Overview
12.6.2 Financial
12.6.3 Products/ Services Offered
12.6.4 SWOT Analysis
12.7 Seaco
12.7.1 Company Overview
12.7.2 Financial
12.7.3 Products/ Services Offered
12.7.4 SWOT Analysis
12.8 Savvy Telematics
12.8.1 Company Overview
12.8.2 Financial
12.8.3 Products/ Services Offered
12.8.4 SWOT Analysis
12.9 Sensitech Inc.
12.9.1 Company Overview
12.9.2 Financial
12.9.3 Products/ Services Offered
12.9.4 SWOT Analysis
12.10 Robert Bosch GmbH
12.10.1 Company Overview
12.10.2 Financial
12.10.3 Products/ Services Offered
12.10.4 SWOT Analysis
13. Use Cases and Best Practices
14. Conclusion
An accurate research report requires proper strategizing as well as implementation. There are multiple factors involved in the completion of good and accurate research report and selecting the best methodology to compete the research is the toughest part. Since the research reports we provide play a crucial role in any company’s decision-making process, therefore we at SNS Insider always believe that we should choose the best method which gives us results closer to reality. This allows us to reach at a stage wherein we can provide our clients best and accurate investment to output ratio.
Each report that we prepare takes a timeframe of 350-400 business hours for production. Starting from the selection of titles through a couple of in-depth brain storming session to the final QC process before uploading our titles on our website we dedicate around 350 working hours. The titles are selected based on their current market cap and the foreseen CAGR and growth.
The 5 steps process:
Step 1: Secondary Research:
Secondary Research or Desk Research is as the name suggests is a research process wherein, we collect data through the readily available information. In this process we use various paid and unpaid databases which our team has access to and gather data through the same. This includes examining of listed companies’ annual reports, Journals, SEC filling etc. Apart from this our team has access to various associations across the globe across different industries. Lastly, we have exchange relationships with various university as well as individual libraries.

Step 2: Primary Research
When we talk about primary research, it is a type of study in which the researchers collect relevant data samples directly, rather than relying on previously collected data. This type of research is focused on gaining content specific facts that can be sued to solve specific problems. Since the collected data is fresh and first hand therefore it makes the study more accurate and genuine.
We at SNS Insider have divided Primary Research into 2 parts.
Part 1 wherein we interview the KOLs of major players as well as the upcoming ones across various geographic regions. This allows us to have their view over the market scenario and acts as an important tool to come closer to the accurate market numbers. As many as 45 paid and unpaid primary interviews are taken from both the demand and supply side of the industry to make sure we land at an accurate judgement and analysis of the market.
This step involves the triangulation of data wherein our team analyses the interview transcripts, online survey responses and observation of on filed participants. The below mentioned chart should give a better understanding of the part 1 of the primary interview.

Part 2: In this part of primary research the data collected via secondary research and the part 1 of the primary research is validated with the interviews from individual consultants and subject matter experts.
Consultants are those set of people who have at least 12 years of experience and expertise within the industry whereas Subject Matter Experts are those with at least 15 years of experience behind their back within the same space. The data with the help of two main processes i.e., FGDs (Focused Group Discussions) and IDs (Individual Discussions). This gives us a 3rd party nonbiased primary view of the market scenario making it a more dependable one while collation of the data pointers.
Step 3: Data Bank Validation
Once all the information is collected via primary and secondary sources, we run that information for data validation. At our intelligence centre our research heads track a lot of information related to the market which includes the quarterly reports, the daily stock prices, and other relevant information. Our data bank server gets updated every fortnight and that is how the information which we collected using our primary and secondary information is revalidated in real time.

Step 4: QA/QC Process
After all the data collection and validation our team does a final level of quality check and quality assurance to get rid of any unwanted or undesired mistakes. This might include but not limited to getting rid of the any typos, duplication of numbers or missing of any important information. The people involved in this process include technical content writers, research heads and graphics people. Once this process is completed the title gets uploader on our platform for our clients to read it.
Step 5: Final QC/QA Process:
This is the last process and comes when the client has ordered the study. In this process a final QA/QC is done before the study is emailed to the client. Since we believe in giving our clients a good experience of our research studies, therefore, to make sure that we do not lack at our end in any way humanly possible we do a final round of quality check and then dispatch the study to the client.
By Offering
Hardware
Software
Services
By Technology
GPS
LoRa WAN
By Application
Asset Tracking & Management
Supply Chain Optimization
Safety and Security
Others
By End Use
Food and Beverages
Pharmaceuticals
Oil and Gas
Chemicals
Others
Request for Segment Customization as per your Business Requirement: Segment Customization Request
Regional Coverage:
North America
US
Canada
Mexico
Europe
Eastern Europe
Poland
Romania
Hungary
Turkey
Rest of Eastern Europe
Western Europe
Germany
France
UK
Italy
Spain
Netherlands
Switzerland
Austria
Rest of Western Europe
Asia Pacific
China
India
Japan
South Korea
Vietnam
Singapore
Australia
Rest of Asia Pacific
Middle East & Africa
Middle East
UAE
Egypt
Saudi Arabia
Qatar
Rest of Middle East
Africa
Nigeria
South Africa
Rest of Africa
Latin America
Brazil
Argentina
Colombia
Rest of Latin America
Request for Country Level Research Report: Country Level Customization Request
Available Customization
With the given market data, SNS Insider offers customization as per the company’s specific needs. The following customization options are available for the report:
Detailed Volume Analysis
Criss-Cross segment analysis (e.g. Product X Application)
Competitive Product Benchmarking
Geographic Analysis
Additional countries in any of the regions
Customized Data Representation
Detailed analysis and profiling of additional market players
The Rugged Tablet Market Size was valued at USD 0.96 Billion in 2023 and is expected to grow at a CAGR of 6.28% to reach USD 1.66 Billion by 2032.
The Digital Out of Home (DOOH) Market Size was valued at USD 23.66 Billion in 2023 and is expected to grow at 11.84% CAGR to reach USD 64.72 Billion by 2032.
The Industrial Thermopile Sensors Market was valued at USD 1.38 Billion in 2023 and is projected to reach USD 2.43 Billion by 2032, growing at a CAGR of 6.5% during 2024-2032.
The Inventory Tags Market Share was USD 5.51 billion in 2023 & is expected to grow to USD 8.19 billion by 2032 & grow at a CAGR of 4.51% by 2024-2032.
The Next Generation Display Market was valued at USD 208.08 billion in 2023 and is expected to reach USD 417.61 billion by 2032, growing at a CAGR of 8.09% over the forecast period 2024-2032.
The Data Acquisition (DAQ) System Market size is expected to be valued at USD 8.84 Billion in 2023. It is estimated to reach USD 17.37 Billion by 2032, growing at a CAGR of 7.8% during 2024-2032.

Hi! Click one of our member below to chat on Phone
© 2025 All Rights Reserved by SNS Insider Pvt Ltd


