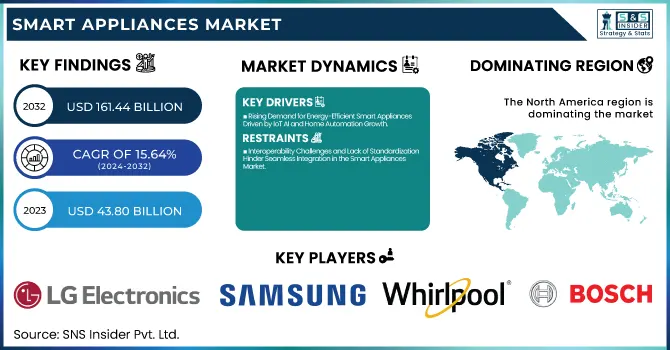
The Smart Appliances Market Size was valued at USD 43.80 billion in 2023 and is expected to reach USD 161.44 billion by 2032, growing at a CAGR of 15.64% over the forecast period 2024-2032. The use performance, AI automation, and ecosystem integration evolution driven by the Smart Appliances Market. Thus, the Smart Appliances sector contributes to growing easiness for users. Real-time energy monitoring, predictive maintenance, and adaptive learning that optimize performance are all prominent features of smart appliances today. Automation powered by AI boosts voice command precision, auto-diagnosis, and customized usage recommendations.
To Get more information on Smart Appliances Market - Request Free Sample Report
Smooth smart ecosystem integration provides compatibility with IoT platforms such as Alexa and Google Home. This solution is also reflected in the consumer dependency on automation, whether in the form of smart kitchens, autonomous HVACs, or AI-driven laundry. The shift toward more connected homes has made us more dependent on hands-free operation, predictive analytics, and personalized automation, which are all qualities of modern living.
Key Drivers:
Rising Demand for Energy-Efficient Smart Appliances Driven by IoT AI and Home Automation Growth
High adoption of energy-efficient and connected devices is the major factor driving the growth of the smart appliances market. Smart appliances are one of the major consumer elects desiring the convenience of appliances with reduced energy output and efficient home automation. The spread of Internet of Things (IoT) technology and the development of smart homes have promoted the interconnection of appliances such as refrigerators, washing machines, air conditioners, and more. Furthermore, the increasing use of artificial intelligence (AI) and machine learning is making appliances smarter as they can learn consumer preferences to optimize usage and work more efficiently, which is further pushing the growth of the market.
Restrain:
Interoperability Challenges and Lack of Standardization Hinder Seamless Integration in the Smart Appliances Market
The smart appliances market faces a few key challenges, one of which is interoperability and standardization. The problem is that there are too many manufacturers and technologies involved, so a smart appliance from one brand will not work with a smart appliance from another. Depending on compatibility, consumers might not be able to connect many kinds of appliances to its smart home ecosystem which is why people hesitate to adopt it. Decompression in communication protocols such as Wi-Fi, Bluetooth, or NFC, is a barrier to creating the market because many consumers would prefer a relatively simple, reliable solution, and there are no global standards in this aspect.
Opportunity:
Rising Commercial Demand and Sustainability Drive Growth Opportunities in the Smart Appliances Market
Unlocking similar market opportunities are growing commercial segment and a strident need for sustainable solutions With improving sustainability and savings on energy bills, commercial demand for smart appliances, like smart fridges or HVAC solutions, is about to surge. In addition, the increasing adoption of voice smart appliances with the integration of platforms such as Amazon Alexa, and Google Assistant is anticipated to create an opportunity for market growth. Developing nations incline smart appliances as well, but have less awareness of smart appliances compared to the smart appliances market news, as a result, that offers a developing ground for manufacturers to convey cheap and innovative products.
Challenges:
Security and Privacy Concerns Pose Major Barriers to Mass Adoption of Smart Home Appliances
Connectivity is also linked with security and privacy issues as well. Smart home appliances continuously collect and send data via the Internet, making them a target for cyberattacks, which in turn puts consumer privacy at risk. Consumer trust could erode through data breaches, unauthorized access, or malicious interference which would detrimentally impact adoption. Moreover, manufacturers need to handle regulation issues regarding data protection and privacy legislation areas. This public discontent complicates the development and rollout of smart appliances companies have to satisfy the local legislation, all while ensuring their product remain secure. That means consumers still hesitate about privacy and data security, which is a major barrier to mass market adoption.
By Technology
The Wi-Fi segment led the smart appliances market, in 2023, accounting for 48.6% market share. It is expected to grow at the highest CAGR over the forecast period (2024–2032) as it is the predominant technology used in smart home ecosystems. Demand for connected devices, remote control, and real-time monitoring has recently increased, stimulating the acceptance of Wi-Fi-enabled appliances. The ease of integration with smart assistants including Amazon Alexa and Google Assistant has encouraged consumers to buy Wi-Fi-enabled products, making it more user-friendly. At the same time, the market is also being pushed forward by advances in IoT and automation powered by Artificial Intelligence and Machine Learning. In line with this trend are smart appliances refrigerators, washing machines, air conditioners, etc that use Wi-Fi to provide remote operation, energy-saving, and predictive maintenance. The trend will continue to replace Wi-Fi-powered appliances as smart home adoption increases and available network infrastructures improve.
By Sales Channel
In 2023, indirect sales channels accounted for the largest share of 63.7% of the smart appliances market. The availability of various brands and competitive pricing coupled with lucrative promotional offers, propel consumers towards well-established retail chains and online marketplaces for buying smart appliances.
Direct Sales Channel is anticipated to grow fastest over 2024-2032 as manufacturers place an increasing focus on direct-to-consumer (DTC) models. Since consumers have more faith in their websites and exclusive stores, brands are now taking better advantage of them in terms of providing customized experience and improved after-sales service and price competitiveness, thus, accelerating their direct sales transition.
By End User
Residential captured a 68.2% smart appliances market share in 2023 and is estimated to expand at the highest CAGR from 2024 to 2032, owing to the growing adoption of smart homes, along with rising consumer inclination toward convenience, automation, and energy efficiency. This growth is being driven by smart and IoT-enabled home ecosystems and appliances that support homeowners who wish to control and monitor their devices remotely with ease-of-use capabilities through AI and smartphone technology. More and more consumers are buying smart fridges, washing machines, and air conditioners embedded with voice assistants, whether it's Alexa or Google Assistant. With the rising awareness for energy-efficient solutions and the availability of different government incentives for smart home adoption, the demand is also increasing. With increasing urbanization and income levels in the hands of consumers, particularly in many emerging economies, the residential segment will always remain a dominant sector in the overall market with advanced opportunities for IoT innovation & enhanced connectivity.
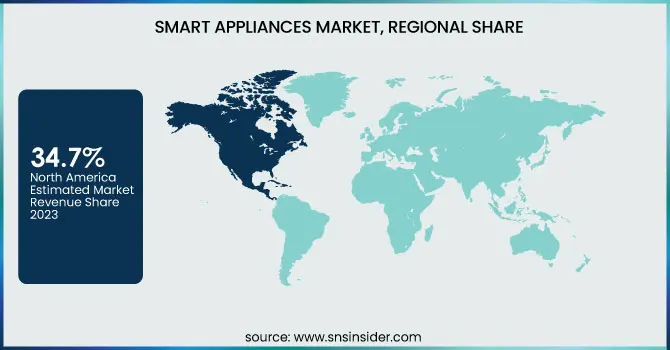
In 2023, North America held the largest 34.7% smart appliances market share, owing to increasing consumer adoption of smart home technologies, developed network infrastructure, and the presence of key industry players. Demand across smart refrigerators, washing machines, and HVAC systems is further supplemented by the presence of a tech-savvy population in the region, along with rising dependency on IoT-powered devices. The leading players include some major companies including Whirlpool Corporation (U.S.), General Electric (U.S.), and Honeywell (U.S.), who are constantly working on innovations in smart appliance connectivity and AI-integrated automation. Also, the increasing initiatives by the government to promote energy-saving devices along with the increasing adoption of voice assistants such as Amazon Alexa and Google Assistant drive the growth of the market.
Asia Pacific is predicted to hold the highest CAGR from 2024-2032 attributable to rapid urbanization, rising disposable income, and a growing middle-class population. Smart homes are gaining traction in some Asian countries like China, Japan, and India, where manufacturers like Samsung (South Korea), LG Electronics (South Korea) and Haier (China) drive market development. There are strong manufacturing capabilities in the region and the government provides smart city incentives which leads to increased demand. Moreover, growing sales through e-commerce platforms such as Alibaba and Flipkart are giving way to accessibility and higher penetration of smart appliances at an economical price to a broad consumer base.
Get Customized Report as per Your Business Requirement - Enquiry Now
Some of the major players in the Smart Appliances Market are:
Samsung (Family Hub Refrigerator, SmartThings Air Purifier)
LG (InstaView ThinQ Refrigerator, AI DD Washing Machine)
Whirlpool (Smart Front Load Washer, Smart Over-the-Range Microwave)
Bosch (Home Connect Oven, Home Connect Dishwasher)
Haier (Smart Refrigerator, Smart Washing Machine)
Electrolux (Connected Oven, Pure i9 Robotic Vacuum)
Panasonic (Connected Microwave Oven, Smart Washing Machine)
Philips (Airfryer Smart Sensing, Hue Smart Lighting)
Sony (Bravia Smart TV, Smart Speaker)
IFB (Smart Washing Machine, Built-in Oven)
Godrej (ChotuKool Refrigerator, Smart Washing Machine)
Bajaj (Smart Microwave Oven, Smart Mixer Grinder)
Hitachi (Smart Refrigerator, Smart Air Conditioner)
Lloyd (Smart LED TV, Smart Air Conditioner)
Voltas (Smart Air Conditioner, Smart Air Cooler)
In February 2025, Samsung launched its Bespoke AI Refrigerator series, featuring AI-driven energy optimization, food inventory tracking, and Instacart integration for automated grocery management.
In September 2024, Sony launched its 2024 Bravia 4K smart OLED TVs, featuring AI-driven enhancements for superior picture quality and immersive sound. The Bravia 8 OLED model offers deep contrast, vibrant colors, and a screen that doubles as a speaker for a cinematic experience.
| Report Attributes | Details |
|---|---|
| Market Size in 2023 | USD 43.80 Billion |
| Market Size by 2032 | USD 161.44 Billion |
| CAGR | CAGR of 15.64% From 2024 to 2032 |
| Base Year | 2023 |
| Forecast Period | 2024-2032 |
| Historical Data | 2020-2022 |
| Report Scope & Coverage | Market Size, Segments Analysis, Competitive Landscape, Regional Analysis, DROC & SWOT Analysis, Forecast Outlook |
| Key Segments | • By Technology (Wi-Fi, Bluetooth, Near Field Communication (NFC), Others) • By Sales Channel (Indirect Sales Channel, Direct Sales Channel) • By End User (Residential, Commercial) |
| Regional Analysis/Coverage | North America (US, Canada, Mexico), Europe (Eastern Europe [Poland, Romania, Hungary, Turkey, Rest of Eastern Europe] Western Europe] Germany, France, UK, Italy, Spain, Netherlands, Switzerland, Austria, Rest of Western Europe]), Asia Pacific (China, India, Japan, South Korea, Vietnam, Singapore, Australia, Rest of Asia Pacific), Middle East & Africa (Middle East [UAE, Egypt, Saudi Arabia, Qatar, Rest of Middle East], Africa [Nigeria, South Africa, Rest of Africa], Latin America (Brazil, Argentina, Colombia, Rest of Latin America) |
| Company Profiles | Samsung, LG, Whirlpool, Bosch, Haier, Electrolux, Panasonic, Philips, Sony, IFB, Godrej, Bajaj, Hitachi, Lloyd, Voltas. |
Ans: The Smart Appliances Market is expected to grow at a CAGR of 15.64% during 2024-2032.
Ans: Smart Appliances Market size was USD 43.80 billion in 2023 and is expected to Reach USD 161.44 billion by 2032.
Ans: The major growth factor of the Smart Appliances Market is the increasing adoption of IoT, AI-driven automation, and energy-efficient solutions, enhancing convenience, connectivity, and sustainability in modern households.
Ans: The Wi-Fi segment dominated the Smart Appliances Market in 2023.
Ans: North America dominated the Smart Appliances Market in 2023.
1. Introduction
1.1 Market Definition
1.2 Scope (Inclusion and Exclusions)
1.3 Research Assumptions
2. Executive Summary
2.1 Market Overview
2.2 Regional Synopsis
2.3 Competitive Summary
3. Research Methodology
3.1 Top-Down Approach
3.2 Bottom-up Approach
3.3. Data Validation
3.4 Primary Interviews
4. Market Dynamics Impact Analysis
4.1 Market Driving Factors Analysis
4.1.1 Drivers
4.1.2 Restraints
4.1.3 Opportunities
4.1.4 Challenges
4.2 PESTLE Analysis
4.3 Porter’s Five Forces Model
5. Statistical Insights and Trends Reporting
5.1 Usage & Performance Metrics
5.2 AI & Automation Effectiveness
5.3 Smart Ecosystem Integration
5.4 Smart Appliance Dependency Metrics
6. Competitive Landscape
6.1 List of Major Companies, By Region
6.2 Market Share Analysis, By Region
6.3 Product Benchmarking
6.3.1 Product specifications and features
6.3.2 Pricing
6.4 Strategic Initiatives
6.4.1 Marketing and Promotional Activities
6.4.2 Distribution and Supply Chain Strategies
6.4.3 Expansion plans and new product launches
6.4.4 Strategic partnerships and collaborations
6.5 Technological Advancements
6.6 Market Positioning and Branding
7. Smart Appliances Market Segmentation, By Technology
7.1 Chapter Overview
7.2 Wi-Fi
7.2.1 Wi-Fi Market Trends Analysis (2020-2032)
7.2.2 Wi-Fi Market Size Estimates and Forecasts to 2032 (USD Billion)
7.3 Bluetooth
7.3.1 Bluetooth Market Trends Analysis (2020-2032)
7.3.2 Bluetooth Market Size Estimates and Forecasts to 2032 (USD Billion)
7.4 Near Field Communication (NFC)
7.4.1 Near Field Communication (NFC) Market Trends Analysis (2020-2032)
7.4.2 Near Field Communication (NFC) Market Size Estimates and Forecasts to 2032 (USD Billion)
7.5 Others
7.5.1 Others Market Trends Analysis (2020-2032)
7.5.2 Others Market Size Estimates and Forecasts to 2032 (USD Billion)
8. Smart Appliances Market Segmentation, By Sales Channel
8.1 Chapter Overview
8.2 Indirect Sales Channel
8.2.1 Indirect Sales Channel Market Trends Analysis (2020-2032)
8.2.2 Indirect Sales Channel Market Size Estimates and Forecasts to 2032 (USD Billion)
8.3 Direct Sales Channel
8.3.1 Direct Sales Channel Market Trends Analysis (2020-2032)
8.3.2 Direct Sales Channel Market Size Estimates and Forecasts to 2032 (USD Billion)
9. Smart Appliances Market Segmentation, By End User
9.1 Chapter Overview
9.2 Residential
9.2.1 Residential Market Trends Analysis (2020-2032)
9.2.2 Residential Market Size Estimates and Forecasts to 2032 (USD Billion)
9.3 Commercial
9.3.1 Commercial Market Trends Analysis (2020-2032)
9.3.2 Commercial Market Size Estimates and Forecasts to 2032 (USD Billion)
10. Regional Analysis
10.1 Chapter Overview
10.2 North America
10.2.1 Trends Analysis
10.2.2 North America Smart Appliances Market Estimates and Forecasts, by Country (2020-2032) (USD Billion)
10.2.3 North America Smart Appliances Market Estimates and Forecasts, By Technology (2020-2032) (USD Billion)
10.2.4 North America Smart Appliances Market Estimates and Forecasts, By Sales Channel (2020-2032) (USD Billion)
10.2.5 North America Smart Appliances Market Estimates and Forecasts, By End User (2020-2032) (USD Billion)
10.2.6 USA
10.2.6.1 USA Smart Appliances Market Estimates and Forecasts, By Technology (2020-2032) (USD Billion)
10.2.6.2 USA Smart Appliances Market Estimates and Forecasts, By Sales Channel (2020-2032) (USD Billion)
10.2.6.3 USA Smart Appliances Market Estimates and Forecasts, By End User (2020-2032) (USD Billion)
10.2.7 Canada
10.2.7.1 Canada Smart Appliances Market Estimates and Forecasts, By Technology (2020-2032) (USD Billion)
10.2.7.2 Canada Smart Appliances Market Estimates and Forecasts, By Sales Channel (2020-2032) (USD Billion)
10.2.7.3 Canada Smart Appliances Market Estimates and Forecasts, By End User (2020-2032) (USD Billion)
10.2.8 Mexico
10.2.8.1 Mexico Smart Appliances Market Estimates and Forecasts, By Technology (2020-2032) (USD Billion)
10.2.8.2 Mexico Smart Appliances Market Estimates and Forecasts, By Sales Channel (2020-2032) (USD Billion)
10.2.8.3 Mexico Smart Appliances Market Estimates and Forecasts, By End User (2020-2032) (USD Billion)
10.3 Europe
10.3.1 Eastern Europe
10.3.1.1 Trends Analysis
10.3.1.2 Eastern Europe Smart Appliances Market Estimates and Forecasts, by Country (2020-2032) (USD Billion)
10.3.1.3 Eastern Europe Smart Appliances Market Estimates and Forecasts, By Technology (2020-2032) (USD Billion)
10.3.1.4 Eastern Europe Smart Appliances Market Estimates and Forecasts, By Sales Channel (2020-2032) (USD Billion)
10.3.1.5 Eastern Europe Smart Appliances Market Estimates and Forecasts, By End User (2020-2032) (USD Billion)
10.3.1.6 Poland
10.3.1.6.1 Poland Smart Appliances Market Estimates and Forecasts, By Technology (2020-2032) (USD Billion)
10.3.1.6.2 Poland Smart Appliances Market Estimates and Forecasts, By Sales Channel (2020-2032) (USD Billion)
10.3.1.6.3 Poland Smart Appliances Market Estimates and Forecasts, By End User (2020-2032) (USD Billion)
10.3.1.7 Romania
10.3.1.7.1 Romania Smart Appliances Market Estimates and Forecasts, By Technology (2020-2032) (USD Billion)
10.3.1.7.2 Romania Smart Appliances Market Estimates and Forecasts, By Sales Channel (2020-2032) (USD Billion)
10.3.1.7.3 Romania Smart Appliances Market Estimates and Forecasts, By End User (2020-2032) (USD Billion)
10.3.1.8 Hungary
10.3.1.8.1 Hungary Smart Appliances Market Estimates and Forecasts, By Technology (2020-2032) (USD Billion)
10.3.1.8.2 Hungary Smart Appliances Market Estimates and Forecasts, By Sales Channel (2020-2032) (USD Billion)
10.3.1.8.3 Hungary Smart Appliances Market Estimates and Forecasts, By End User (2020-2032) (USD Billion)
10.3.1.9 Turkey
10.3.1.9.1 Turkey Smart Appliances Market Estimates and Forecasts, By Technology (2020-2032) (USD Billion)
10.3.1.9.2 Turkey Smart Appliances Market Estimates and Forecasts, By Sales Channel (2020-2032) (USD Billion)
10.3.1.9.3 Turkey Smart Appliances Market Estimates and Forecasts, By End User (2020-2032) (USD Billion)
10.3.1.10 Rest of Eastern Europe
10.3.1.10.1 Rest of Eastern Europe Smart Appliances Market Estimates and Forecasts, By Technology (2020-2032) (USD Billion)
10.3.1.10.2 Rest of Eastern Europe Smart Appliances Market Estimates and Forecasts, By Sales Channel (2020-2032) (USD Billion)
10.3.1.10.3 Rest of Eastern Europe Smart Appliances Market Estimates and Forecasts, By End User (2020-2032) (USD Billion)
10.3.2 Western Europe
10.3.2.1 Trends Analysis
10.3.2.2 Western Europe Smart Appliances Market Estimates and Forecasts, by Country (2020-2032) (USD Billion)
10.3.2.3 Western Europe Smart Appliances Market Estimates and Forecasts, By Technology (2020-2032) (USD Billion)
10.3.2.4 Western Europe Smart Appliances Market Estimates and Forecasts, By Sales Channel (2020-2032) (USD Billion)
10.3.2.5 Western Europe Smart Appliances Market Estimates and Forecasts, By End User (2020-2032) (USD Billion)
10.3.2.6 Germany
10.3.2.6.1 Germany Smart Appliances Market Estimates and Forecasts, By Technology (2020-2032) (USD Billion)
10.3.2.6.2 Germany Smart Appliances Market Estimates and Forecasts, By Sales Channel (2020-2032) (USD Billion)
10.3.2.6.3 Germany Smart Appliances Market Estimates and Forecasts, By End User (2020-2032) (USD Billion)
10.3.2.7 France
10.3.2.7.1 France Smart Appliances Market Estimates and Forecasts, By Technology (2020-2032) (USD Billion)
10.3.2.7.2 France Smart Appliances Market Estimates and Forecasts, By Sales Channel (2020-2032) (USD Billion)
10.3.2.7.3 France Smart Appliances Market Estimates and Forecasts, By End User (2020-2032) (USD Billion)
10.3.2.8 UK
10.3.2.8.1 UK Smart Appliances Market Estimates and Forecasts, By Technology (2020-2032) (USD Billion)
10.3.2.8.2 UK Smart Appliances Market Estimates and Forecasts, By Sales Channel (2020-2032) (USD Billion)
10.3.2.8.3 UK Smart Appliances Market Estimates and Forecasts, By End User (2020-2032) (USD Billion)
10.3.2.9 Italy
10.3.2.9.1 Italy Smart Appliances Market Estimates and Forecasts, By Technology (2020-2032) (USD Billion)
10.3.2.9.2 Italy Smart Appliances Market Estimates and Forecasts, By Sales Channel (2020-2032) (USD Billion)
10.3.2.9.3 Italy Smart Appliances Market Estimates and Forecasts, By End User (2020-2032) (USD Billion)
10.3.2.10 Spain
10.3.2.10.1 Spain Smart Appliances Market Estimates and Forecasts, By Technology (2020-2032) (USD Billion)
10.3.2.10.2 Spain Smart Appliances Market Estimates and Forecasts, By Sales Channel (2020-2032) (USD Billion)
10.3.2.10.3 Spain Smart Appliances Market Estimates and Forecasts, By End User (2020-2032) (USD Billion)
10.3.2.11 Netherlands
10.3.2.11.1 Netherlands Smart Appliances Market Estimates and Forecasts, By Technology (2020-2032) (USD Billion)
10.3.2.11.2 Netherlands Smart Appliances Market Estimates and Forecasts, By Sales Channel (2020-2032) (USD Billion)
10.3.2.11.3 Netherlands Smart Appliances Market Estimates and Forecasts, By End User (2020-2032) (USD Billion)
10.3.2.12 Switzerland
10.3.2.12.1 Switzerland Smart Appliances Market Estimates and Forecasts, By Technology (2020-2032) (USD Billion)
10.3.2.12.2 Switzerland Smart Appliances Market Estimates and Forecasts, By Sales Channel (2020-2032) (USD Billion)
10.3.2.12.3 Switzerland Smart Appliances Market Estimates and Forecasts, By End User (2020-2032) (USD Billion)
10.3.2.13 Austria
10.3.2.13.1 Austria Smart Appliances Market Estimates and Forecasts, By Technology (2020-2032) (USD Billion)
10.3.2.13.2 Austria Smart Appliances Market Estimates and Forecasts, By Sales Channel (2020-2032) (USD Billion)
10.3.2.13.3 Austria Smart Appliances Market Estimates and Forecasts, By End User (2020-2032) (USD Billion)
10.3.2.14 Rest of Western Europe
10.3.2.14.1 Rest of Western Europe Smart Appliances Market Estimates and Forecasts, By Technology (2020-2032) (USD Billion)
10.3.2.14.2 Rest of Western Europe Smart Appliances Market Estimates and Forecasts, By Sales Channel (2020-2032) (USD Billion)
10.3.2.14.3 Rest of Western Europe Smart Appliances Market Estimates and Forecasts, By End User (2020-2032) (USD Billion)
10.4 Asia Pacific
10.4.1 Trends Analysis
10.4.2 Asia Pacific Smart Appliances Market Estimates and Forecasts, by Country (2020-2032) (USD Billion)
10.4.3 Asia Pacific Smart Appliances Market Estimates and Forecasts, By Technology (2020-2032) (USD Billion)
10.4.4 Asia Pacific Smart Appliances Market Estimates and Forecasts, By Sales Channel (2020-2032) (USD Billion)
10.4.5 Asia Pacific Smart Appliances Market Estimates and Forecasts, By End User (2020-2032) (USD Billion)
10.4.6 China
10.4.6.1 China Smart Appliances Market Estimates and Forecasts, By Technology (2020-2032) (USD Billion)
10.4.6.2 China Smart Appliances Market Estimates and Forecasts, By Sales Channel (2020-2032) (USD Billion)
10.4.6.3 China Smart Appliances Market Estimates and Forecasts, By End User (2020-2032) (USD Billion)
10.4.7 India
10.4.7.1 India Smart Appliances Market Estimates and Forecasts, By Technology (2020-2032) (USD Billion)
10.4.7.2 India Smart Appliances Market Estimates and Forecasts, By Sales Channel (2020-2032) (USD Billion)
10.4.7.3 India Smart Appliances Market Estimates and Forecasts, By End User (2020-2032) (USD Billion)
10.4.8 Japan
10.4.8.1 Japan Smart Appliances Market Estimates and Forecasts, By Technology (2020-2032) (USD Billion)
10.4.8.2 Japan Smart Appliances Market Estimates and Forecasts, By Sales Channel (2020-2032) (USD Billion)
10.4.8.3 Japan Smart Appliances Market Estimates and Forecasts, By End User (2020-2032) (USD Billion)
10.4.9 South Korea
10.4.9.1 South Korea Smart Appliances Market Estimates and Forecasts, By Technology (2020-2032) (USD Billion)
10.4.9.2 South Korea Smart Appliances Market Estimates and Forecasts, By Sales Channel (2020-2032) (USD Billion)
10.4.9.3 South Korea Smart Appliances Market Estimates and Forecasts, By End User (2020-2032) (USD Billion)
10.4.10 Vietnam
10.4.10.1 Vietnam Smart Appliances Market Estimates and Forecasts, By Technology (2020-2032) (USD Billion)
10.4.10.2 Vietnam Smart Appliances Market Estimates and Forecasts, By Sales Channel (2020-2032) (USD Billion)
10.4.10.3 Vietnam Smart Appliances Market Estimates and Forecasts, By End User (2020-2032) (USD Billion)
10.4.11 Singapore
10.4.11.1 Singapore Smart Appliances Market Estimates and Forecasts, By Technology (2020-2032) (USD Billion)
10.4.11.2 Singapore Smart Appliances Market Estimates and Forecasts, By Sales Channel (2020-2032) (USD Billion)
10.4.11.3 Singapore Smart Appliances Market Estimates and Forecasts, By End User (2020-2032) (USD Billion)
10.4.12 Australia
10.4.12.1 Australia Smart Appliances Market Estimates and Forecasts, By Technology (2020-2032) (USD Billion)
10.4.12.2 Australia Smart Appliances Market Estimates and Forecasts, By Sales Channel (2020-2032) (USD Billion)
10.4.12.3 Australia Smart Appliances Market Estimates and Forecasts, By End User (2020-2032) (USD Billion)
10.4.13 Rest of Asia Pacific
10.4.13.1 Rest of Asia Pacific Smart Appliances Market Estimates and Forecasts, By Technology (2020-2032) (USD Billion)
10.4.13.2 Rest of Asia Pacific Smart Appliances Market Estimates and Forecasts, By Sales Channel (2020-2032) (USD Billion)
10.4.13.3 Rest of Asia Pacific Smart Appliances Market Estimates and Forecasts, By End User (2020-2032) (USD Billion)
10.5 Middle East and Africa
10.5.1 Middle East
10.5.1.1 Trends Analysis
10.5.1.2 Middle East Smart Appliances Market Estimates and Forecasts, by Country (2020-2032) (USD Billion)
10.5.1.3 Middle East Smart Appliances Market Estimates and Forecasts, By Technology (2020-2032) (USD Billion)
10.5.1.4 Middle East Smart Appliances Market Estimates and Forecasts, By Sales Channel (2020-2032) (USD Billion)
10.5.1.5 Middle East Smart Appliances Market Estimates and Forecasts, By End User (2020-2032) (USD Billion)
10.5.1.6 UAE
10.5.1.6.1 UAE Smart Appliances Market Estimates and Forecasts, By Technology (2020-2032) (USD Billion)
10.5.1.6.2 UAE Smart Appliances Market Estimates and Forecasts, By Sales Channel (2020-2032) (USD Billion)
10.5.1.6.3 UAE Smart Appliances Market Estimates and Forecasts, By End User (2020-2032) (USD Billion)
10.5.1.7 Egypt
10.5.1.7.1 Egypt Smart Appliances Market Estimates and Forecasts, By Technology (2020-2032) (USD Billion)
10.5.1.7.2 Egypt Smart Appliances Market Estimates and Forecasts, By Sales Channel (2020-2032) (USD Billion)
10.5.1.7.3 Egypt Smart Appliances Market Estimates and Forecasts, By End User (2020-2032) (USD Billion)
10.5.1.8 Saudi Arabia
10.5.1.8.1 Saudi Arabia Smart Appliances Market Estimates and Forecasts, By Technology (2020-2032) (USD Billion)
10.5.1.8.2 Saudi Arabia Smart Appliances Market Estimates and Forecasts, By Sales Channel (2020-2032) (USD Billion)
10.5.1.8.3 Saudi Arabia Smart Appliances Market Estimates and Forecasts, By End User (2020-2032) (USD Billion)
10.5.1.9 Qatar
10.5.1.9.1 Qatar Smart Appliances Market Estimates and Forecasts, By Technology (2020-2032) (USD Billion)
10.5.1.9.2 Qatar Smart Appliances Market Estimates and Forecasts, By Sales Channel (2020-2032) (USD Billion)
10.5.1.9.3 Qatar Smart Appliances Market Estimates and Forecasts, By End User (2020-2032) (USD Billion)
10.5.1.10 Rest of Middle East
10.5.1.10.1 Rest of Middle East Smart Appliances Market Estimates and Forecasts, By Technology (2020-2032) (USD Billion)
10.5.1.10.2 Rest of Middle East Smart Appliances Market Estimates and Forecasts, By Sales Channel (2020-2032) (USD Billion)
10.5.1.10.3 Rest of Middle East Smart Appliances Market Estimates and Forecasts, By End User (2020-2032) (USD Billion)
10.5.2 Africa
10.5.2.1 Trends Analysis
10.5.2.2 Africa Smart Appliances Market Estimates and Forecasts, by Country (2020-2032) (USD Billion)
10.5.2.3 Africa Smart Appliances Market Estimates and Forecasts, By Technology (2020-2032) (USD Billion)
10.5.2.4 Africa Smart Appliances Market Estimates and Forecasts, By Sales Channel (2020-2032) (USD Billion)
10.5.2.5 Africa Smart Appliances Market Estimates and Forecasts, By End User (2020-2032) (USD Billion)
10.5.2.6 South Africa
10.5.2.6.1 South Africa Smart Appliances Market Estimates and Forecasts, By Technology (2020-2032) (USD Billion)
10.5.2.6.2 South Africa Smart Appliances Market Estimates and Forecasts, By Sales Channel (2020-2032) (USD Billion)
10.5.2.6.3 South Africa Smart Appliances Market Estimates and Forecasts, By End User (2020-2032) (USD Billion)
10.5.2.7 Nigeria
10.5.2.7.1 Nigeria Smart Appliances Market Estimates and Forecasts, By Technology (2020-2032) (USD Billion)
10.5.2.7.2 Nigeria Smart Appliances Market Estimates and Forecasts, By Sales Channel (2020-2032) (USD Billion)
10.5.2.7.3 Nigeria Smart Appliances Market Estimates and Forecasts, By End User (2020-2032) (USD Billion)
10.5.2.8 Rest of Africa
10.5.2.8.1 Rest of Africa Smart Appliances Market Estimates and Forecasts, By Technology (2020-2032) (USD Billion)
10.5.2.8.2 Rest of Africa Smart Appliances Market Estimates and Forecasts, By Sales Channel (2020-2032) (USD Billion)
10.5.2.8.3 Rest of Africa Smart Appliances Market Estimates and Forecasts, By End User (2020-2032) (USD Billion)
10.6 Latin America
10.6.1 Trends Analysis
10.6.2 Latin America Smart Appliances Market Estimates and Forecasts, by Country (2020-2032) (USD Billion)
10.6.3 Latin America Smart Appliances Market Estimates and Forecasts, By Technology (2020-2032) (USD Billion)
10.6.4 Latin America Smart Appliances Market Estimates and Forecasts, By Sales Channel (2020-2032) (USD Billion)
10.6.5 Latin America Smart Appliances Market Estimates and Forecasts, By End User (2020-2032) (USD Billion)
10.6.6 Brazil
10.6.6.1 Brazil Smart Appliances Market Estimates and Forecasts, By Technology (2020-2032) (USD Billion)
10.6.6.2 Brazil Smart Appliances Market Estimates and Forecasts, By Sales Channel (2020-2032) (USD Billion)
10.6.6.3 Brazil Smart Appliances Market Estimates and Forecasts, By End User (2020-2032) (USD Billion)
10.6.7 Argentina
10.6.7.1 Argentina Smart Appliances Market Estimates and Forecasts, By Technology (2020-2032) (USD Billion)
10.6.7.2 Argentina Smart Appliances Market Estimates and Forecasts, By Sales Channel (2020-2032) (USD Billion)
10.6.7.3 Argentina Smart Appliances Market Estimates and Forecasts, By End User (2020-2032) (USD Billion)
10.6.8 Colombia
10.6.8.1 Colombia Smart Appliances Market Estimates and Forecasts, By Technology (2020-2032) (USD Billion)
10.6.8.2 Colombia Smart Appliances Market Estimates and Forecasts, By Sales Channel (2020-2032) (USD Billion)
10.6.8.3 Colombia Smart Appliances Market Estimates and Forecasts, By End User (2020-2032) (USD Billion)
10.6.9 Rest of Latin America
10.6.9.1 Rest of Latin America Smart Appliances Market Estimates and Forecasts, By Technology (2020-2032) (USD Billion)
10.6.9.2 Rest of Latin America Smart Appliances Market Estimates and Forecasts, By Sales Channel (2020-2032) (USD Billion)
10.6.9.3 Rest of Latin America Smart Appliances Market Estimates and Forecasts, By End User (2020-2032) (USD Billion)
11. Company Profiles
11.1 Samsung.
11.1.1 Company Overview
11.1.2 Financial
11.1.3 Products/ Services Offered
11.1.4 SWOT Analysis
11.2 LG
11.2.1 Company Overview
11.2.2 Financial
11.2.3 Products/ Services Offered
11.2.4 SWOT Analysis
11.3 Whirlpool
11.3.1 Company Overview
11.3.2 Financial
11.3.3 Products/ Services Offered
11.3.4 SWOT Analysis
11.4 Bosch
11.4.1 Company Overview
11.4.2 Financial
11.4.3 Products/ Services Offered
11.4.4 SWOT Analysis
11.5 Haier
11.5.1 Company Overview
11.5.2 Financial
11.5.3 Products/ Services Offered
11.5.4 SWOT Analysis
11.6 Electrolux
11.6.1 Company Overview
11.6.2 Financial
11.6.3 Products/ Services Offered
11.6.4 SWOT Analysis
11.7 Panasonic.
11.7.1 Company Overview
11.7.2 Financial
11.7.3 Products/ Services Offered
11.7.4 SWOT Analysis
11.8 Philips.
11.8.1 Company Overview
11.8.2 Financial
11.8.3 Products/ Services Offered
11.8.4 SWOT Analysis
11.9 Sony
11.9.1 Company Overview
11.9.2 Financial
11.9.3 Products/ Services Offered
11.9.4 SWOT Analysis
11.10 IFB
11.10.1 Company Overview
11.10.2 Financial
11.10.3 Products/ Services Offered
11.10.4 SWOT Analysis
12. Use Cases and Best Practices
13. Conclusion
An accurate research report requires proper strategizing as well as implementation. There are multiple factors involved in the completion of good and accurate research report and selecting the best methodology to compete the research is the toughest part. Since the research reports we provide play a crucial role in any company’s decision-making process, therefore we at SNS Insider always believe that we should choose the best method which gives us results closer to reality. This allows us to reach at a stage wherein we can provide our clients best and accurate investment to output ratio.
Each report that we prepare takes a timeframe of 350-400 business hours for production. Starting from the selection of titles through a couple of in-depth brain storming session to the final QC process before uploading our titles on our website we dedicate around 350 working hours. The titles are selected based on their current market cap and the foreseen CAGR and growth.
The 5 steps process:
Step 1: Secondary Research:
Secondary Research or Desk Research is as the name suggests is a research process wherein, we collect data through the readily available information. In this process we use various paid and unpaid databases which our team has access to and gather data through the same. This includes examining of listed companies’ annual reports, Journals, SEC filling etc. Apart from this our team has access to various associations across the globe across different industries. Lastly, we have exchange relationships with various university as well as individual libraries.

Step 2: Primary Research
When we talk about primary research, it is a type of study in which the researchers collect relevant data samples directly, rather than relying on previously collected data. This type of research is focused on gaining content specific facts that can be sued to solve specific problems. Since the collected data is fresh and first hand therefore it makes the study more accurate and genuine.
We at SNS Insider have divided Primary Research into 2 parts.
Part 1 wherein we interview the KOLs of major players as well as the upcoming ones across various geographic regions. This allows us to have their view over the market scenario and acts as an important tool to come closer to the accurate market numbers. As many as 45 paid and unpaid primary interviews are taken from both the demand and supply side of the industry to make sure we land at an accurate judgement and analysis of the market.
This step involves the triangulation of data wherein our team analyses the interview transcripts, online survey responses and observation of on filed participants. The below mentioned chart should give a better understanding of the part 1 of the primary interview.

Part 2: In this part of primary research the data collected via secondary research and the part 1 of the primary research is validated with the interviews from individual consultants and subject matter experts.
Consultants are those set of people who have at least 12 years of experience and expertise within the industry whereas Subject Matter Experts are those with at least 15 years of experience behind their back within the same space. The data with the help of two main processes i.e., FGDs (Focused Group Discussions) and IDs (Individual Discussions). This gives us a 3rd party nonbiased primary view of the market scenario making it a more dependable one while collation of the data pointers.
Step 3: Data Bank Validation
Once all the information is collected via primary and secondary sources, we run that information for data validation. At our intelligence centre our research heads track a lot of information related to the market which includes the quarterly reports, the daily stock prices, and other relevant information. Our data bank server gets updated every fortnight and that is how the information which we collected using our primary and secondary information is revalidated in real time.

Step 4: QA/QC Process
After all the data collection and validation our team does a final level of quality check and quality assurance to get rid of any unwanted or undesired mistakes. This might include but not limited to getting rid of the any typos, duplication of numbers or missing of any important information. The people involved in this process include technical content writers, research heads and graphics people. Once this process is completed the title gets uploader on our platform for our clients to read it.
Step 5: Final QC/QA Process:
This is the last process and comes when the client has ordered the study. In this process a final QA/QC is done before the study is emailed to the client. Since we believe in giving our clients a good experience of our research studies, therefore, to make sure that we do not lack at our end in any way humanly possible we do a final round of quality check and then dispatch the study to the client.
By Technology
Wi-Fi
Bluetooth
Near Field Communication (NFC)
Others
By Sales Channel
Indirect Sales Channel
Direct Sales Channel
By End User
Residential
Commercial
Request for Segment Customization as per your Business Requirement: Segment Customization Request
Regional Coverage:
North America
US
Canada
Mexico
Europe
Eastern Europe
Poland
Romania
Hungary
Turkey
Rest of Eastern Europe
Western Europe
Germany
France
UK
Italy
Spain
Netherlands
Switzerland
Austria
Rest of Western Europe
Asia Pacific
China
India
Japan
South Korea
Vietnam
Singapore
Australia
Rest of Asia Pacific
Middle East & Africa
Middle East
UAE
Egypt
Saudi Arabia
Qatar
Rest of Middle East
Africa
Nigeria
South Africa
Rest of Africa
Latin America
Brazil
Argentina
Colombia
Rest of Latin America
Request for Country Level Research Report: Country Level Customization Request
Available Customization
With the given market data, SNS Insider offers customization as per the company’s specific needs. The following customization options are available for the report:
Detailed Volume Analysis
Criss-Cross segment analysis (e.g. Product X Application)
Competitive Product Benchmarking
Geographic Analysis
Additional countries in any of the regions
Customized Data Representation
Detailed analysis and profiling of additional market players
The Remote Sensing Technology Market size was valued at USD 19.45 billion in 2023 and is expected to grow at 11.32% CAGR to grow to USD 51.04 billion by 2032.
The Smart Plug Market Size was valued at USD 1.46 Billion in 2023 and is expected to reach USD 14.52 Billion by 2032 and grow at a CAGR of 29.03% over the forecast period of 2024-2032
The Consumer Network Attached Storage Market Size was valued at USD 5.52 Billion in 2023 and is expected to grow at a CAGR of 12.18% by forecast 2024-2032.
The Level Sensor Market Size was valued at USD 4.79 billion in 2023 and is expected to reach $9.18 billion by 2032 and grow at a CAGR of 7.50% by 2024-2032
The Infrared Thermography Market Size was valued at USD 433.5 Million in 2023 and is expected to grow at 5.95% CAGR to reach USD 729.1 Million by 2032.
The E-Waste Management Market was valued at USD 67.1 Billion in 2023 and is expected to reach USD 259.5 Billion by 2032, growing at a CAGR of 16.24% from 2024-2032.

Hi! Click one of our member below to chat on Phone
© 2025 All Rights Reserved by SNS Insider Pvt Ltd


