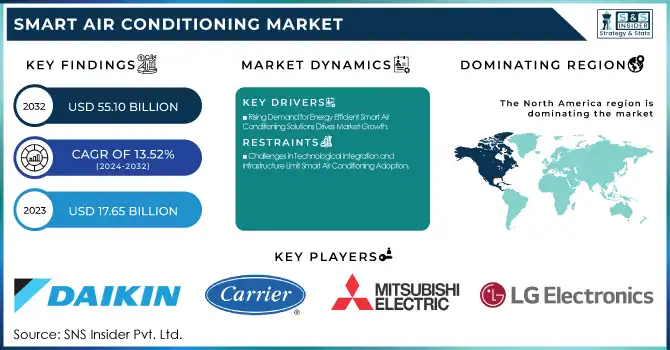
The Smart Air Conditioning Market Size was valued at USD 17.65 billion in 2023 and is expected to reach USD 55.10 billion by 2032, growing at a CAGR of 13.52% over the forecast period 2024-2032. With consumers increasingly looking for energy-efficient, connected products delivering improved comfort and efficiency, the Smart Air Conditioning market is witnessing a growing adoption of smart features.
To Get more information on Smart Air Conditioning Market - Request Free Sample Report
Using product features such as integrated systems to manage temperature, humidity and ventilation is the new normal, with IoT and AI-driven controls gaining prominence. The unwavering demand makes supply chain efficiency an important pillar for manufacturers, with strategies focused on making production and delivery seamless. Moreover, consumer retention and loyalty is a big one, as customers that benefit from high comfort and an energy efficient solution may become more loyal to the brand that provides a quality and reliable smart air conditioning product.
Key Drivers:
Rising Demand for Energy Efficient Smart Air Conditioning Solutions Drives Market Growth
Constant demand for energy-efficient solutions along with growing market awareness about sustainability is fuelling the Smart Air Conditioning market. With both consumers and businesses working towards reducing energy consumption smart air conditioning systems that continuously regulate temperature, humidity, and wind volume have become extremely popular. Such systems provide accurate control allowing you to reduce energy bills while increasing comfort. Moreover, the implementation of smart technologies like IoT and AI enables remote monitoring, real-time tuning, and predictive maintenance, making these solutions a better choice for tech-savvy customers. Additionally, the global focus on decreasing carbon footprints also promotes the adoption of sustainable air conditioners, thereby propelling the growth of the market.
Restrain:
Challenges in Technological Integration and Infrastructure Limit Smart Air Conditioning Adoption
Several restraints within the smart air conditioning market are associated with technological integration and standardization. As these systems advance, ensuring integration into infrastructure is not simple. Many older buildings (or for that matter even infrastructure) cannot simply be retrofitted with the modern, smart systems the future will require, which can create a backlog for adoption. Finally, the fast pace of tech innovation can create problems with interconnectivity, as devices made by different companies may have trouble talking to one another, irritating end users and preventing fully connected systems from reaching critical mass. Such infrastructure divides can create barriers to broader-scale smart air conditioning solutions, especially in countries with aging infrastructure.
Opportunity:
Opportunities in Smart Air Conditioning Market Driven by Smart Homes and AI Integration
The rise of smart homes and commercial buildings has created vast opportunities in the Smart Air Conditioning market. With automation slowly becoming a routine, it is crucial to integrate the air conditioning systems within the smart home ecosystems which is expected to bring a lot of growth. The most significant advantage of Smart HVAC. The increasing availability of AI-based systems, which can learn about the preferences of users and adapt settings based on these preferences, is another factor that is expected to continue stimulating development in this market. Smart air conditioning systems also have great untapped potential to grow in emerging markets experiencing rapid urbanization.
Challenges:
Lack of Awareness and Data Privacy Concerns Hinder Smart Air Conditioning Market Growth
Lack of awareness and understanding of smart air conditioning advantages in several regions is another obstacle for the market. In other markets, consumers may be unaware of what smart air conditioners can even do to improve energy efficiency and comfort. This has led to a situation of perhaps low demand, and adoption will probably be slowing above the planned roadmap. Additionally, it can be difficult for users to put their faith in these systems, largely due to data privacy and security, as most smart systems track personal usage data. While education and strong data protection will be needed to break through these barriers, the smart air conditioning market needs to grow.
By Product
Temperature Control Segment led the Smart Air Conditioning market with a 40.6% share in 2023. Temperature control in air conditioning systems being a basic function necessarily makes temperature control one main factor influencing comfort and energy efficiency.
Integrated Control is expected to experience the fastest growth in the market from 2024 to 2032. The market is witnessing a paradigm shift, with consumer inclinations moving toward all-inclusive solutions that can manage temperature, humidity, and ventilation together, coupled with state-of-the-art IoT and AI-driven functionalities in integrated systems, which we expect will fuel rapid growth in this segment.
By Application
In 2023, Residential Buildings held a 48.8% share in the Smart Air Conditioning market. With the trend towards increasingly energy-efficient homes, the consumer adoption of advanced air conditioning systems has played a frontal role in boosting the smart air conditioning systems market from side to side this year till now.
The Commercial Buildings segment is expected to experience the fastest growth in CAGR from 2024 to 2032. The demand for smart air conditioning solutions will be driven by the growth of commercial properties and businesses focusing on energy savings, sustainability, and automation this demand will be particularly high for large-scale buildings with centralized control and optimized operations.
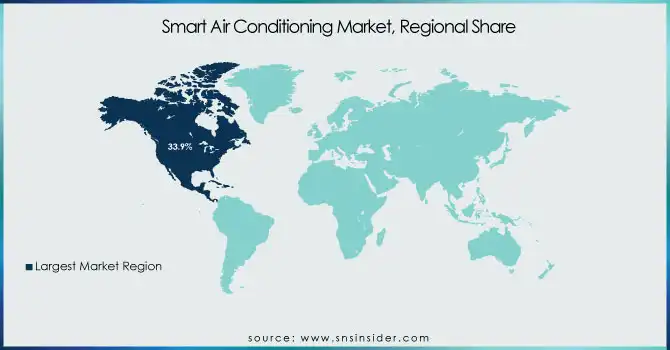
North America led the global smart air conditioning market, holding a 33.9% market share in 2023, owing to rising consumer concerns over energy-efficient solutions & quick technological progress. This is attributed to the high disposable income, sustainable environment awareness, and extensive utilization of smart home technologies in the area. For instance, in the U.S. Nest Labs sells smart thermostats that work with air conditioning systems. Elsewhere in North America, there is also widescale adoption of smart HVAC systems for commercial premises like Carrier's IoT-equipped AquaEdge 19DV system that reduces commercial high-yield energy consumption.
Asia Pacific is projected to witness the fastest growth in terms of compound annual growth rate (CAGR) from 2024 to 2032, owing to the high rate of urbanization, economic growth coupled with rapidly increasing adoption of smart technologies. This growth is driven by countries such as China, India and Japan. Take the example of Daikin, a key foreign manufacturer of equipment used in residential or commercial buildings in Japan, leading the innovations in smart air conditioning systems. Recently, smart systems have also been integrated into new high-rise residential buildings in China as well, with companies testing the limits of the smart air conditioning boundaries like Midea, Gree Electric and others.
Get Customized Report as per Your Business Requirement - Enquiry Now
Some of the major players in the Smart Air Conditioning Market are:
Daikin (Daikin Intelligent Touch, Daikin Ururu Sarara)
Carrier (Infinity 20, Performance Series)
Mitsubishi Electric (Mitsubishi MSZ-GL, Mitsubishi SEZ-KD)
LG Electronics (LG Art Cool, LG Dual Inverter)
Panasonic (Panasonic Econavi, Panasonic Nanoe X)
Samsung Electronics (Wind-Free AC, SmartThings AC)
Honeywell (Lyric T5, Honeywell Wi-Fi Smart Thermostat)
Fujitsu General (Fujitsu Airstage, Fujitsu Split System)
Toshiba (Toshiba SMMSU, Toshiba VRF)
Voltas (Voltas Inverter AC, Voltas 1.5 Ton Split AC)
Trane (Trane XL824, Trane XR14)
Johnson Controls (York YVFA, York YVAA)
Blue Star (Blue Star Inverter AC, Blue Star Split AC)
Gree Electric (Gree Inverter AC, Gree Smart AC)
Haier (Haier i-Climate, Haier Smart Air Conditioner)
In December 2024, Daikin announced the release of its Smart Control System (SCS), designed to optimize HVAC system performance for small to medium-sized commercial spaces.
In March 2024, Voltas launched its IoT-enabled SmartAir ACs with super-silent operation, featuring energy tracking and compatibility with Alexa and Google Home.
Report Attributes | Details |
---|---|
Market Size in 2023 | USD 17.65 Billion |
Market Size by 2032 | USD 55.10 Billion |
CAGR | CAGR of 13.52% From 2024 to 2032 |
Base Year | 2023 |
Forecast Period | 2024-2032 |
Historical Data | 2020-2022 |
Report Scope & Coverage | Market Size, Segments Analysis, Competitive Landscape, Regional Analysis, DROC & SWOT Analysis, Forecast Outlook |
Key Segments | • By Product (Temperature Control, Humidity Control, Ventilation Control, Integrated Control) • By Application (Residential Buildings, Commercial Buildings, Industrial Buildings) |
Regional Analysis/Coverage | North America (US, Canada, Mexico), Europe (Eastern Europe [Poland, Romania, Hungary, Turkey, Rest of Eastern Europe] Western Europe] Germany, France, UK, Italy, Spain, Netherlands, Switzerland, Austria, Rest of Western Europe]), Asia Pacific (China, India, Japan, South Korea, Vietnam, Singapore, Australia, Rest of Asia Pacific), Middle East & Africa (Middle East [UAE, Egypt, Saudi Arabia, Qatar, Rest of Middle East], Africa [Nigeria, South Africa, Rest of Africa], Latin America (Brazil, Argentina, Colombia, Rest of Latin America) |
Company Profiles | Daikin, Carrier, Mitsubishi Electric, LG Electronics, Panasonic, Samsung Electronics, Honeywell, Fujitsu General, Toshiba, Voltas, Trane, Johnson Controls, Blue Star, Gree Electric, Haier. |
Ans: The Smart Air Conditioning Market is expected to grow at a CAGR of 13.52% during 2024-2032.
Ans: Smart Air Conditioning Market size was USD 17.65 Billion in 2023 and is expected to Reach USD 55.10 Billion by 2032.
Ans: The major growth factor of the Smart Air Conditioning market is the increasing demand for energy-efficient, automated, and connected HVAC solutions.
Ans: The Temperature Control segment dominated the Industrial battery market in 2023.
Ans: North America dominated the Smart Air Conditioning Market in 2023.
1. Introduction
1.1 Market Definition
1.2 Scope (Inclusion and Exclusions)
1.3 Research Assumptions
2. Executive Summary
2.1 Market Overview
2.2 Regional Synopsis
2.3 Competitive Summary
3. Research Methodology
3.1 Top-Down Approach
3.2 Bottom-up Approach
3.3. Data Validation
3.4 Primary Interviews
4. Market Dynamics Impact Analysis
4.1 Market Driving Factors Analysis
4.1.1 Drivers
4.1.2 Restraints
4.1.3 Opportunities
4.1.4 Challenges
4.2 PESTLE Analysis
4.3 Porter’s Five Forces Model
5. Statistical Insights and Trends Reporting
5.1 Smart Features Adoption
5.2 Product Features Usage
5.3 Supply Chain Efficiency
5.4 Consumer Retention and Loyalty
6. Competitive Landscape
6.1 List of Major Companies, By Region
6.2 Market Share Analysis, By Region
6.3 Product Benchmarking
6.3.1 Product specifications and features
6.3.2 Pricing
6.4 Strategic Initiatives
6.4.1 Marketing and promotional activities
6.4.2 Distribution and Supply Chain Strategies
6.4.3 Expansion plans and new product launches
6.4.4 Strategic partnerships and collaborations
6.5 Technological Advancements
6.6 Market Positioning and Branding
7. Smart Air Conditioning Market Segmentation, By Product
7.1 Chapter Overview
7.2 Temperature Control
7.2.1 Temperature Control Market Trends Analysis (2020-2032)
7.2.2 Temperature Control Market Size Estimates and Forecasts to 2032 (USD BILLION)
7.3 Humidity Control
7.3.1 Humidity Control Market Trends Analysis (2020-2032)
7.3.2 Humidity Control Market Size Estimates and Forecasts to 2032 (USD BILLION)
7.4 Ventilation Control
7.4.1 Ventilation Control Market Trends Analysis (2020-2032)
7.4.2 Ventilation Control Market Size Estimates and Forecasts to 2032 (USD BILLION)
7.5 Integrated Control
7.5.1 Integrated Control Market Trends Analysis (2020-2032)
7.5.2 Integrated Control Market Size Estimates and Forecasts to 2032 (USD BILLION)
8. Smart Air Conditioning Market Segmentation, By Application
8.1 Chapter Overview
8.2 Residential Buildings
8.2.1 Residential Buildings Market Trends Analysis (2020-2032)
8.2.2 Residential Buildings Market Size Estimates and Forecasts to 2032 (USD BILLION)
8.3 Commercial Buildings
8.3.1 Commercial Buildings Market Trends Analysis (2020-2032)
8.3.2 Commercial Buildings Market Size Estimates and Forecasts to 2032 (USD BILLION)
8.4 Industrial Buildings
8.4.1 Industrial Buildings Market Trends Analysis (2020-2032)
8.4.2 Industrial Buildings Market Size Estimates and Forecasts to 2032 (USD BILLION)
9. Regional Analysis
9.1 Chapter Overview
9.2 North America
9.2.1 Trends Analysis
9.2.2 North America Smart Air Conditioning Market Estimates and Forecasts, by Country (2020-2032) (USD BILLION)
9.2.3 North America Smart Air Conditioning Market Estimates and Forecasts, By Product (2020-2032) (USD BILLION)
9.2.4 North America Smart Air Conditioning Market Estimates and Forecasts, By Application (2020-2032) (USD BILLION)
9.2.5 USA
9.2.5.1 USA Smart Air Conditioning Market Estimates and Forecasts, By Product (2020-2032) (USD BILLION)
9.2.5.2 USA Smart Air Conditioning Market Estimates and Forecasts, By Application (2020-2032) (USD BILLION)
9.2.6 Canada
9.2.6.1 Canada Smart Air Conditioning Market Estimates and Forecasts, By Product (2020-2032) (USD BILLION)
9.2.6.2 Canada Smart Air Conditioning Market Estimates and Forecasts, By Application (2020-2032) (USD BILLION)
9.2.7 Mexico
9.2.7.1 Mexico Smart Air Conditioning Market Estimates and Forecasts, By Product (2020-2032) (USD BILLION)
9.2.7.2 Mexico Smart Air Conditioning Market Estimates and Forecasts, By Application (2020-2032) (USD BILLION)
9.3 Europe
9.3.1 Eastern Europe
9.3.1.1 Trends Analysis
9.3.1.2 Eastern Europe Smart Air Conditioning Market Estimates and Forecasts, by Country (2020-2032) (USD BILLION)
9.3.1.3 Eastern Europe Smart Air Conditioning Market Estimates and Forecasts, By Product (2020-2032) (USD BILLION)
9.3.1.4 Eastern Europe Smart Air Conditioning Market Estimates and Forecasts, By Application (2020-2032) (USD BILLION)
9.3.1.5 Poland
9.3.1.5.1 Poland Smart Air Conditioning Market Estimates and Forecasts, By Product (2020-2032) (USD BILLION)
9.3.1.5.2 Poland Smart Air Conditioning Market Estimates and Forecasts, By Application (2020-2032) (USD BILLION)
9.3.1.6 Romania
9.3.1.6.1 Romania Smart Air Conditioning Market Estimates and Forecasts, By Product (2020-2032) (USD BILLION)
9.3.1.6.2 Romania Smart Air Conditioning Market Estimates and Forecasts, By Application (2020-2032) (USD BILLION)
9.3.1.7 Hungary
9.3.1.7.1 Hungary Smart Air Conditioning Market Estimates and Forecasts, By Product (2020-2032) (USD BILLION)
9.3.1.7.2 Hungary Smart Air Conditioning Market Estimates and Forecasts, By Application (2020-2032) (USD BILLION)
9.3.1.8 turkey
9.3.1.8.1 Turkey Smart Air Conditioning Market Estimates and Forecasts, By Product (2020-2032) (USD BILLION)
9.3.1.8.2 Turkey Smart Air Conditioning Market Estimates and Forecasts, By Application (2020-2032) (USD BILLION)
9.3.1.9 Rest of Eastern Europe
9.3.1.9.1 Rest of Eastern Europe Smart Air Conditioning Market Estimates and Forecasts, By Product (2020-2032) (USD BILLION)
9.3.1.9.2 Rest of Eastern Europe Smart Air Conditioning Market Estimates and Forecasts, By Application (2020-2032) (USD BILLION)
9.3.2 Western Europe
9.3.2.1 Trends Analysis
9.3.2.2 Western Europe Smart Air Conditioning Market Estimates and Forecasts, by Country (2020-2032) (USD BILLION)
9.3.2.3 Western Europe Smart Air Conditioning Market Estimates and Forecasts, By Product (2020-2032) (USD BILLION)
9.3.2.4 Western Europe Smart Air Conditioning Market Estimates and Forecasts, By Application (2020-2032) (USD BILLION)
9.3.2.5 Germany
9.3.2.5.1 Germany Smart Air Conditioning Market Estimates and Forecasts, By Product (2020-2032) (USD BILLION)
9.3.2.5.2 Germany Smart Air Conditioning Market Estimates and Forecasts, By Application (2020-2032) (USD BILLION)
9.3.2.6 France
9.3.2.6.1 France Smart Air Conditioning Market Estimates and Forecasts, By Product (2020-2032) (USD BILLION)
9.3.2.6.2 France Smart Air Conditioning Market Estimates and Forecasts, By Application (2020-2032) (USD BILLION)
9.3.2.7 UK
9.3.2.7.1 UK Smart Air Conditioning Market Estimates and Forecasts, By Product (2020-2032) (USD BILLION)
9.3.2.7.2 UK Smart Air Conditioning Market Estimates and Forecasts, By Application (2020-2032) (USD BILLION)
9.3.2.8 Italy
9.3.2.8.1 Italy Smart Air Conditioning Market Estimates and Forecasts, By Product (2020-2032) (USD BILLION)
9.3.2.8.2 Italy Smart Air Conditioning Market Estimates and Forecasts, By Application (2020-2032) (USD BILLION)
9.3.2.9 Spain
9.3.2.9.1 Spain Smart Air Conditioning Market Estimates and Forecasts, By Product (2020-2032) (USD BILLION)
9.3.2.9.2 Spain Smart Air Conditioning Market Estimates and Forecasts, By Application (2020-2032) (USD BILLION)
9.3.2.10 Netherlands
9.3.2.10.1 Netherlands Smart Air Conditioning Market Estimates and Forecasts, By Product (2020-2032) (USD BILLION)
9.3.2.10.2 Netherlands Smart Air Conditioning Market Estimates and Forecasts, By Application (2020-2032) (USD BILLION)
9.3.2.11 Switzerland
9.3.2.11.1 Switzerland Smart Air Conditioning Market Estimates and Forecasts, By Product (2020-2032) (USD BILLION)
9.3.2.11.2 Switzerland Smart Air Conditioning Market Estimates and Forecasts, By Application (2020-2032) (USD BILLION)
9.3.2.12 Austria
9.3.2.12.1 Austria Smart Air Conditioning Market Estimates and Forecasts, By Product (2020-2032) (USD BILLION)
9.3.2.12.2 Austria Smart Air Conditioning Market Estimates and Forecasts, By Application (2020-2032) (USD BILLION)
9.3.2.13 Rest of Western Europe
9.3.2.13.1 Rest of Western Europe Smart Air Conditioning Market Estimates and Forecasts, By Product (2020-2032) (USD BILLION)
9.3.2.13.2 Rest of Western Europe Smart Air Conditioning Market Estimates and Forecasts, By Application (2020-2032) (USD BILLION)
9.4 Asia Pacific
9.4.1 Trends Analysis
9.4.2 Asia Pacific Smart Air Conditioning Market Estimates and Forecasts, by Country (2020-2032) (USD BILLION)
9.4.3 Asia Pacific Smart Air Conditioning Market Estimates and Forecasts, By Product (2020-2032) (USD BILLION)
9.4.4 Asia Pacific Smart Air Conditioning Market Estimates and Forecasts, By Application (2020-2032) (USD BILLION)
9.4.5 China
9.4.5.1 China Smart Air Conditioning Market Estimates and Forecasts, By Product (2020-2032) (USD BILLION)
9.4.5.2 China Smart Air Conditioning Market Estimates and Forecasts, By Application (2020-2032) (USD BILLION)
9.4.6 India
9.4.5.1 India Smart Air Conditioning Market Estimates and Forecasts, By Product (2020-2032) (USD BILLION)
9.4.5.2 India Smart Air Conditioning Market Estimates and Forecasts, By Application (2020-2032) (USD BILLION)
9.4.5 Japan
9.4.5.1 Japan Smart Air Conditioning Market Estimates and Forecasts, By Product (2020-2032) (USD BILLION)
9.4.5.2 Japan Smart Air Conditioning Market Estimates and Forecasts, By Application (2020-2032) (USD BILLION)
9.4.6 South Korea
9.4.6.1 South Korea Smart Air Conditioning Market Estimates and Forecasts, By Product (2020-2032) (USD BILLION)
9.4.6.2 South Korea Smart Air Conditioning Market Estimates and Forecasts, By Application (2020-2032) (USD BILLION)
9.4.7 Vietnam
9.4.7.1 Vietnam Smart Air Conditioning Market Estimates and Forecasts, By Product (2020-2032) (USD BILLION)
9.2.7.2 Vietnam Smart Air Conditioning Market Estimates and Forecasts, By Application (2020-2032) (USD BILLION)
9.4.8 Singapore
9.4.8.1 Singapore Smart Air Conditioning Market Estimates and Forecasts, By Product (2020-2032) (USD BILLION)
9.4.8.2 Singapore Smart Air Conditioning Market Estimates and Forecasts, By Application (2020-2032) (USD BILLION)
9.4.9 Australia
9.4.9.1 Australia Smart Air Conditioning Market Estimates and Forecasts, By Product (2020-2032) (USD BILLION)
9.4.9.2 Australia Smart Air Conditioning Market Estimates and Forecasts, By Application (2020-2032) (USD BILLION)
9.4.10 Rest of Asia Pacific
9.4.10.1 Rest of Asia Pacific Smart Air Conditioning Market Estimates and Forecasts, By Product (2020-2032) (USD BILLION)
9.4.10.2 Rest of Asia Pacific Smart Air Conditioning Market Estimates and Forecasts, By Application (2020-2032) (USD BILLION)
9.5 Middle East and Africa
9.5.1 Middle East
9.5.1.1 Trends Analysis
9.5.1.2 Middle East Smart Air Conditioning Market Estimates and Forecasts, by Country (2020-2032) (USD BILLION)
9.5.1.3 Middle East Smart Air Conditioning Market Estimates and Forecasts, By Product (2020-2032) (USD BILLION)
9.5.1.4 Middle East Smart Air Conditioning Market Estimates and Forecasts, By Application (2020-2032) (USD BILLION)
9.5.1.5 UAE
9.5.1.5.1 UAE Smart Air Conditioning Market Estimates and Forecasts, By Product (2020-2032) (USD BILLION)
9.5.1.5.2 UAE Smart Air Conditioning Market Estimates and Forecasts, By Application (2020-2032) (USD BILLION)
9.5.1.6 Egypt
9.5.1.6.1 Egypt Smart Air Conditioning Market Estimates and Forecasts, By Product (2020-2032) (USD BILLION)
9.5.1.6.2 Egypt Smart Air Conditioning Market Estimates and Forecasts, By Application (2020-2032) (USD BILLION)
9.5.1.7 Saudi Arabia
9.5.1.7.1 Saudi Arabia Smart Air Conditioning Market Estimates and Forecasts, By Product (2020-2032) (USD BILLION)
9.5.1.7.2 Saudi Arabia Smart Air Conditioning Market Estimates and Forecasts, By Application (2020-2032) (USD BILLION)
9.5.1.8 Qatar
9.5.1.8.1 Qatar Smart Air Conditioning Market Estimates and Forecasts, By Product (2020-2032) (USD BILLION)
9.5.1.8.2 Qatar Smart Air Conditioning Market Estimates and Forecasts, By Application (2020-2032) (USD BILLION)
9.5.1.9 Rest of Middle East
9.5.1.9.1 Rest of Middle East Smart Air Conditioning Market Estimates and Forecasts, By Product (2020-2032) (USD BILLION)
9.5.1.9.2 Rest of Middle East Smart Air Conditioning Market Estimates and Forecasts, By Application (2020-2032) (USD BILLION)
9.5.2 Africa
9.5.2.1 Trends Analysis
9.5.2.2 Africa Smart Air Conditioning Market Estimates and Forecasts, by Country (2020-2032) (USD BILLION)
9.5.2.3 Africa Smart Air Conditioning Market Estimates and Forecasts, By Product (2020-2032) (USD BILLION)
9.5.2.4 Africa Smart Air Conditioning Market Estimates and Forecasts, By Application (2020-2032) (USD BILLION)
9.5.2.5 South Africa
9.5.2.5.1 South Africa Smart Air Conditioning Market Estimates and Forecasts, By Product (2020-2032) (USD BILLION)
9.5.2.5.2 South Africa Smart Air Conditioning Market Estimates and Forecasts, By Application (2020-2032) (USD BILLION)
9.5.2.6 Nigeria
9.5.2.6.1 Nigeria Smart Air Conditioning Market Estimates and Forecasts, By Product (2020-2032) (USD BILLION)
9.5.2.6.2 Nigeria Smart Air Conditioning Market Estimates and Forecasts, By Application (2020-2032) (USD BILLION)
9.5.2.7 Rest of Africa
9.5.2.7.1 Rest of Africa Smart Air Conditioning Market Estimates and Forecasts, By Product (2020-2032) (USD BILLION)
9.5.2.7.2 Rest of Africa Smart Air Conditioning Market Estimates and Forecasts, By Application (2020-2032) (USD BILLION)
9.6 Latin America
9.6.1 Trends Analysis
9.6.2 Latin America Smart Air Conditioning Market Estimates and Forecasts, by Country (2020-2032) (USD BILLION)
9.6.3 Latin America Smart Air Conditioning Market Estimates and Forecasts, By Product (2020-2032) (USD BILLION)
9.6.4 Latin America Smart Air Conditioning Market Estimates and Forecasts, By Application (2020-2032) (USD BILLION)
9.6.5 Brazil
9.6.5.1 Brazil Smart Air Conditioning Market Estimates and Forecasts, By Product (2020-2032) (USD BILLION)
9.6.5.2 Brazil Smart Air Conditioning Market Estimates and Forecasts, By Application (2020-2032) (USD BILLION)
9.6.6 Argentina
9.6.6.1 Argentina Smart Air Conditioning Market Estimates and Forecasts, By Product (2020-2032) (USD BILLION)
9.6.6.2 Argentina Smart Air Conditioning Market Estimates and Forecasts, By Application (2020-2032) (USD BILLION)
9.6.7 Colombia
9.6.7.1 Colombia Smart Air Conditioning Market Estimates and Forecasts, By Product (2020-2032) (USD BILLION)
9.6.7.2 Colombia Smart Air Conditioning Market Estimates and Forecasts, By Application (2020-2032) (USD BILLION)
9.6.8 Rest of Latin America
9.6.8.1 Rest of Latin America Smart Air Conditioning Market Estimates and Forecasts, By Product (2020-2032) (USD BILLION)
9.6.8.2 Rest of Latin America Smart Air Conditioning Market Estimates and Forecasts, By Application (2020-2032) (USD BILLION)
10. Company Profiles
10.1 Daikin.
10.1.1 Company Overview
10.1.2 Financial
10.1.3 Products/ Services Offered
110.1.4 SWOT Analysis
10.2 Carrier
10.2.1 Company Overview
10.2.2 Financial
10.2.3 Products/ Services Offered
10.2.4 SWOT Analysis
10.3 Mitsubishi Electric
10.3.1 Company Overview
10.3.2 Financial
10.3.3 Products/ Services Offered
10.3.4 SWOT Analysis
10.4 LG Electronics
10.4.1 Company Overview
10.4.2 Financial
10.4.3 Products/ Services Offered
10.4.4 SWOT Analysis
10.5 Panasonic
10.5.1 Company Overview
10.5.2 Financial
10.5.3 Products/ Services Offered
10.5.4 SWOT Analysis
10.6 Samsung Electronics.
10.6.1 Company Overview
10.6.2 Financial
10.6.3 Products/ Services Offered
10.6.4 SWOT Analysis
10.7 Honeywell.
10.7.1 Company Overview
10.7.2 Financial
10.7.3 Products/ Services Offered
10.7.4 SWOT Analysis
10.8 Fujitsu General
10.8.1 Company Overview
10.8.2 Financial
10.8.3 Products/ Services Offered
10.8.4 SWOT Analysis
10.9 Toshiba
10.9.1 Company Overview
10.9.2 Financial
10.9.3 Products/ Services Offered
10.9.4 SWOT Analysis
10.10 Voltas.
10.9.1 Company Overview
10.9.2 Financial
10.9.3 Products/ Services Offered
10.9.4 SWOT Analysis
11. Use Cases and Best Practices
12. Conclusion
An accurate research report requires proper strategizing as well as implementation. There are multiple factors involved in the completion of good and accurate research report and selecting the best methodology to compete the research is the toughest part. Since the research reports we provide play a crucial role in any company’s decision-making process, therefore we at SNS Insider always believe that we should choose the best method which gives us results closer to reality. This allows us to reach at a stage wherein we can provide our clients best and accurate investment to output ratio.
Each report that we prepare takes a timeframe of 350-400 business hours for production. Starting from the selection of titles through a couple of in-depth brain storming session to the final QC process before uploading our titles on our website we dedicate around 350 working hours. The titles are selected based on their current market cap and the foreseen CAGR and growth.
The 5 steps process:
Step 1: Secondary Research:
Secondary Research or Desk Research is as the name suggests is a research process wherein, we collect data through the readily available information. In this process we use various paid and unpaid databases which our team has access to and gather data through the same. This includes examining of listed companies’ annual reports, Journals, SEC filling etc. Apart from this our team has access to various associations across the globe across different industries. Lastly, we have exchange relationships with various university as well as individual libraries.
Step 2: Primary Research
When we talk about primary research, it is a type of study in which the researchers collect relevant data samples directly, rather than relying on previously collected data. This type of research is focused on gaining content specific facts that can be sued to solve specific problems. Since the collected data is fresh and first hand therefore it makes the study more accurate and genuine.
We at SNS Insider have divided Primary Research into 2 parts.
Part 1 wherein we interview the KOLs of major players as well as the upcoming ones across various geographic regions. This allows us to have their view over the market scenario and acts as an important tool to come closer to the accurate market numbers. As many as 45 paid and unpaid primary interviews are taken from both the demand and supply side of the industry to make sure we land at an accurate judgement and analysis of the market.
This step involves the triangulation of data wherein our team analyses the interview transcripts, online survey responses and observation of on filed participants. The below mentioned chart should give a better understanding of the part 1 of the primary interview.
Part 2: In this part of primary research the data collected via secondary research and the part 1 of the primary research is validated with the interviews from individual consultants and subject matter experts.
Consultants are those set of people who have at least 12 years of experience and expertise within the industry whereas Subject Matter Experts are those with at least 15 years of experience behind their back within the same space. The data with the help of two main processes i.e., FGDs (Focused Group Discussions) and IDs (Individual Discussions). This gives us a 3rd party nonbiased primary view of the market scenario making it a more dependable one while collation of the data pointers.
Step 3: Data Bank Validation
Once all the information is collected via primary and secondary sources, we run that information for data validation. At our intelligence centre our research heads track a lot of information related to the market which includes the quarterly reports, the daily stock prices, and other relevant information. Our data bank server gets updated every fortnight and that is how the information which we collected using our primary and secondary information is revalidated in real time.
Step 4: QA/QC Process
After all the data collection and validation our team does a final level of quality check and quality assurance to get rid of any unwanted or undesired mistakes. This might include but not limited to getting rid of the any typos, duplication of numbers or missing of any important information. The people involved in this process include technical content writers, research heads and graphics people. Once this process is completed the title gets uploader on our platform for our clients to read it.
Step 5: Final QC/QA Process:
This is the last process and comes when the client has ordered the study. In this process a final QA/QC is done before the study is emailed to the client. Since we believe in giving our clients a good experience of our research studies, therefore, to make sure that we do not lack at our end in any way humanly possible we do a final round of quality check and then dispatch the study to the client.
By Product
Temperature Control
Humidity Control
Ventilation Control
Integrated Control
By Application
Residential Buildings
Commercial Buildings
Industrial Buildings
Request for Segment Customization as per your Business Requirement: Segment Customization Request
Regional Coverage:
North America
US
Canada
Mexico
Europe
Eastern Europe
Poland
Romania
Hungary
Turkey
Rest of Eastern Europe
Western Europe
Germany
France
UK
Italy
Spain
Netherlands
Switzerland
Austria
Rest of Western Europe
Asia Pacific
China
India
Japan
South Korea
Vietnam
Singapore
Australia
Rest of Asia Pacific
Middle East & Africa
Middle East
UAE
Egypt
Saudi Arabia
Qatar
Rest of Middle East
Africa
Nigeria
South Africa
Rest of Africa
Latin America
Brazil
Argentina
Colombia
Rest of Latin America
Request for Country Level Research Report: Country Level Customization Request
Available Customization
With the given market data, SNS Insider offers customization as per the company’s specific needs. The following customization options are available for the report:
Detailed Volume Analysis
Criss-Cross segment analysis (e.g. Product X Application)
Competitive Product Benchmarking
Geographic Analysis
Additional countries in any of the regions
Customized Data Representation
Detailed analysis and profiling of additional market players
The Advanced Semiconductor Materials Market Size was USD 50.55 Billion in 2023 & will reach $140.38 Bn by 2032 & grow at a CAGR of 12.1% by 2024-2032.
The Electronic Manufacturing Services Market Size was valued at USD 553.51 Billion in 2023, growing at a CAGR of 5.55% During Forecast 2024-2032
The 360-degree Camera Market size was valued at USD 1.50 billion in 2023 and is expected to reach USD 13.18 billion by 2032 and grow at a CAGR of 27.32% over the forecast period 2024-2032.
The Automation Control Components and Devices Market Size was valued at USD 74.09 billion in 2023 and is expected to reach USD 197.35 billion by 2032 and grow at a CAGR of 11.5% over the forecast period 2024-2032.
The Spintronics Market Size was valued at USD 1.07 Billion in 2023 and is expected to grow at a CAGR of 35.67% to reach USD 16.64 Billion by 2032.
The Wi-Fi Chipset Market Size was valued at USD 23.78 Billion in 2023. It is estimated to reach USD 37.16 Billion, growing at a CAGR of 5.11% by 2032
Hi! Click one of our member below to chat on Phone