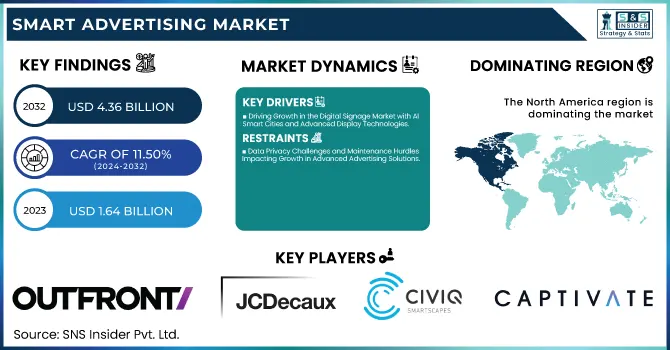
The Smart Advertising Market Size was valued at USD 1.64 billion in 2023 and is expected to reach USD 4.36 billion by 2032, growing at a CAGR of 11.50% over the forecast period 2024-2032. The Smart Advertising Market has many advances that are marching along with technological development in the future. Real-time statistics allow advertisers to monitor impressions, engagement rates, and conversions to gain campaign insights and improve performance over time. Targeting & Reach are improved based on geolocation data, which means that ads will appear in some of the most visited places you can imagine.
To Get more information on Smart Advertising Market - Request Free Sample Report
For operational & infrastructure, integrated cloud-based content management systems are being adopted and IoT-enabled displays are used to streamline content delivery and system maintenance. On the other hand, content effectiveness is propelled by smarter content optimization, AI-powered personalization, and elements to brace interactive viewing that deepens engagement and engage better brand recall.
Key Drivers:
Driving Growth in the Digital Signage Market with AI Smart Cities and Advanced Display Technologies
The increasing adoption of digital signage solutions across various industries is a major factor driving the growth of the portable digital signage market as it allows organizations to attract the attention of end-users by delivering content in an engaging format. Increasing the use of AI and data analytics in advertising platforms is perfecting the targeted marketing strategies, improving customer engagement, and marketing ROI. Moreover, growing investments in the development of smart city projects, which, in turn, are boosting the demand for digital billboards, interactive kiosks, and other smart advertising solutions, are further propagating the growth of the digital signage market. Moreover, the increasing speed of growth in the retail sector along with the trend for customized consumer experiences foster the market expansion. In addition, progress in display technologies like OLED, LED, and 4K are enhancing the visual quality, drawing advertisers towards digital modes.
Restrain:
Data Privacy Challenges and Maintenance Hurdles Impacting Growth in Advanced Advertising Solutions
There are several restraints such as data privacy issues related to personalized advertisement. With advanced advertising solutions utilizing AI, IoT, and data analytics to provide tailored content, the apprehension for user data collecting and privacy safeguarding is also surging. Regulations like GDPR and CCPA are stricter and obligate businesses to implement strong data security measures, complicating marketing strategies. Moreover, the requirement for regular content updates and maintenance creates operational challenges, especially for resource-constrained businesses or those lacking technical proficiency.
Opportunity:
Unlocking Growth Opportunities in Smart Advertising with IoT Real-Time Data and Digital Transformation
Strong IoT and real-time data analysis in smart advertising cannot be ignored for the opportunity it has to offer and capitalize on. They provide advertisers with the ability to serve targeted content derived from customer behavior, demographics, and geographical location, which makes a campaign much more effective. Thirdly, the increasing trend of programmatic advertising provides another opportunity for growth in automating billboard advertisement placement and allowing for real-time bidding to reach the desired audience. Also, the rising acceptance of digital posters over traditional posters in indoor areas, such as malls, restaurants, or events arenas, is estimated to provide potential opportunities as well. Room for market growth is also available with expanding digital transformation initiatives in developing regions, particularly in the retail, healthcare, and transportation sectors.
Challenges:
Overcoming Integration Technical Issues and Workforce Gaps in Advanced Advertising System Deployment
There is a further technical difficulty involved in combining intelligent advertising systems with existing infrastructure. Integrating hardware, software solutions, and content management systems for seamless connectivity can be difficult to synchronize, particularly among larger deployments. Moreover, hardware repair problems like display faults, connectivity problems, or environmental deterioration can affect system work. This creates challenges with adoption in industries like retail and hospitality, where uptime is critical to customer experience. Finally, deploying advanced advertising solutions and analyzing complex campaign data creates a shortfall in skilled professionals, which is a workforce issue, especially for small and medium-sized enterprises (SMEs). These challenges need to be overcome for the market to continue growing.
By Component
The hardware segment held the largest share of the smart advertising market in 2023, being 47.5% of the overall market share. The high demand for digital billboards, interactive kiosks, and digital signage displays in industries such as retail, transportation, and hospitality is attributable to this segment growth. The significant hardware market share was also attributed to the increased adoption of LED and OLED display technology.
The software type segment is expected to hold the fastest CAGR between 2024 and 2032. The increasing adoption of AI analytics, content management systems (CMS), and cloud-based platforms allows the processing of data in real-time & permits personalized advertising to emerge this growth. With businesses slowly shifting focus towards ubiquitous marketing as well as dynamic content delivery, the demand for smart advertising software is also anticipated to boost the growth of the associated market, in turn creating new growth opportunities worldwide.
By Product
The digital billboard segment is expected to hold the largest share at 41.5% of the smart advertising market in 2023. When you look at the market drivers behind this dominance, it was largely due to the trend in multiple digital billboard placements including highways, shopping centers, and transportation hubs. The market is high on its strong market positioning ability to display dynamic content give better visibility and enable better engagement.
The digital poster category is expected to experience the highest CAGR during the forecast period (2024 – 2032) The growth is primarily due to the increasing demand for cost-effective and flexible advertising solutions in indoor environments such as retail shops, restaurants, and event venues. Digital posters have become preferable as they are highly suitable for updating content with ease and have energy-efficient solutions while also being a digitized form of poster choice that aids businesses in their marketing solutions that focus more towards custom-specific audiences and create unique selling points through appearance which has visual elements.
By End Use
In 2023, the corporate segment represented the largest share of the smart advertising market with 36.7% of the total smart advertising market. The growth in this segment was bolstered by the high penetration of digital signage solutions across corporate offices, conference rooms, and business events to improve communication, branding, and employee engagement. They were followed by the growing emphasis on digital transformation in business ecosystems, which boosted the propensity for smart advertising implementations.
The food & beverage segment is expected to register the highest CAGR in the forecasted period 2024 to 2032. Digital menu boards, interactive displays, and promotional screens are being adopted in restaurants, cafes, and fast-food chains, which is driving this growth. Such solutions also allow businesses to display dynamic content, update menus in real-time, and engage customers, which is predicted to fuel a positive growth outlook for the food & beverage segment.
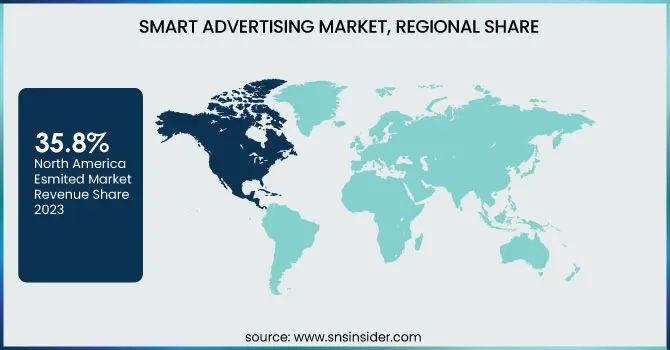
North America was observed to be the leading region in smart advertising having 35.8% of the total market share in the year 2023. This is due to the availability of a well-established digital infrastructure, significant adoption of AI-driven advertising solutions, and prominent industry players in this market in the region. We have seen digital billboards in the US, especially in such busy hubs as the New York Times Square or Las Vegas Strip in which advertisers can benefit from dynamic content for large audiences. Big box retailers such as Walmart and Target are also heavy users of digital signage for in-store marketing that drives engagement. This has further pushed North America to the front row of the market with growing interactive kiosk usage at international airports and public places.
The Asia-Pacific region is expected to grow at the highest CAGR from 2024 to 2032. This growth is primarily attributed to continuous investments in smart city initiatives and also accelerate towards digitalization in countries namely China, India, and Japan. Entire businesses and practices have shifted, from the gigantic digital billboards at Tokyo's Shibuya Crossing that promote brands to fast-food chains in India adopting digital menu boards to optimize the in-store customer experience. It is due to the expanding retail space and some more factors, i.e. Increasing demand for personalized content by the consumer in the region.
Get Customized Report as per Your Business Requirement - Enquiry Now
Some of the major players in the Smart Advertising Market are:
Outfront Media, Inc. (Billboard Advertising)
JCDecaux Group (VIOOH Platform)
CIVIQ Smartscapes (Smart City Kiosks)
Captivate, LLC (Office Elevator Displays)
Intersection (LinkNYC Kiosks)
Exterion Media Limited (Transport for London Advertising)
Clear Channel Outdoor Holdings, Inc. (Digital Billboards)
Lamar Advertising Company (Digital Transit Displays)
IKE Smart City (Interactive Kiosks)
Changing Environments, Inc. (Smart Urban Furniture)
Coniq (IQ Reach Platform)
InMobi (Pulse Consumer Insights)
Proxim.ai (Audience Location Analysis)
The Trade Desk (Programmatic Advertising Platform)
Integral Ad Science (Ad Verification Services)
In February 2025, JCDecaux Top Media expanded its presence in Latin America by acquiring High Traffic Media, strengthening its digital out-of-home advertising network in Panama’s high-traffic locations.
| Report Attributes | Details |
|---|---|
| Market Size in 2023 | USD 1.64 Billion |
| Market Size by 2032 | USD 4.36 Billion |
| CAGR | CAGR of 11.50% From 2024 to 2032 |
| Base Year | 2023 |
| Forecast Period | 2024-2032 |
| Historical Data | 2020-2022 |
| Report Scope & Coverage | Market Size, Segments Analysis, Competitive Landscape, Regional Analysis, DROC & SWOT Analysis, Forecast Outlook |
| Key Segments | • By Component (Hardware, Software, Services) • By Product (Interactive Kiosk, Digital Billboard, Digital Poster, Others) • By End Use (Corporate, Government, Education, Food & Beverage, Others) |
| Regional Analysis/Coverage | North America (US, Canada, Mexico), Europe (Eastern Europe [Poland, Romania, Hungary, Turkey, Rest of Eastern Europe] Western Europe] Germany, France, UK, Italy, Spain, Netherlands, Switzerland, Austria, Rest of Western Europe]), Asia Pacific (China, India, Japan, South Korea, Vietnam, Singapore, Australia, Rest of Asia Pacific), Middle East & Africa (Middle East [UAE, Egypt, Saudi Arabia, Qatar, Rest of Middle East], Africa [Nigeria, South Africa, Rest of Africa], Latin America (Brazil, Argentina, Colombia, Rest of Latin America) |
| Company Profiles | Outfront Media, JCDecaux Group, CIVIQ Smartscapes, Captivate, Intersection, Exterion Media, Clear Channel Outdoor, Lamar Advertising, IKE Smart City, Changing Environments, Coniq, InMobi, Proxim.ai, The Trade Desk, Integral Ad Science. |
Ans: The Smart Advertising Market is expected to grow at a CAGR of 11.50% during 2024-2032.
Ans: Smart Advertising Market size was USD 1.64 billion in 2023 and is expected to Reach USD 4.36 billion by 2032.
Ans: The major growth factor of the Smart Advertising Market is the increasing adoption of AI-driven analytics and data-driven personalization, enhancing targeted advertising effectiveness.
Ans: The Hardware segment dominated the Smart Advertising Market in 2023.
Ans: North America dominated the Smart Advertising Market in 2023.
1. Introduction
1.1 Market Definition
1.2 Scope (Inclusion and Exclusions)
1.3 Research Assumptions
2. Executive Summary
2.1 Market Overview
2.2 Regional Synopsis
2.3 Competitive Summary
3. Research Methodology
3.1 Top-Down Approach
3.2 Bottom-up Approach
3.3. Data Validation
3.4 Primary Interviews
4. Market Dynamics Impact Analysis
4.1 Market Driving Factors Analysis
4.1.1 Drivers
4.1.2 Restraints
4.1.3 Opportunities
4.1.4 Challenges
4.2 PESTLE Analysis
4.3 Porter’s Five Forces Model
5. Statistical Insights and Trends Reporting
5.1 Advertising Performance Metrics
5.2 Ad Placement & Reach Metrics
5.3 Operational & Infrastructure Metrics
5.4 Content Effectiveness Metrics
6. Competitive Landscape
6.1 List of Major Companies, By Region
6.2 Market Share Analysis, By Region
6.3 Product Benchmarking
6.3.1 Product specifications and features
6.3.2 Pricing
6.4 Strategic Initiatives
6.4.1 Marketing and Promotional Activities
6.4.2 Distribution and Supply Chain Strategies
6.4.3 Expansion plans and new product launches
6.4.4 Strategic partnerships and collaborations
6.5 Technological Advancements
6.6 Market Positioning and Branding
7. Smart Advertising Market Segmentation, By Component
7.1 Chapter Overview
7.2 Hardware
7.2.1 Hardware Market Trends Analysis (2020-2032)
7.2.2 Hardware Market Size Estimates and Forecasts to 2032 (USD Billion)
7.3 Software
7.3.1 Software Market Trends Analysis (2020-2032)
7.3.2 Software Market Size Estimates and Forecasts to 2032 (USD Billion)
7.4 Services
7.4.1 Services Market Trends Analysis (2020-2032)
7.4.2 Services Market Size Estimates and Forecasts to 2032 (USD Billion)
8. Smart Advertising Market Segmentation, By Product
8.1 Chapter Overview
8.2 Interactive Kiosk
8.2.1 Interactive Kiosk Market Trends Analysis (2020-2032)
8.2.2 Interactive Kiosk Market Size Estimates and Forecasts to 2032 (USD Billion)
8.3 Digital Billboard
8.3.1 Digital Billboard Market Trends Analysis (2020-2032)
8.3.2 Digital Billboard Market Size Estimates and Forecasts to 2032 (USD Billion)
8.4 Digital Poster
8.4.1 Digital Poster Market Trends Analysis (2020-2032)
8.4.2 Digital Poster Market Size Estimates and Forecasts to 2032 (USD Billion)
8.5 Others
8.5.1 Others Market Trends Analysis (2020-2032)
8.5.2 Others Market Size Estimates and Forecasts to 2032 (USD Billion)
9. Smart Advertising Market Segmentation, By End Use
9.1 Chapter Overview
9.2 Corporate
9.2.1 Corporate Market Trends Analysis (2020-2032)
9.2.2 Corporate Market Size Estimates and Forecasts to 2032 (USD Billion)
9.3 Government
9.3.1 Government Market Trends Analysis (2020-2032)
9.3.2 Government Market Size Estimates and Forecasts to 2032 (USD Billion)
9.4 Education
9.4.1 Education Market Trends Analysis (2020-2032)
9.4.2 Education Market Size Estimates and Forecasts to 2032 (USD Billion)
9.5 Food & Beverage
9.5.1 Food & Beverage Monitoring Market Trends Analysis (2020-2032)
9.5.2 Food & Beverage Monitoring Market Size Estimates and Forecasts to 2032 (USD Billion)
9.6 Others
9.6.1 Others Market Trends Analysis (2020-2032)
9.6.2 Others Market Size Estimates and Forecasts to 2032 (USD Billion)
10. Regional Analysis
10.1 Chapter Overview
10.2 North America
10.2.1 Trends Analysis
10.2.2 North America Smart Advertising Market Estimates and Forecasts, by Country (2020-2032) (USD Billion)
10.2.3 North America Smart Advertising Market Estimates and Forecasts, By Component (2020-2032) (USD Billion)
10.2.4 North America Smart Advertising Market Estimates and Forecasts, By Product (2020-2032) (USD Billion)
10.2.5 North America Smart Advertising Market Estimates and Forecasts, By End Use (2020-2032) (USD Billion)
10.2.6 USA
10.2.6.1 USA Smart Advertising Market Estimates and Forecasts, By Component (2020-2032) (USD Billion)
10.2.6.2 USA Smart Advertising Market Estimates and Forecasts, By Product (2020-2032) (USD Billion)
10.2.6.3 USA Smart Advertising Market Estimates and Forecasts, By End Use (2020-2032) (USD Billion)
10.2.7 Canada
10.2.7.1 Canada Smart Advertising Market Estimates and Forecasts, By Component (2020-2032) (USD Billion)
10.2.7.2 Canada Smart Advertising Market Estimates and Forecasts, By Product (2020-2032) (USD Billion)
10.2.7.3 Canada Smart Advertising Market Estimates and Forecasts, By End Use (2020-2032) (USD Billion)
10.2.8 Mexico
10.2.8.1 Mexico Smart Advertising Market Estimates and Forecasts, By Component (2020-2032) (USD Billion)
10.2.8.2 Mexico Smart Advertising Market Estimates and Forecasts, By Product (2020-2032) (USD Billion)
10.2.8.3 Mexico Smart Advertising Market Estimates and Forecasts, By End Use (2020-2032) (USD Billion)
10.3 Europe
10.3.1 Eastern Europe
10.3.1.1 Trends Analysis
10.3.1.2 Eastern Europe Smart Advertising Market Estimates and Forecasts, by Country (2020-2032) (USD Billion)
10.3.1.3 Eastern Europe Smart Advertising Market Estimates and Forecasts, By Component (2020-2032) (USD Billion)
10.3.1.4 Eastern Europe Smart Advertising Market Estimates and Forecasts, By Product (2020-2032) (USD Billion)
10.3.1.5 Eastern Europe Smart Advertising Market Estimates and Forecasts, By End Use (2020-2032) (USD Billion)
10.3.1.6 Poland
10.3.1.6.1 Poland Smart Advertising Market Estimates and Forecasts, By Component (2020-2032) (USD Billion)
10.3.1.6.2 Poland Smart Advertising Market Estimates and Forecasts, By Product (2020-2032) (USD Billion)
10.3.1.6.3 Poland Smart Advertising Market Estimates and Forecasts, By End Use (2020-2032) (USD Billion)
10.3.1.7 Romania
10.3.1.7.1 Romania Smart Advertising Market Estimates and Forecasts, By Component (2020-2032) (USD Billion)
10.3.1.7.2 Romania Smart Advertising Market Estimates and Forecasts, By Product (2020-2032) (USD Billion)
10.3.1.7.3 Romania Smart Advertising Market Estimates and Forecasts, By End Use (2020-2032) (USD Billion)
10.3.1.8 Hungary
10.3.1.8.1 Hungary Smart Advertising Market Estimates and Forecasts, By Component (2020-2032) (USD Billion)
10.3.1.8.2 Hungary Smart Advertising Market Estimates and Forecasts, By Product (2020-2032) (USD Billion)
10.3.1.8.3 Hungary Smart Advertising Market Estimates and Forecasts, By End Use (2020-2032) (USD Billion)
10.3.1.9 Turkey
10.3.1.9.1 Turkey Smart Advertising Market Estimates and Forecasts, By Component (2020-2032) (USD Billion)
10.3.1.9.2 Turkey Smart Advertising Market Estimates and Forecasts, By Product (2020-2032) (USD Billion)
10.3.1.9.3 Turkey Smart Advertising Market Estimates and Forecasts, By End Use (2020-2032) (USD Billion)
10.3.1.10 Rest of Eastern Europe
10.3.1.10.1 Rest of Eastern Europe Smart Advertising Market Estimates and Forecasts, By Component (2020-2032) (USD Billion)
10.3.1.10.2 Rest of Eastern Europe Smart Advertising Market Estimates and Forecasts, By Product (2020-2032) (USD Billion)
10.3.1.10.3 Rest of Eastern Europe Smart Advertising Market Estimates and Forecasts, By End Use (2020-2032) (USD Billion)
10.3.2 Western Europe
10.3.2.1 Trends Analysis
10.3.2.2 Western Europe Smart Advertising Market Estimates and Forecasts, by Country (2020-2032) (USD Billion)
10.3.2.3 Western Europe Smart Advertising Market Estimates and Forecasts, By Component (2020-2032) (USD Billion)
10.3.2.4 Western Europe Smart Advertising Market Estimates and Forecasts, By Product (2020-2032) (USD Billion)
10.3.2.5 Western Europe Smart Advertising Market Estimates and Forecasts, By End Use (2020-2032) (USD Billion)
10.3.2.6 Germany
10.3.2.6.1 Germany Smart Advertising Market Estimates and Forecasts, By Component (2020-2032) (USD Billion)
10.3.2.6.2 Germany Smart Advertising Market Estimates and Forecasts, By Product (2020-2032) (USD Billion)
10.3.2.6.3 Germany Smart Advertising Market Estimates and Forecasts, By End Use (2020-2032) (USD Billion)
10.3.2.7 France
10.3.2.7.1 France Smart Advertising Market Estimates and Forecasts, By Component (2020-2032) (USD Billion)
10.3.2.7.2 France Smart Advertising Market Estimates and Forecasts, By Product (2020-2032) (USD Billion)
10.3.2.7.3 France Smart Advertising Market Estimates and Forecasts, By End Use (2020-2032) (USD Billion)
10.3.2.8 UK
10.3.2.8.1 UK Smart Advertising Market Estimates and Forecasts, By Component (2020-2032) (USD Billion)
10.3.2.8.2 UK Smart Advertising Market Estimates and Forecasts, By Product (2020-2032) (USD Billion)
10.3.2.8.3 UK Smart Advertising Market Estimates and Forecasts, By End Use (2020-2032) (USD Billion)
10.3.2.9 Italy
10.3.2.9.1 Italy Smart Advertising Market Estimates and Forecasts, By Component (2020-2032) (USD Billion)
10.3.2.9.2 Italy Smart Advertising Market Estimates and Forecasts, By Product (2020-2032) (USD Billion)
10.3.2.9.3 Italy Smart Advertising Market Estimates and Forecasts, By End Use (2020-2032) (USD Billion)
10.3.2.10 Spain
10.3.2.10.1 Spain Smart Advertising Market Estimates and Forecasts, By Component (2020-2032) (USD Billion)
10.3.2.10.2 Spain Smart Advertising Market Estimates and Forecasts, By Product (2020-2032) (USD Billion)
10.3.2.10.3 Spain Smart Advertising Market Estimates and Forecasts, By End Use (2020-2032) (USD Billion)
10.3.2.11 Netherlands
10.3.2.11.1 Netherlands Smart Advertising Market Estimates and Forecasts, By Component (2020-2032) (USD Billion)
10.3.2.11.2 Netherlands Smart Advertising Market Estimates and Forecasts, By Product (2020-2032) (USD Billion)
10.3.2.11.3 Netherlands Smart Advertising Market Estimates and Forecasts, By End Use (2020-2032) (USD Billion)
10.3.2.12 Switzerland
10.3.2.12.1 Switzerland Smart Advertising Market Estimates and Forecasts, By Component (2020-2032) (USD Billion)
10.3.2.12.2 Switzerland Smart Advertising Market Estimates and Forecasts, By Product (2020-2032) (USD Billion)
10.3.2.12.3 Switzerland Smart Advertising Market Estimates and Forecasts, By End Use (2020-2032) (USD Billion)
10.3.2.13 Austria
10.3.2.13.1 Austria Smart Advertising Market Estimates and Forecasts, By Component (2020-2032) (USD Billion)
10.3.2.13.2 Austria Smart Advertising Market Estimates and Forecasts, By Product (2020-2032) (USD Billion)
10.3.2.13.3 Austria Smart Advertising Market Estimates and Forecasts, By End Use (2020-2032) (USD Billion)
10.3.2.14 Rest of Western Europe
10.3.2.14.1 Rest of Western Europe Smart Advertising Market Estimates and Forecasts, By Component (2020-2032) (USD Billion)
10.3.2.14.2 Rest of Western Europe Smart Advertising Market Estimates and Forecasts, By Product (2020-2032) (USD Billion)
10.3.2.14.3 Rest of Western Europe Smart Advertising Market Estimates and Forecasts, By End Use (2020-2032) (USD Billion)
10.4 Asia Pacific
10.4.1 Trends Analysis
10.4.2 Asia Pacific Smart Advertising Market Estimates and Forecasts, by Country (2020-2032) (USD Billion)
10.4.3 Asia Pacific Smart Advertising Market Estimates and Forecasts, By Component (2020-2032) (USD Billion)
10.4.4 Asia Pacific Smart Advertising Market Estimates and Forecasts, By Product (2020-2032) (USD Billion)
10.4.5 Asia Pacific Smart Advertising Market Estimates and Forecasts, By End Use (2020-2032) (USD Billion)
10.4.6 China
10.4.6.1 China Smart Advertising Market Estimates and Forecasts, By Component (2020-2032) (USD Billion)
10.4.6.2 China Smart Advertising Market Estimates and Forecasts, By Product (2020-2032) (USD Billion)
10.4.6.3 China Smart Advertising Market Estimates and Forecasts, By End Use (2020-2032) (USD Billion)
10.4.7 India
10.4.7.1 India Smart Advertising Market Estimates and Forecasts, By Component (2020-2032) (USD Billion)
10.4.7.2 India Smart Advertising Market Estimates and Forecasts, By Product (2020-2032) (USD Billion)
10.4.7.3 India Smart Advertising Market Estimates and Forecasts, By End Use (2020-2032) (USD Billion)
10.4.8 Japan
10.4.8.1 Japan Smart Advertising Market Estimates and Forecasts, By Component (2020-2032) (USD Billion)
10.4.8.2 Japan Smart Advertising Market Estimates and Forecasts, By Product (2020-2032) (USD Billion)
10.4.8.3 Japan Smart Advertising Market Estimates and Forecasts, By End Use (2020-2032) (USD Billion)
10.4.9 South Korea
10.4.9.1 South Korea Smart Advertising Market Estimates and Forecasts, By Component (2020-2032) (USD Billion)
10.4.9.2 South Korea Smart Advertising Market Estimates and Forecasts, By Product (2020-2032) (USD Billion)
10.4.9.3 South Korea Smart Advertising Market Estimates and Forecasts, By End Use (2020-2032) (USD Billion)
10.4.10 Vietnam
10.4.10.1 Vietnam Smart Advertising Market Estimates and Forecasts, By Component (2020-2032) (USD Billion)
10.4.10.2 Vietnam Smart Advertising Market Estimates and Forecasts, By Product (2020-2032) (USD Billion)
10.4.10.3 Vietnam Smart Advertising Market Estimates and Forecasts, By End Use (2020-2032) (USD Billion)
10.4.11 Singapore
10.4.11.1 Singapore Smart Advertising Market Estimates and Forecasts, By Component (2020-2032) (USD Billion)
10.4.11.2 Singapore Smart Advertising Market Estimates and Forecasts, By Product (2020-2032) (USD Billion)
10.4.11.3 Singapore Smart Advertising Market Estimates and Forecasts, By End Use (2020-2032) (USD Billion)
10.4.12 Australia
10.4.12.1 Australia Smart Advertising Market Estimates and Forecasts, By Component (2020-2032) (USD Billion)
10.4.12.2 Australia Smart Advertising Market Estimates and Forecasts, By Product (2020-2032) (USD Billion)
10.4.12.3 Australia Smart Advertising Market Estimates and Forecasts, By End Use (2020-2032) (USD Billion)
10.4.13 Rest of Asia Pacific
10.4.13.1 Rest of Asia Pacific Smart Advertising Market Estimates and Forecasts, By Component (2020-2032) (USD Billion)
10.4.13.2 Rest of Asia Pacific Smart Advertising Market Estimates and Forecasts, By Product (2020-2032) (USD Billion)
10.4.13.3 Rest of Asia Pacific Smart Advertising Market Estimates and Forecasts, By End Use (2020-2032) (USD Billion)
10.5 Middle East and Africa
10.5.1 Middle East
10.5.1.1 Trends Analysis
10.5.1.2 Middle East Smart Advertising Market Estimates and Forecasts, by Country (2020-2032) (USD Billion)
10.5.1.3 Middle East Smart Advertising Market Estimates and Forecasts, By Component (2020-2032) (USD Billion)
10.5.1.4 Middle East Smart Advertising Market Estimates and Forecasts, By Product (2020-2032) (USD Billion)
10.5.1.5 Middle East Smart Advertising Market Estimates and Forecasts, By End Use (2020-2032) (USD Billion)
10.5.1.6 UAE
10.5.1.6.1 UAE Smart Advertising Market Estimates and Forecasts, By Component (2020-2032) (USD Billion)
10.5.1.6.2 UAE Smart Advertising Market Estimates and Forecasts, By Product (2020-2032) (USD Billion)
10.5.1.6.3 UAE Smart Advertising Market Estimates and Forecasts, By End Use (2020-2032) (USD Billion)
10.5.1.7 Egypt
10.5.1.7.1 Egypt Smart Advertising Market Estimates and Forecasts, By Component (2020-2032) (USD Billion)
10.5.1.7.2 Egypt Smart Advertising Market Estimates and Forecasts, By Product (2020-2032) (USD Billion)
10.5.1.7.3 Egypt Smart Advertising Market Estimates and Forecasts, By End Use (2020-2032) (USD Billion)
10.5.1.8 Saudi Arabia
10.5.1.8.1 Saudi Arabia Smart Advertising Market Estimates and Forecasts, By Component (2020-2032) (USD Billion)
10.5.1.8.2 Saudi Arabia Smart Advertising Market Estimates and Forecasts, By Product (2020-2032) (USD Billion)
10.5.1.8.3 Saudi Arabia Smart Advertising Market Estimates and Forecasts, By End Use (2020-2032) (USD Billion)
10.5.1.9 Qatar
10.5.1.9.1 Qatar Smart Advertising Market Estimates and Forecasts, By Component (2020-2032) (USD Billion)
10.5.1.9.2 Qatar Smart Advertising Market Estimates and Forecasts, By Product (2020-2032) (USD Billion)
10.5.1.9.3 Qatar Smart Advertising Market Estimates and Forecasts, By End Use (2020-2032) (USD Billion)
10.5.1.10 Rest of Middle East
10.5.1.10.1 Rest of Middle East Smart Advertising Market Estimates and Forecasts, By Component (2020-2032) (USD Billion)
10.5.1.10.2 Rest of Middle East Smart Advertising Market Estimates and Forecasts, By Product (2020-2032) (USD Billion)
10.5.1.10.3 Rest of Middle East Smart Advertising Market Estimates and Forecasts, By End Use (2020-2032) (USD Billion)
10.5.2 Africa
10.5.2.1 Trends Analysis
10.5.2.2 Africa Smart Advertising Market Estimates and Forecasts, by Country (2020-2032) (USD Billion)
10.5.2.3 Africa Smart Advertising Market Estimates and Forecasts, By Component (2020-2032) (USD Billion)
10.5.2.4 Africa Smart Advertising Market Estimates and Forecasts, By Product (2020-2032) (USD Billion)
10.5.2.5 Africa Smart Advertising Market Estimates and Forecasts, By End Use (2020-2032) (USD Billion)
10.5.2.6 South Africa
10.5.2.6.1 South Africa Smart Advertising Market Estimates and Forecasts, By Component (2020-2032) (USD Billion)
10.5.2.6.2 South Africa Smart Advertising Market Estimates and Forecasts, By Product (2020-2032) (USD Billion)
10.5.2.6.3 South Africa Smart Advertising Market Estimates and Forecasts, By End Use (2020-2032) (USD Billion)
10.5.2.7 Nigeria
10.5.2.7.1 Nigeria Smart Advertising Market Estimates and Forecasts, By Component (2020-2032) (USD Billion)
10.5.2.7.2 Nigeria Smart Advertising Market Estimates and Forecasts, By Product (2020-2032) (USD Billion)
10.5.2.7.3 Nigeria Smart Advertising Market Estimates and Forecasts, By End Use (2020-2032) (USD Billion)
10.5.2.8 Rest of Africa
10.5.2.8.1 Rest of Africa Smart Advertising Market Estimates and Forecasts, By Component (2020-2032) (USD Billion)
10.5.2.8.2 Rest of Africa Smart Advertising Market Estimates and Forecasts, By Product (2020-2032) (USD Billion)
10.5.2.8.3 Rest of Africa Smart Advertising Market Estimates and Forecasts, By End Use (2020-2032) (USD Billion)
10.6 Latin America
10.6.1 Trends Analysis
10.6.2 Latin America Smart Advertising Market Estimates and Forecasts, by Country (2020-2032) (USD Billion)
10.6.3 Latin America Smart Advertising Market Estimates and Forecasts, By Component (2020-2032) (USD Billion)
10.6.4 Latin America Smart Advertising Market Estimates and Forecasts, By Product (2020-2032) (USD Billion)
10.6.5 Latin America Smart Advertising Market Estimates and Forecasts, By End Use (2020-2032) (USD Billion)
10.6.6 Brazil
10.6.6.1 Brazil Smart Advertising Market Estimates and Forecasts, By Component (2020-2032) (USD Billion)
10.6.6.2 Brazil Smart Advertising Market Estimates and Forecasts, By Product (2020-2032) (USD Billion)
10.6.6.3 Brazil Smart Advertising Market Estimates and Forecasts, By End Use (2020-2032) (USD Billion)
10.6.7 Argentina
10.6.7.1 Argentina Smart Advertising Market Estimates and Forecasts, By Component (2020-2032) (USD Billion)
10.6.7.2 Argentina Smart Advertising Market Estimates and Forecasts, By Product (2020-2032) (USD Billion)
10.6.7.3 Argentina Smart Advertising Market Estimates and Forecasts, By End Use (2020-2032) (USD Billion)
10.6.8 Colombia
10.6.8.1 Colombia Smart Advertising Market Estimates and Forecasts, By Component (2020-2032) (USD Billion)
10.6.8.2 Colombia Smart Advertising Market Estimates and Forecasts, By Product (2020-2032) (USD Billion)
10.6.8.3 Colombia Smart Advertising Market Estimates and Forecasts, By End Use (2020-2032) (USD Billion)
10.6.9 Rest of Latin America
10.6.9.1 Rest of Latin America Smart Advertising Market Estimates and Forecasts, By Component (2020-2032) (USD Billion)
10.6.9.2 Rest of Latin America Smart Advertising Market Estimates and Forecasts, By Product (2020-2032) (USD Billion)
10.6.9.3 Rest of Latin America Smart Advertising Market Estimates and Forecasts, By End Use (2020-2032) (USD Billion)
11. Company Profiles
11.1 Outfront Media, Inc
11.1.1 Company Overview
11.1.2 Financial
11.1.3 Products/ Services Offered
11.1.4 SWOT Analysis
11.2 JCDecaux Group.
11.2.1 Company Overview
11.2.2 Financial
11.2.3 Products/ Services Offered
11.2.4 SWOT Analysis
11.3 CIVIQ Smartscapes
11.3.1 Company Overview
11.3.2 Financial
11.3.3 Products/ Services Offered
11.3.4 SWOT Analysis
11.4 Captivate, LLC
11.4.1 Company Overview
11.4.2 Financial
11.4.3 Products/ Services Offered
11.4.4 SWOT Analysis
11.5 Intersection
11.5.1 Company Overview
11.5.2 Financial
11.5.3 Products/ Services Offered
11.5.4 SWOT Analysis
11.6 Exterion Media Limited
11.6.1 Company Overview
11.6.2 Financial
11.6.3 Products/ Services Offered
11.6.4 SWOT Analysis
11.7 Clear Channel Outdoor Holdings, Inc.
11.7.1 Company Overview
11.7.2 Financial
11.7.3 Products/ Services Offered
11.7.4 SWOT Analysis
11.8 Lamar Advertising Company
11.8.1 Company Overview
11.8.2 Financial
11.8.3 Products/ Services Offered
11.8.4 SWOT Analysis
11.9 IKE Smart City.
11.9.1 Company Overview
11.9.2 Financial
11.9.3 Products/ Services Offered
11.9.4 SWOT Analysis
11.10 Changing Environments, Inc.
11.10.1 Company Overview
11.10.2 Financial
11.10.3 Products/ Services Offered
11.10.4 SWOT Analysis
12. Use Cases and Best Practices
13. Conclusion
An accurate research report requires proper strategizing as well as implementation. There are multiple factors involved in the completion of good and accurate research report and selecting the best methodology to compete the research is the toughest part. Since the research reports we provide play a crucial role in any company’s decision-making process, therefore we at SNS Insider always believe that we should choose the best method which gives us results closer to reality. This allows us to reach at a stage wherein we can provide our clients best and accurate investment to output ratio.
Each report that we prepare takes a timeframe of 350-400 business hours for production. Starting from the selection of titles through a couple of in-depth brain storming session to the final QC process before uploading our titles on our website we dedicate around 350 working hours. The titles are selected based on their current market cap and the foreseen CAGR and growth.
The 5 steps process:
Step 1: Secondary Research:
Secondary Research or Desk Research is as the name suggests is a research process wherein, we collect data through the readily available information. In this process we use various paid and unpaid databases which our team has access to and gather data through the same. This includes examining of listed companies’ annual reports, Journals, SEC filling etc. Apart from this our team has access to various associations across the globe across different industries. Lastly, we have exchange relationships with various university as well as individual libraries.

Step 2: Primary Research
When we talk about primary research, it is a type of study in which the researchers collect relevant data samples directly, rather than relying on previously collected data. This type of research is focused on gaining content specific facts that can be sued to solve specific problems. Since the collected data is fresh and first hand therefore it makes the study more accurate and genuine.
We at SNS Insider have divided Primary Research into 2 parts.
Part 1 wherein we interview the KOLs of major players as well as the upcoming ones across various geographic regions. This allows us to have their view over the market scenario and acts as an important tool to come closer to the accurate market numbers. As many as 45 paid and unpaid primary interviews are taken from both the demand and supply side of the industry to make sure we land at an accurate judgement and analysis of the market.
This step involves the triangulation of data wherein our team analyses the interview transcripts, online survey responses and observation of on filed participants. The below mentioned chart should give a better understanding of the part 1 of the primary interview.

Part 2: In this part of primary research the data collected via secondary research and the part 1 of the primary research is validated with the interviews from individual consultants and subject matter experts.
Consultants are those set of people who have at least 12 years of experience and expertise within the industry whereas Subject Matter Experts are those with at least 15 years of experience behind their back within the same space. The data with the help of two main processes i.e., FGDs (Focused Group Discussions) and IDs (Individual Discussions). This gives us a 3rd party nonbiased primary view of the market scenario making it a more dependable one while collation of the data pointers.
Step 3: Data Bank Validation
Once all the information is collected via primary and secondary sources, we run that information for data validation. At our intelligence centre our research heads track a lot of information related to the market which includes the quarterly reports, the daily stock prices, and other relevant information. Our data bank server gets updated every fortnight and that is how the information which we collected using our primary and secondary information is revalidated in real time.

Step 4: QA/QC Process
After all the data collection and validation our team does a final level of quality check and quality assurance to get rid of any unwanted or undesired mistakes. This might include but not limited to getting rid of the any typos, duplication of numbers or missing of any important information. The people involved in this process include technical content writers, research heads and graphics people. Once this process is completed the title gets uploader on our platform for our clients to read it.
Step 5: Final QC/QA Process:
This is the last process and comes when the client has ordered the study. In this process a final QA/QC is done before the study is emailed to the client. Since we believe in giving our clients a good experience of our research studies, therefore, to make sure that we do not lack at our end in any way humanly possible we do a final round of quality check and then dispatch the study to the client.
By Component
Hardware
Software
Services
By Product
Interactive Kiosk
Digital Billboard
Digital Poster
Others
By End Use
Corporate
Government
Education
Food & Beverage
Others
Request for Segment Customization as per your Business Requirement: Segment Customization Request
Regional Coverage:
North America
US
Canada
Mexico
Europe
Eastern Europe
Poland
Romania
Hungary
Turkey
Rest of Eastern Europe
Western Europe
Germany
France
UK
Italy
Spain
Netherlands
Switzerland
Austria
Rest of Western Europe
Asia Pacific
China
India
Japan
South Korea
Vietnam
Singapore
Australia
Rest of Asia Pacific
Middle East & Africa
Middle East
UAE
Egypt
Saudi Arabia
Qatar
Rest of Middle East
Africa
Nigeria
South Africa
Rest of Africa
Latin America
Brazil
Argentina
Colombia
Rest of Latin America
Request for Country Level Research Report: Country Level Customization Request
Available Customization
With the given market data, SNS Insider offers customization as per the company’s specific needs. The following customization options are available for the report:
Detailed Volume Analysis
Criss-Cross segment analysis (e.g. Product X Application)
Competitive Product Benchmarking
Geographic Analysis
Additional countries in any of the regions
Customized Data Representation
Detailed analysis and profiling of additional market players
The Door and Window Automation Market was valued at USD 18.26 billion in 2023 and is projected to reach USD 30.07 billion by 2032, growing at a CAGR of 5.70% from 2024 to 2032.
The Stadium Lighting Market was valued at USD 584.73 million in 2023 and is expected to reach USD 1138.16 million by 2032, growing at a CAGR of 7.72% over the forecast period 2024-2032.
The InGaAs Photodiode Sensors Market Size was valued at USD 225 Million in 2023 and is expected to grow at 8.11% CAGR to reach USD 452.70 Million by 2032.
The Facial Recognition Market Size was valued at USD 6.2 Billion in 2023 and is expecting to grow at a CAGR of 15.91% to reach USD 23.4 Billion by 2032.
The Autonomous Underwater Vehicle (AUV) Market Size was valued at USD 3.12 Billion in 2023 and is expecting to grow at a CAGR 16.64% by Forecast 2024-2032.
The 8K technology market size was valued at USD 12.29 billion in 2023 and is expected to grow to USD 197.70 billion by 2032 and grow at a CAGR Of 36.2 % over the forecast period of 2024-2032.

Hi! Click one of our member below to chat on Phone
© 2025 All Rights Reserved by SNS Insider Pvt Ltd


