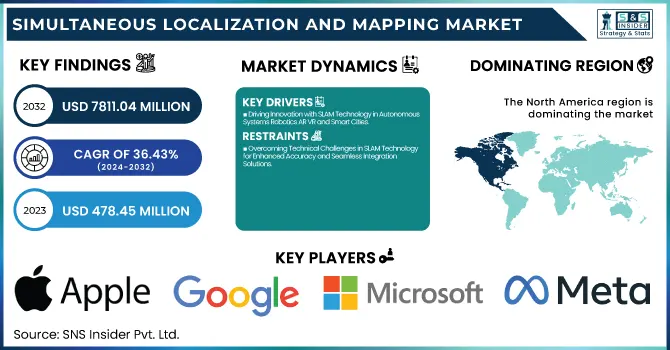
The Simultaneous Localization and Mapping Market Size was valued at USD 478.45 million in 2023 and is expected to reach USD 7811.04 million by 2032, growing at a CAGR of 36.43% over the forecast period 2024-2032. The Simultaneous Localization and Mapping (SLAM) market is largely gaining from technological advancements as well as increased demand across the industries. Strengthened robotics, self-governing machines, and expanded technological practice in AR diversify its use.
To Get more information on Simultaneous Localization and Mapping Market - Request Free Sample Report
Earth-on-satellite innovations such as AI-driven mapping algorithms, sensor fusion, and visual-inertial odometry help augment the accuracy and efficiency of these systems. Operational performance is improving due to accurate navigation allowing SLAM solutions to be deployed in dynamic environments. Furthermore, the growing complexity of data requires the real-time processing of increasingly powerful processors and cloud computing. This evolution drives the mass application of SLAM technology to different industries.
The U.S. SLAM market represented USD 136.29 million in 2023 and is anticipated to depict a 36.16% CAGR between 2024-2032. It is witnessing growth with rising adoption in autonomous vehicles, robotics, and AR/VR applications. The region's market growth is further propelled by robust investments in AI, IoT, and digital mapping solutions.
Key Drivers:
Driving Innovation with SLAM Technology in Autonomous Systems Robotics AR VR and Smart Cities
The growth of the Simultaneous Localization and Mapping (SLAM) market can be attributed to the increase in demand for autonomous systems such as autonomous drive cars, drones, delivery robots, etc. One of the major factors contributing to the market growth is the rising implementation of SLAM technology in robotics to automate warehouses, assist with healthcare, and perform certain manufacturing processes. Furthermore, Augmented Reality (AR) and Virtual Reality (VR) advancements boost SLAM utilization as it continues to advance spatial sensing and quality of user immersive experience. Increasing use of SLAM in smart cities in various applications such as urban planning and infrastructure expansion also drives market growth. Advancements in computer vision, AI algorithms, and sensor fusion are helping SLAM systems achieve higher accuracy, thus making them suitable for such dynamic environments.
Restrain:
Overcoming Technical Challenges in SLAM Technology for Enhanced Accuracy and Seamless Integration Solutions
Technical complexity and accuracy constraints are prominent challenges in the global Simultaneous localization and mapping (SLAM) market Even SLAM systems that boast impressive mapping performance can be terrible in certain environments with low light, moving obstacles, and textureless or complex surfaces leading to poor mapping accuracy. Algorithms that guarantee all data from the sensors to the cameras and the platforms we allow to process that data, all have real-time synchronicity this is ultimately a very computationally expensive task. On top of that, integrating SLAM solutions with existing robotic systems, augmenting reality/virtual reality platforms, and driverless cars may also require domain expertise, making it harder for low-tech companies.
Opportunity:
Emerging Opportunities in SLAM Technology Driven by 5G AI Digital Twins and Interactive Experiences
Trends such as 5G connectivity and edge computing are opening up new avenues for SLAM, such as faster data processing and real-time mapping. Industries such as agriculture, logistics, and defense are increasingly adopting AI-driven navigation systems, creating a million-dollar growth opportunity. Furthermore, growing investments in digital twin technology for industrial automation and smart factory management are likely to drive the demand for SLAM. Support of applications in areas such as retail, gamification, education, and others for better interactive experiences, also creates substantial opportunities for the market. There is a potential for lower-cost and scalable SLAM solutions in the future, following this many companies are going to invest in R&D to make this happen and companies who are going to create this will create a competitive advantage.
Challenges:
Addressing Data Security Operational Challenges and Reliability in SLAM Technology for Diverse Applications
A major challenge is data security and privacy, especially in applications mapping sensitive environments such as residential environments, workplaces, and public spaces. Operational challenges SLAM is usually complex to implement in large-scale environments such as smart cities or industrial facilities. Moreover, maintaining optimal performance by frequent calibration and upkeep of SLAM-based systems generates downtime, limiting their adoption in time-critical industries. Disclosure: This article is written by a content scientist for TraxCube and thus explains the technical challenges involved, the need for sensor fusion and cloud-based mapping solutions that can help overcome SLAM design flaws, and learning to make them more adaptable and reliable for a wide range of applications.
By Offering
The market for 2D SLAM accounted for the biggest share, at 56.6% in 2023, which can be attributed to the rising demand for 2D SLAM in applications such as robotics, warehouse automation, and indoor mapping. Its low cost, relative ease of implementation, and ability to map well in structured scenarios have allowed it to dominate the market. This makes 2D SLAM systems popular for applications that require high-accuracy navigation but low computational requirements, thus making their usage ideal for robots in retail, healthcare, and manufacturing industries.
The 3D SLAM segment is projected to have the largest CAGR from 2024-2032, due to the growing demand for 3D SLAM in autonomous cars, drones, and AR/VR applications. The most crucial difference, however, comes from 3D SLAM. 3D SLAM provides maps with depth perception, vital for complex and dynamic environments. The adoption of automation and immersive technologies across industries is likely to pave the way for more use of 3D SLAM, thereby facilitating innovation in all sectors.
By Type
EKF SLAM (Extended Kalman Filter SLAM) accounted for the largest market share of 36% during the year 2023 due to excellent performance in real-time navigation and localization tasks. Applications of EKF SLAM As a pioneer in SLAM, EKF SLAM is widely used in applications with continuous robot location estimation, especially mobile robots, drones, and industrial robot automation. The Kalman filter is a method for efficiently estimating linear systems as well as minimizing uncertainty in dynamic environments, making it popular in structured and semi-structured environments.
From 2024 to 2032, Graph-Based SLAM is anticipated to serve the segment with the highest CAGR due to the higher scalability and efficiency of other approaches for accurate large-scale mapping environments. As such, instead of addressing a single space of global pose, Graph-Based SLAM solves for a set of variables that serve as complex correspondences between sensor data, which allows for the effective handling of these data associations, making it attractive for applications in autonomous vehicles, smart city infrastructure, and outdoor mapping.
By Application
In 2023, Robotics commanded the largest share of the overall Simultaneous Localization and Mapping (SLAM) market, accounting for a 39.6% market share. Such dominance can be due to the growing use of SLAM technology in autonomous robots, warehouse automation, and service robots. In robotics applications, SLAM is vital for navigation, obstacle detection, and map rebuilding in real-time, especially when it comes to manufacturing, healthcare, and logistics. Robotics stood out among all technologies in the top position when it came to market demand, driven by the rising demand for smart automation solutions.
AR/VR is expected to register the highest CAGR from 2024 to 2032 Rapid adoption of immersive technologies in gaming, training simulations, and remote collaboration are other key drivers propelling demand for sophisticated SLAM solutions. By allowing accurate mapping of the physical environment, technology improves the spatial awareness of AR/VR experiences, thus ensuring that the objects placed in any real-world scenario feel more realistic. As AR/VR applications gain momentum in various verticals, SLAM technology is bound to be a key enabler for smoother and more engaging experiences.
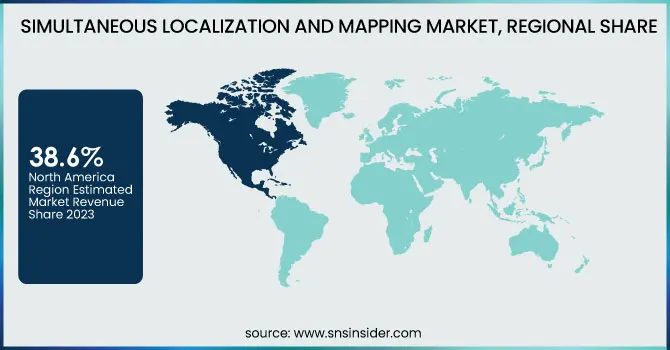
The simultaneous localization and mapping (SLAM) market was led by North America in 2023, and it held 38.6% of the global market. This leadership is powered by massive investments in autonomous vehicles, robotics, and industrial automation development. With autonomous systems leading companies such as Tesla, Waymo, and Boston Dynamics regularly incorporate the technology into their platforms for optimal navigation and obstacle avoidance. As an example, Full Self-Driving (FSD) by Tesla utilizes the ideas of SLAM in assisting with geo-location and route optimization. The U.S. defense is also the largest application segment driven by the proliferation of military robots and drone surveillance, which also supports the regional growth of robotic mapping SLAM.
Asia Pacific is anticipated to see the highest growth rate during 2024-2032 driven by the fast-paced development of smart Manufacturing, AR/VR, and Consumer Electronics. In China, companies like DJI are using SLAM technology to help drones remain stable and find a way in commercial and industrial applications. An example of this is SoftBank Robotics, which uses SLAM in its humanoid robot Pepper for indoor navigation and customer interaction in Japan. It is also seen that the region is ramping up investment in smart city projects and automated logistics that will further accelerate the adoption of SLAM. SLAM is likely to make an impact on the evolution of automation, security, and immersive experiences as Asia Pacific continues its progress in digital transformation strategies.
Get Customized Report as per Your Business Requirement - Enquiry Now
Some of the major players in the Simultaneous Localization and Mapping Market are:
Apple Inc. (ARKit)
Google LLC (ARCore)
Microsoft Corporation (Azure Spatial Anchors)
Meta Platforms, Inc. (Spark AR)
Amazon Web Services, Inc. (RoboMaker)
Intel Corporation (RealSense)
NVIDIA Corporation (Isaac SDK)
Qualcomm Technologies, Inc. (Snapdragon XR)
Magic Leap, Inc. (Magic Leap 2)
PTC Inc. (Vuforia Engine)
Maxar Technologies Inc. (Vricon)
Hexagon AB (Leica BLK2GO)
Ouster, Inc. (OS LiDAR)
SLAMcore Ltd. (SLAMcore SDK)
Cognex Corporation (In-Sight 3D-L4000)
In November 2024, Geek+ and Intel unveiled the world's first Vision-Only AMR, integrating Intel's Visual Navigation Modules to enhance logistics navigation with precise depth vision and obstacle avoidance capabilities.
| Report Attributes | Details |
|---|---|
| Market Size in 2023 | USD 478.45 Million |
| Market Size by 2032 | USD 7811.04 Million |
| CAGR | CAGR of 36.43% From 2024 to 2032 |
| Base Year | 2023 |
| Forecast Period | 2024-2032 |
| Historical Data | 2020-2022 |
| Report Scope & Coverage | Market Size, Segments Analysis, Competitive Landscape, Regional Analysis, DROC & SWOT Analysis, Forecast Outlook |
| Key Segments | • By Offering (2D SLAM, 3D SLAM) • By Type (EKF SLAM, Fast SLAM, Graph-Based SLAM, Others) • By Application (Robotics, UAV, AR/VR, Automotive, Other) |
| Regional Analysis/Coverage | North America (US, Canada, Mexico), Europe (Eastern Europe [Poland, Romania, Hungary, Turkey, Rest of Eastern Europe] Western Europe] Germany, France, UK, Italy, Spain, Netherlands, Switzerland, Austria, Rest of Western Europe]), Asia Pacific (China, India, Japan, South Korea, Vietnam, Singapore, Australia, Rest of Asia Pacific), Middle East & Africa (Middle East [UAE, Egypt, Saudi Arabia, Qatar, Rest of Middle East], Africa [Nigeria, South Africa, Rest of Africa], Latin America (Brazil, Argentina, Colombia, Rest of Latin America) |
| Company Profiles | Apple Inc., Google LLC, Microsoft Corporation, Meta Platforms, Inc., Amazon Web Services, Inc., Intel Corporation, NVIDIA Corporation, Qualcomm Technologies, Inc., Magic Leap, Inc., PTC Inc., Maxar Technologies Inc., Hexagon AB, Ouster, Inc., SLAMcore Ltd., Cognex Corporation. |
Ans: The Simultaneous Localization and Mapping Market is expected to grow at a CAGR of 36.43% during 2024-2032.
Ans: Simultaneous Localization and Mapping Market size was USD 478.45 million in 2023 and is expected to Reach USD 7811.04 million by 2032.
Ans: The major growth factor of the Simultaneous Localization and Mapping (SLAM) market is the rising adoption of autonomous systems, including robots, drones, and AR/VR devices, requiring real-time mapping and navigation solutions.
Ans: The 2D SLAM segment dominated the Simultaneous Localization and Mapping Market in 2023.
Ans: North America dominated the Simultaneous Localization and Mapping Market in 2023.
1. Introduction
1.1 Market Definition
1.2 Scope (Inclusion and Exclusions)
1.3 Research Assumptions
2. Executive Summary
2.1 Market Overview
2.2 Regional Synopsis
2.3 Competitive Summary
3. Research Methodology
3.1 Top-Down Approach
3.2 Bottom-up Approach
3.3. Data Validation
3.4 Primary Interviews
4. Market Dynamics Impact Analysis
4.1 Market Driving Factors Analysis
4.1.1 Drivers
4.1.2 Restraints
4.1.3 Opportunities
4.1.4 Challenges
4.2 PESTLE Analysis
4.3 Porter’s Five Forces Model
5. Statistical Insights and Trends Reporting
5.1 Adoption & Deployment
5.2 Technology & Innovation
5.3 Operational & Performance
5.4 Data & Computing
6. Competitive Landscape
6.1 List of Major Companies, By Region
6.2 Market Share Analysis, By Region
6.3 Product Benchmarking
6.3.1 Product specifications and features
6.3.2 Pricing
6.4 Strategic Initiatives
6.4.1 Marketing and Promotional Activities
6.4.2 Distribution and Supply Chain Strategies
6.4.3 Expansion plans and new product launches
6.4.4 Strategic partnerships and collaborations
6.5 Technological Advancements
6.6 Market Positioning and Branding
7. Simultaneous Localization and Mapping Market Segmentation, By Offering
7.1 Chapter Overview
7.2 2D SLAM
7.2.1 2D SLAM Market Trends Analysis (2020-2032)
7.2.2 2D SLAM Market Size Estimates and Forecasts to 2032 (USD Million)
7.3 3D SLAM
7.3.1 3D SLAM Market Trends Analysis (2020-2032)
7.3.2 3D SLAM Market Size Estimates and Forecasts to 2032 (USD Million)
8. Simultaneous Localization and Mapping Market Segmentation, By Type
8.1 Chapter Overview
8.2 EKF SLAM
8.2.1 EKF SLAM Market Trends Analysis (2020-2032)
8.2.2 EKF SLAM Market Size Estimates and Forecasts to 2032 (USD Million)
8.3 Fast SLAM
8.3.1 Fast SLAM Market Trends Analysis (2020-2032)
8.3.2 Fast SLAM Market Size Estimates and Forecasts to 2032 (USD Million)
8.4 Graph-Based SLAM
8.4.1 Graph-Based SLAM Market Trends Analysis (2020-2032)
8.4.2 Graph-Based SLAM Market Size Estimates and Forecasts to 2032 (USD Million)
8.5 Others
8.5.1 Others Market Trends Analysis (2020-2032)
8.5.2 Others Market Size Estimates and Forecasts to 2032 (USD Million)
9. Simultaneous Localization and Mapping Market Segmentation, By Application
9.1 Chapter Overview
9.2 Robotics
9.2.1 Robotics Market Trends Analysis (2020-2032)
9.2.2 Robotics Market Size Estimates and Forecasts to 2032 (USD Million)
9.3 UAV
9.3.1 UAV Market Trends Analysis (2020-2032)
9.3.2 UAV Market Size Estimates and Forecasts to 2032 (USD Million)
9.4 AR/VR
9.4.1 AR/VR Market Trends Analysis (2020-2032)
9.4.2 AR/VR Market Size Estimates and Forecasts to 2032 (USD Million)
9.5 Automotive
9.5.1 Automotive Market Trends Analysis (2020-2032)
9.5.2 Automotive Market Size Estimates and Forecasts to 2032 (USD Million)
9.6 Other
9.6.1 Other Market Trends Analysis (2020-2032)
9.6.2 Other Market Size Estimates and Forecasts to 2032 (USD Million)
10. Regional Analysis
10.1 Chapter Overview
10.2 North America
10.2.1 Trends Analysis
10.2.2 North America Simultaneous Localization and Mapping Market Estimates and Forecasts, by Country (2020-2032) (USD Million)
10.2.3 North America Simultaneous Localization and Mapping Market Estimates and Forecasts, By Offering (2020-2032) (USD Million)
10.2.4 North America Simultaneous Localization and Mapping Market Estimates and Forecasts, By Type (2020-2032) (USD Million)
10.2.5 North America Simultaneous Localization and Mapping Market Estimates and Forecasts, By Application (2020-2032) (USD Million)
10.2.6 USA
10.2.6.1 USA Simultaneous Localization and Mapping Market Estimates and Forecasts, By Offering (2020-2032) (USD Million)
10.2.6.2 USA Simultaneous Localization and Mapping Market Estimates and Forecasts, By Type (2020-2032) (USD Million)
10.2.6.3 USA Simultaneous Localization and Mapping Market Estimates and Forecasts, By Application (2020-2032) (USD Million)
10.2.7 Canada
10.2.7.1 Canada Simultaneous Localization and Mapping Market Estimates and Forecasts, By Offering (2020-2032) (USD Million)
10.2.7.2 Canada Simultaneous Localization and Mapping Market Estimates and Forecasts, By Type (2020-2032) (USD Million)
10.2.7.3 Canada Simultaneous Localization and Mapping Market Estimates and Forecasts, By Application (2020-2032) (USD Million)
10.2.8 Mexico
10.2.8.1 Mexico Simultaneous Localization and Mapping Market Estimates and Forecasts, By Offering (2020-2032) (USD Million)
10.2.8.2 Mexico Simultaneous Localization and Mapping Market Estimates and Forecasts, By Type (2020-2032) (USD Million)
10.2.8.3 Mexico Simultaneous Localization and Mapping Market Estimates and Forecasts, By Application (2020-2032) (USD Million)
10.3 Europe
10.3.1 Eastern Europe
10.3.1.1 Trends Analysis
10.3.1.2 Eastern Europe Simultaneous Localization and Mapping Market Estimates and Forecasts, by Country (2020-2032) (USD Million)
10.3.1.3 Eastern Europe Simultaneous Localization and Mapping Market Estimates and Forecasts, By Offering (2020-2032) (USD Million)
10.3.1.4 Eastern Europe Simultaneous Localization and Mapping Market Estimates and Forecasts, By Type (2020-2032) (USD Million)
10.3.1.5 Eastern Europe Simultaneous Localization and Mapping Market Estimates and Forecasts, By Application (2020-2032) (USD Million)
10.3.1.6 Poland
10.3.1.6.1 Poland Simultaneous Localization and Mapping Market Estimates and Forecasts, By Offering (2020-2032) (USD Million)
10.3.1.6.2 Poland Simultaneous Localization and Mapping Market Estimates and Forecasts, By Type (2020-2032) (USD Million)
10.3.1.6.3 Poland Simultaneous Localization and Mapping Market Estimates and Forecasts, By Application (2020-2032) (USD Million)
10.3.1.7 Romania
10.3.1.7.1 Romania Simultaneous Localization and Mapping Market Estimates and Forecasts, By Offering (2020-2032) (USD Million)
10.3.1.7.2 Romania Simultaneous Localization and Mapping Market Estimates and Forecasts, By Type (2020-2032) (USD Million)
10.3.1.7.3 Romania Simultaneous Localization and Mapping Market Estimates and Forecasts, By Application (2020-2032) (USD Million)
10.3.1.8 Hungary
10.3.1.8.1 Hungary Simultaneous Localization and Mapping Market Estimates and Forecasts, By Offering (2020-2032) (USD Million)
10.3.1.8.2 Hungary Simultaneous Localization and Mapping Market Estimates and Forecasts, By Type (2020-2032) (USD Million)
10.3.1.8.3 Hungary Simultaneous Localization and Mapping Market Estimates and Forecasts, By Application (2020-2032) (USD Million)
10.3.1.9 Turkey
10.3.1.9.1 Turkey Simultaneous Localization and Mapping Market Estimates and Forecasts, By Offering (2020-2032) (USD Million)
10.3.1.9.2 Turkey Simultaneous Localization and Mapping Market Estimates and Forecasts, By Type (2020-2032) (USD Million)
10.3.1.9.3 Turkey Simultaneous Localization and Mapping Market Estimates and Forecasts, By Application (2020-2032) (USD Million)
10.3.1.10 Rest of Eastern Europe
10.3.1.10.1 Rest of Eastern Europe Simultaneous Localization and Mapping Market Estimates and Forecasts, By Offering (2020-2032) (USD Million)
10.3.1.10.2 Rest of Eastern Europe Simultaneous Localization and Mapping Market Estimates and Forecasts, By Type (2020-2032) (USD Million)
10.3.1.10.3 Rest of Eastern Europe Simultaneous Localization and Mapping Market Estimates and Forecasts, By Application (2020-2032) (USD Million)
10.3.2 Western Europe
10.3.2.1 Trends Analysis
10.3.2.2 Western Europe Simultaneous Localization and Mapping Market Estimates and Forecasts, by Country (2020-2032) (USD Million)
10.3.2.3 Western Europe Simultaneous Localization and Mapping Market Estimates and Forecasts, By Offering (2020-2032) (USD Million)
10.3.2.4 Western Europe Simultaneous Localization and Mapping Market Estimates and Forecasts, By Type (2020-2032) (USD Million)
10.3.2.5 Western Europe Simultaneous Localization and Mapping Market Estimates and Forecasts, By Application (2020-2032) (USD Million)
10.3.2.6 Germany
10.3.2.6.1 Germany Simultaneous Localization and Mapping Market Estimates and Forecasts, By Offering (2020-2032) (USD Million)
10.3.2.6.2 Germany Simultaneous Localization and Mapping Market Estimates and Forecasts, By Type (2020-2032) (USD Million)
10.3.2.6.3 Germany Simultaneous Localization and Mapping Market Estimates and Forecasts, By Application (2020-2032) (USD Million)
10.3.2.7 France
10.3.2.7.1 France Simultaneous Localization and Mapping Market Estimates and Forecasts, By Offering (2020-2032) (USD Million)
10.3.2.7.2 France Simultaneous Localization and Mapping Market Estimates and Forecasts, By Type (2020-2032) (USD Million)
10.3.2.7.3 France Simultaneous Localization and Mapping Market Estimates and Forecasts, By Application (2020-2032) (USD Million)
10.3.2.8 UK
10.3.2.8.1 UK Simultaneous Localization and Mapping Market Estimates and Forecasts, By Offering (2020-2032) (USD Million)
10.3.2.8.2 UK Simultaneous Localization and Mapping Market Estimates and Forecasts, By Type (2020-2032) (USD Million)
10.3.2.8.3 UK Simultaneous Localization and Mapping Market Estimates and Forecasts, By Application (2020-2032) (USD Million)
10.3.2.9 Italy
10.3.2.9.1 Italy Simultaneous Localization and Mapping Market Estimates and Forecasts, By Offering (2020-2032) (USD Million)
10.3.2.9.2 Italy Simultaneous Localization and Mapping Market Estimates and Forecasts, By Type (2020-2032) (USD Million)
10.3.2.9.3 Italy Simultaneous Localization and Mapping Market Estimates and Forecasts, By Application (2020-2032) (USD Million)
10.3.2.10 Spain
10.3.2.10.1 Spain Simultaneous Localization and Mapping Market Estimates and Forecasts, By Offering (2020-2032) (USD Million)
10.3.2.10.2 Spain Simultaneous Localization and Mapping Market Estimates and Forecasts, By Type (2020-2032) (USD Million)
10.3.2.10.3 Spain Simultaneous Localization and Mapping Market Estimates and Forecasts, By Application (2020-2032) (USD Million)
10.3.2.11 Netherlands
10.3.2.11.1 Netherlands Simultaneous Localization and Mapping Market Estimates and Forecasts, By Offering (2020-2032) (USD Million)
10.3.2.11.2 Netherlands Simultaneous Localization and Mapping Market Estimates and Forecasts, By Type (2020-2032) (USD Million)
10.3.2.11.3 Netherlands Simultaneous Localization and Mapping Market Estimates and Forecasts, By Application (2020-2032) (USD Million)
10.3.2.12 Switzerland
10.3.2.12.1 Switzerland Simultaneous Localization and Mapping Market Estimates and Forecasts, By Offering (2020-2032) (USD Million)
10.3.2.12.2 Switzerland Simultaneous Localization and Mapping Market Estimates and Forecasts, By Type (2020-2032) (USD Million)
10.3.2.12.3 Switzerland Simultaneous Localization and Mapping Market Estimates and Forecasts, By Application (2020-2032) (USD Million)
10.3.2.13 Austria
10.3.2.13.1 Austria Simultaneous Localization and Mapping Market Estimates and Forecasts, By Offering (2020-2032) (USD Million)
10.3.2.13.2 Austria Simultaneous Localization and Mapping Market Estimates and Forecasts, By Type (2020-2032) (USD Million)
10.3.2.13.3 Austria Simultaneous Localization and Mapping Market Estimates and Forecasts, By Application (2020-2032) (USD Million)
10.3.2.14 Rest of Western Europe
10.3.2.14.1 Rest of Western Europe Simultaneous Localization and Mapping Market Estimates and Forecasts, By Offering (2020-2032) (USD Million)
10.3.2.14.2 Rest of Western Europe Simultaneous Localization and Mapping Market Estimates and Forecasts, By Type (2020-2032) (USD Million)
10.3.2.14.3 Rest of Western Europe Simultaneous Localization and Mapping Market Estimates and Forecasts, By Application (2020-2032) (USD Million)
10.4 Asia Pacific
10.4.1 Trends Analysis
10.4.2 Asia Pacific Simultaneous Localization and Mapping Market Estimates and Forecasts, by Country (2020-2032) (USD Million)
10.4.3 Asia Pacific Simultaneous Localization and Mapping Market Estimates and Forecasts, By Offering (2020-2032) (USD Million)
10.4.4 Asia Pacific Simultaneous Localization and Mapping Market Estimates and Forecasts, By Type (2020-2032) (USD Million)
10.4.5 Asia Pacific Simultaneous Localization and Mapping Market Estimates and Forecasts, By Application (2020-2032) (USD Million)
10.4.6 China
10.4.6.1 China Simultaneous Localization and Mapping Market Estimates and Forecasts, By Offering (2020-2032) (USD Million)
10.4.6.2 China Simultaneous Localization and Mapping Market Estimates and Forecasts, By Type (2020-2032) (USD Million)
10.4.6.3 China Simultaneous Localization and Mapping Market Estimates and Forecasts, By Application (2020-2032) (USD Million)
10.4.7 India
10.4.7.1 India Simultaneous Localization and Mapping Market Estimates and Forecasts, By Offering (2020-2032) (USD Million)
10.4.7.2 India Simultaneous Localization and Mapping Market Estimates and Forecasts, By Type (2020-2032) (USD Million)
10.4.7.3 India Simultaneous Localization and Mapping Market Estimates and Forecasts, By Application (2020-2032) (USD Million)
10.4.8 Japan
10.4.8.1 Japan Simultaneous Localization and Mapping Market Estimates and Forecasts, By Offering (2020-2032) (USD Million)
10.4.8.2 Japan Simultaneous Localization and Mapping Market Estimates and Forecasts, By Type (2020-2032) (USD Million)
10.4.8.3 Japan Simultaneous Localization and Mapping Market Estimates and Forecasts, By Application (2020-2032) (USD Million)
10.4.9 South Korea
10.4.9.1 South Korea Simultaneous Localization and Mapping Market Estimates and Forecasts, By Offering (2020-2032) (USD Million)
10.4.9.2 South Korea Simultaneous Localization and Mapping Market Estimates and Forecasts, By Type (2020-2032) (USD Million)
10.4.9.3 South Korea Simultaneous Localization and Mapping Market Estimates and Forecasts, By Application (2020-2032) (USD Million)
10.4.10 Vietnam
10.4.10.1 Vietnam Simultaneous Localization and Mapping Market Estimates and Forecasts, By Offering (2020-2032) (USD Million)
10.4.10.2 Vietnam Simultaneous Localization and Mapping Market Estimates and Forecasts, By Type (2020-2032) (USD Million)
10.4.10.3 Vietnam Simultaneous Localization and Mapping Market Estimates and Forecasts, By Application (2020-2032) (USD Million)
10.4.11 Singapore
10.4.11.1 Singapore Simultaneous Localization and Mapping Market Estimates and Forecasts, By Offering (2020-2032) (USD Million)
10.4.11.2 Singapore Simultaneous Localization and Mapping Market Estimates and Forecasts, By Type (2020-2032) (USD Million)
10.4.11.3 Singapore Simultaneous Localization and Mapping Market Estimates and Forecasts, By Application (2020-2032) (USD Million)
10.4.12 Australia
10.4.12.1 Australia Simultaneous Localization and Mapping Market Estimates and Forecasts, By Offering (2020-2032) (USD Million)
10.4.12.2 Australia Simultaneous Localization and Mapping Market Estimates and Forecasts, By Type (2020-2032) (USD Million)
10.4.12.3 Australia Simultaneous Localization and Mapping Market Estimates and Forecasts, By Application (2020-2032) (USD Million)
10.4.13 Rest of Asia Pacific
10.4.13.1 Rest of Asia Pacific Simultaneous Localization and Mapping Market Estimates and Forecasts, By Offering (2020-2032) (USD Million)
10.4.13.2 Rest of Asia Pacific Simultaneous Localization and Mapping Market Estimates and Forecasts, By Type (2020-2032) (USD Million)
10.4.13.3 Rest of Asia Pacific Simultaneous Localization and Mapping Market Estimates and Forecasts, By Application (2020-2032) (USD Million)
10.5 Middle East and Africa
10.5.1 Middle East
10.5.1.1 Trends Analysis
10.5.1.2 Middle East Simultaneous Localization and Mapping Market Estimates and Forecasts, by Country (2020-2032) (USD Million)
10.5.1.3 Middle East Simultaneous Localization and Mapping Market Estimates and Forecasts, By Offering (2020-2032) (USD Million)
10.5.1.4 Middle East Simultaneous Localization and Mapping Market Estimates and Forecasts, By Type (2020-2032) (USD Million)
10.5.1.5 Middle East Simultaneous Localization and Mapping Market Estimates and Forecasts, By Application (2020-2032) (USD Million)
10.5.1.6 UAE
10.5.1.6.1 UAE Simultaneous Localization and Mapping Market Estimates and Forecasts, By Offering (2020-2032) (USD Million)
10.5.1.6.2 UAE Simultaneous Localization and Mapping Market Estimates and Forecasts, By Type (2020-2032) (USD Million)
10.5.1.6.3 UAE Simultaneous Localization and Mapping Market Estimates and Forecasts, By Application (2020-2032) (USD Million)
10.5.1.7 Egypt
10.5.1.7.1 Egypt Simultaneous Localization and Mapping Market Estimates and Forecasts, By Offering (2020-2032) (USD Million)
10.5.1.7.2 Egypt Simultaneous Localization and Mapping Market Estimates and Forecasts, By Type (2020-2032) (USD Million)
10.5.1.7.3 Egypt Simultaneous Localization and Mapping Market Estimates and Forecasts, By Application (2020-2032) (USD Million)
10.5.1.8 Saudi Arabia
10.5.1.8.1 Saudi Arabia Simultaneous Localization and Mapping Market Estimates and Forecasts, By Offering (2020-2032) (USD Million)
10.5.1.8.2 Saudi Arabia Simultaneous Localization and Mapping Market Estimates and Forecasts, By Type (2020-2032) (USD Million)
10.5.1.8.3 Saudi Arabia Simultaneous Localization and Mapping Market Estimates and Forecasts, By Application (2020-2032) (USD Million)
10.5.1.9 Qatar
10.5.1.9.1 Qatar Simultaneous Localization and Mapping Market Estimates and Forecasts, By Offering (2020-2032) (USD Million)
10.5.1.9.2 Qatar Simultaneous Localization and Mapping Market Estimates and Forecasts, By Type (2020-2032) (USD Million)
10.5.1.9.3 Qatar Simultaneous Localization and Mapping Market Estimates and Forecasts, By Application (2020-2032) (USD Million)
10.5.1.10 Rest of Middle East
10.5.1.10.1 Rest of Middle East Simultaneous Localization and Mapping Market Estimates and Forecasts, By Offering (2020-2032) (USD Million)
10.5.1.10.2 Rest of Middle East Simultaneous Localization and Mapping Market Estimates and Forecasts, By Type (2020-2032) (USD Million)
10.5.1.10.3 Rest of Middle East Simultaneous Localization and Mapping Market Estimates and Forecasts, By Application (2020-2032) (USD Million)
10.5.2 Africa
10.5.2.1 Trends Analysis
10.5.2.2 Africa Simultaneous Localization and Mapping Market Estimates and Forecasts, by Country (2020-2032) (USD Million)
10.5.2.3 Africa Simultaneous Localization and Mapping Market Estimates and Forecasts, By Offering (2020-2032) (USD Million)
10.5.2.4 Africa Simultaneous Localization and Mapping Market Estimates and Forecasts, By Type (2020-2032) (USD Million)
10.5.2.5 Africa Simultaneous Localization and Mapping Market Estimates and Forecasts, By Application (2020-2032) (USD Million)
10.5.2.6 South Africa
10.5.2.6.1 South Africa Simultaneous Localization and Mapping Market Estimates and Forecasts, By Offering (2020-2032) (USD Million)
10.5.2.6.2 South Africa Simultaneous Localization and Mapping Market Estimates and Forecasts, By Type (2020-2032) (USD Million)
10.5.2.6.3 South Africa Simultaneous Localization and Mapping Market Estimates and Forecasts, By Application (2020-2032) (USD Million)
10.5.2.7 Nigeria
10.5.2.7.1 Nigeria Simultaneous Localization and Mapping Market Estimates and Forecasts, By Offering (2020-2032) (USD Million)
10.5.2.7.2 Nigeria Simultaneous Localization and Mapping Market Estimates and Forecasts, By Type (2020-2032) (USD Million)
10.5.2.7.3 Nigeria Simultaneous Localization and Mapping Market Estimates and Forecasts, By Application (2020-2032) (USD Million)
10.5.2.8 Rest of Africa
10.5.2.8.1 Rest of Africa Simultaneous Localization and Mapping Market Estimates and Forecasts, By Offering (2020-2032) (USD Million)
10.5.2.8.2 Rest of Africa Simultaneous Localization and Mapping Market Estimates and Forecasts, By Type (2020-2032) (USD Million)
10.5.2.8.3 Rest of Africa Simultaneous Localization and Mapping Market Estimates and Forecasts, By Application (2020-2032) (USD Million)
10.6 Latin America
10.6.1 Trends Analysis
10.6.2 Latin America Simultaneous Localization and Mapping Market Estimates and Forecasts, by Country (2020-2032) (USD Million)
10.6.3 Latin America Simultaneous Localization and Mapping Market Estimates and Forecasts, By Offering (2020-2032) (USD Million)
10.6.4 Latin America Simultaneous Localization and Mapping Market Estimates and Forecasts, By Type (2020-2032) (USD Million)
10.6.5 Latin America Simultaneous Localization and Mapping Market Estimates and Forecasts, By Application (2020-2032) (USD Million)
10.6.6 Brazil
10.6.6.1 Brazil Simultaneous Localization and Mapping Market Estimates and Forecasts, By Offering (2020-2032) (USD Million)
10.6.6.2 Brazil Simultaneous Localization and Mapping Market Estimates and Forecasts, By Type (2020-2032) (USD Million)
10.6.6.3 Brazil Simultaneous Localization and Mapping Market Estimates and Forecasts, By Application (2020-2032) (USD Million)
10.6.7 Argentina
10.6.7.1 Argentina Simultaneous Localization and Mapping Market Estimates and Forecasts, By Offering (2020-2032) (USD Million)
10.6.7.2 Argentina Simultaneous Localization and Mapping Market Estimates and Forecasts, By Type (2020-2032) (USD Million)
10.6.7.3 Argentina Simultaneous Localization and Mapping Market Estimates and Forecasts, By Application (2020-2032) (USD Million)
10.6.8 Colombia
10.6.8.1 Colombia Simultaneous Localization and Mapping Market Estimates and Forecasts, By Offering (2020-2032) (USD Million)
10.6.8.2 Colombia Simultaneous Localization and Mapping Market Estimates and Forecasts, By Type (2020-2032) (USD Million)
10.6.8.3 Colombia Simultaneous Localization and Mapping Market Estimates and Forecasts, By Application (2020-2032) (USD Million)
10.6.9 Rest of Latin America
10.6.9.1 Rest of Latin America Simultaneous Localization and Mapping Market Estimates and Forecasts, By Offering (2020-2032) (USD Million)
10.6.9.2 Rest of Latin America Simultaneous Localization and Mapping Market Estimates and Forecasts, By Type (2020-2032) (USD Million)
10.6.9.3 Rest of Latin America Simultaneous Localization and Mapping Market Estimates and Forecasts, By Application (2020-2032) (USD Million)
11. Company Profiles
11.1 Apple Inc
11.1.1 Company Overview
11.1.2 Financial
11.1.3 Products/ Services Offered
11.1.4 SWOT Analysis
11.2 Google LLC.
11.2.1 Company Overview
11.2.2 Financial
11.2.3 Products/ Services Offered
11.2.4 SWOT Analysis
11.3 Microsoft Corporation
11.3.1 Company Overview
11.3.2 Financial
11.3.3 Products/ Services Offered
11.3.4 SWOT Analysis
11.4 Meta Platforms, Inc.
11.4.1 Company Overview
11.4.2 Financial
11.4.3 Products/ Services Offered
11.4.4 SWOT Analysis
11.5 Amazon Web Services, Inc
11.5.1 Company Overview
11.5.2 Financial
11.5.3 Products/ Services Offered
11.5.4 SWOT Analysis
11.6 Intel Corporation
11.6.1 Company Overview
11.6.2 Financial
11.6.3 Products/ Services Offered
11.6.4 SWOT Analysis
11.7 NVIDIA Corporation.
11.7.1 Company Overview
11.7.2 Financial
11.7.3 Products/ Services Offered
11.7.4 SWOT Analysis
11.8 Qualcomm Technologies
11.8.1 Company Overview
11.8.2 Financial
11.8.3 Products/ Services Offered
11.8.4 SWOT Analysis
11.9 Magic Leap, Inc.
11.9.1 Company Overview
11.9.2 Financial
11.9.3 Products/ Services Offered
11.9.4 SWOT Analysis
11.10 PTC Inc.
11.10.1 Company Overview
11.10.2 Financial
11.10.3 Products/ Services Offered
11.10.4 SWOT Analysis
12. Use Cases and Best Practices
13. Conclusion
An accurate research report requires proper strategizing as well as implementation. There are multiple factors involved in the completion of good and accurate research report and selecting the best methodology to compete the research is the toughest part. Since the research reports we provide play a crucial role in any company’s decision-making process, therefore we at SNS Insider always believe that we should choose the best method which gives us results closer to reality. This allows us to reach at a stage wherein we can provide our clients best and accurate investment to output ratio.
Each report that we prepare takes a timeframe of 350-400 business hours for production. Starting from the selection of titles through a couple of in-depth brain storming session to the final QC process before uploading our titles on our website we dedicate around 350 working hours. The titles are selected based on their current market cap and the foreseen CAGR and growth.
The 5 steps process:
Step 1: Secondary Research:
Secondary Research or Desk Research is as the name suggests is a research process wherein, we collect data through the readily available information. In this process we use various paid and unpaid databases which our team has access to and gather data through the same. This includes examining of listed companies’ annual reports, Journals, SEC filling etc. Apart from this our team has access to various associations across the globe across different industries. Lastly, we have exchange relationships with various university as well as individual libraries.

Step 2: Primary Research
When we talk about primary research, it is a type of study in which the researchers collect relevant data samples directly, rather than relying on previously collected data. This type of research is focused on gaining content specific facts that can be sued to solve specific problems. Since the collected data is fresh and first hand therefore it makes the study more accurate and genuine.
We at SNS Insider have divided Primary Research into 2 parts.
Part 1 wherein we interview the KOLs of major players as well as the upcoming ones across various geographic regions. This allows us to have their view over the market scenario and acts as an important tool to come closer to the accurate market numbers. As many as 45 paid and unpaid primary interviews are taken from both the demand and supply side of the industry to make sure we land at an accurate judgement and analysis of the market.
This step involves the triangulation of data wherein our team analyses the interview transcripts, online survey responses and observation of on filed participants. The below mentioned chart should give a better understanding of the part 1 of the primary interview.

Part 2: In this part of primary research the data collected via secondary research and the part 1 of the primary research is validated with the interviews from individual consultants and subject matter experts.
Consultants are those set of people who have at least 12 years of experience and expertise within the industry whereas Subject Matter Experts are those with at least 15 years of experience behind their back within the same space. The data with the help of two main processes i.e., FGDs (Focused Group Discussions) and IDs (Individual Discussions). This gives us a 3rd party nonbiased primary view of the market scenario making it a more dependable one while collation of the data pointers.
Step 3: Data Bank Validation
Once all the information is collected via primary and secondary sources, we run that information for data validation. At our intelligence centre our research heads track a lot of information related to the market which includes the quarterly reports, the daily stock prices, and other relevant information. Our data bank server gets updated every fortnight and that is how the information which we collected using our primary and secondary information is revalidated in real time.

Step 4: QA/QC Process
After all the data collection and validation our team does a final level of quality check and quality assurance to get rid of any unwanted or undesired mistakes. This might include but not limited to getting rid of the any typos, duplication of numbers or missing of any important information. The people involved in this process include technical content writers, research heads and graphics people. Once this process is completed the title gets uploader on our platform for our clients to read it.
Step 5: Final QC/QA Process:
This is the last process and comes when the client has ordered the study. In this process a final QA/QC is done before the study is emailed to the client. Since we believe in giving our clients a good experience of our research studies, therefore, to make sure that we do not lack at our end in any way humanly possible we do a final round of quality check and then dispatch the study to the client.
By Offering
2D SLAM
3D SLAM
By Type
EKF SLAM
Fast SLAM
Graph-Based SLAM
Others
By Application
Robotics
UAV
AR/VR
Automotive
Other
Request for Segment Customization as per your Business Requirement: Segment Customization Request
Regional Coverage:
North America
US
Canada
Mexico
Europe
Eastern Europe
Poland
Romania
Hungary
Turkey
Rest of Eastern Europe
Western Europe
Germany
France
UK
Italy
Spain
Netherlands
Switzerland
Austria
Rest of Western Europe
Asia Pacific
China
India
Japan
South Korea
Vietnam
Singapore
Australia
Rest of Asia Pacific
Middle East & Africa
Middle East
UAE
Egypt
Saudi Arabia
Qatar
Rest of Middle East
Africa
Nigeria
South Africa
Rest of Africa
Latin America
Brazil
Argentina
Colombia
Rest of Latin America
Request for Country Level Research Report: Country Level Customization Request
Available Customization
With the given market data, SNS Insider offers customization as per the company’s specific needs. The following customization options are available for the report:
Detailed Volume Analysis
Criss-Cross segment analysis (e.g. Product X Application)
Competitive Product Benchmarking
Geographic Analysis
Additional countries in any of the regions
Customized Data Representation
Detailed analysis and profiling of additional market players
The Industrial PC Market Size was USD 5.5 Billion in 2023 and is expected to reach USD 9.4 Billion by 2032 and grow at a CAGR of 5.9% by 2024-2032.
The Regenerative Agriculture Market Size was valued at USD 7.53 Billion in 2023 and is expected to grow at 14.3% CAGR to reach USD 25.03 Billion by 2032.
The IGBT & Thyristor Market Size was valued at USD 6.19 billion in 2023 and is expected to reach USD 8.72 billion by 2032 and grow at a CAGR of 3.97% over the forecast period 2024-2032.
The Underfloor Heating Market Size was valued at $4.8 billion in 2023 and is expected to reach $9.7 billion by 2032 & grow at a CAGR of 8.2 % by 2024-2032.
The Quantum Sensors Market was valued at USD 567.48 million in 2023 and is expected to reach USD 1592.42 million by 2032, growing at a CAGR of 12.18% over the forecast period 2024-2032.
The Automotive Low Voltage Drives Market was valued at USD 2.80 billion in 2023 and is expected to reach USD 4.05 billion by 2032, growing at a CAGR of 4.20% over the forecast period 2024-2032.

Hi! Click one of our member below to chat on Phone
© 2025 All Rights Reserved by SNS Insider Pvt Ltd


