image

Shock Sensor Market Report & Overview:

Shock Sensor Market Revenue Analysis

Get more information on Shock Sensor Market - Request Free Sample Report

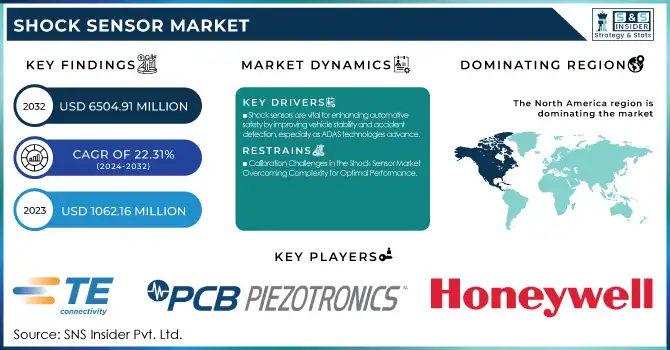
The Shock Sensor Market Size was valued at USD 1062.16 Million in 2023 and is expected to reach USD 6504.91 Million by 2032 and grow at a CAGR of 22.31% over the forecast period 2024-2032.

The shock sensor market is experiencing rapid growth within the automotive sector, primarily driven by increasing demands for safety, enhanced performance, and advancements in autonomous driving technologies. These sensors are crucial for applications like vehicle stability control, crash detection, and suspension monitoring, providing real-time optimization of vehicle performance. As embedded systems and ADAS technologies integrate, the demand for shock sensors grows, especially with the surge in electric vehicles and smart mobility. These sensors improve vehicle safety and response in high-impact scenarios, promoting safer and more efficient automotive systems. Additionally, across industries like construction and manufacturing, sensors have proven effective in boosting productivity, reducing energy consumption, and advancing environmental sustainability. For example, sensors have helped optimize energy consumption in lighting and HVAC systems, leading to savings of up to 47% in lighting and 30% in HVAC, while supporting waste reduction and environmental monitoring. As industries adopt smart technology and automation, sensors play a crucial role in driving innovation, enhancing data acquisition, optimizing processes, and improving operational efficiency, ultimately revolutionizing various sectors.

Market Dynamics

Drivers

  • Shock sensors are vital for enhancing automotive safety by improving vehicle stability and accident detection, especially as ADAS technologies advance.

The shock sensor market is benefiting from the growing focus on road safety, with the automotive sector increasingly integrating sensors to enhance vehicle safety systems. As part of efforts to reduce traffic fatalities and improve accident detection, shock sensors are essential in systems such as crash detection and vehicle stability control. The rise of advanced safety features, including those in autonomous vehicles, is boosting demand for these sensors. Studies have shown that advancements in automotive sensor technology are leading to more reliable detection of extreme driving conditions, enabling real-time data capture and enhanced response to potential hazards. The automotive industry's drive for smarter safety technologies such as in-cabin sensing solutions and collision avoidance systems further accelerates the adoption of shock sensors in both conventional and electric vehicles, aligning with ongoing efforts to prevent accidents and improve overall vehicle safety.

Restraints

  • Calibration Challenges in the Shock Sensor Market Overcoming Complexity for Optimal Performance

Shock sensors, especially in high-precision applications like automotive safety systems, require meticulous calibration to measure impact forces accurately and consistently. This process involves specialized equipment and techniques, such as shock exciters and accelerometer calibration systems, which add both time and cost. Additionally, the need for recalibration in varying environmental conditions further complicates the process, making it an ongoing challenge for manufacturers. These calibration complexities can lead to higher costs and potentially slow adoption in industries where affordability is a key consideration. Moreover, the performance of shock sensors may degrade over time, requiring frequent recalibration to maintain optimal functionality, especially in demanding environments. Therefore, overcoming these calibration challenges is critical to reducing costs and enhancing the long-term reliability of shock sensors across various industries.

Segment Analysis

By Type

The Piezoelectric segment is a dominant player in the shock sensor market, holding approximately 30% of the market share in 2023. Advancements in materials and manufacturing techniques, improving sensor sensitivity and accuracy. The development of new piezoelectric materials, such as composites and nanomaterials, has enhanced sensor performance, allowing for greater durability and higher precision. Innovations in miniaturization and integration with other sensing technologies have expanded their applications across industries. In automotive systems, piezoelectric shock sensors are increasingly integrated into Advanced Driver Assistance Systems (ADAS), offering real-time data to optimize vehicle safety features. Additionally, the growing demand for shock sensors in industrial applications, such as machinery monitoring and robotics, further contributes to the segment's development. As piezoelectric technology continues to evolve, it is expected to maintain its leading position in the market due to its versatility and high-performance capabilities.

By End Use

The automotive segment holds the largest share in the shock sensor market, accounting for around 35% of revenue in 2023. This dominance is attributed to the increasing demand for advanced safety features and performance optimization in vehicles. Shock sensors play a critical role in vehicle stability control, crash detection, suspension systems, and real-time data collection for driver assistance systems like ADAS. As the automotive industry shifts towards electric vehicles (EVs) and autonomous driving, the need for high-performance shock sensors continues to rise. Additionally, innovations in sensor technologies and the integration of shock sensors into smart mobility solutions further contribute to the segment's growth. The automotive sector's commitment to improving safety standards and overall vehicle performance drives substantial investment in shock sensor technology.


Shock-Sensor-Market-by-End-Use

Get Customized Report as per your Business Requirement - Request For Customized Report

Regional Analysis

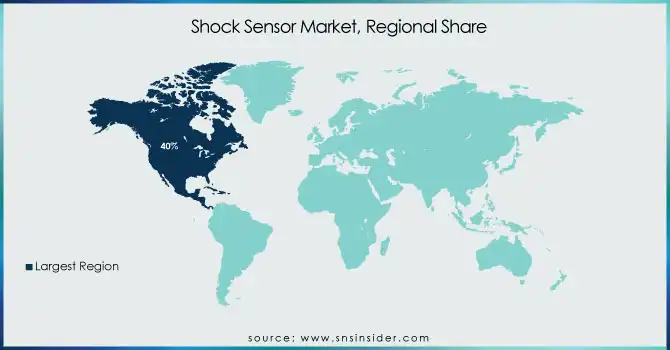
North America dominates the shock sensor market, accounting for approximately 40% of the global share in 2023. This leadership is driven by the region's strong automotive industry, particularly in the U.S., where advanced driver-assistance systems (ADAS) and electric vehicle (EV) development are rapidly expanding. The demand for high-performance shock sensors is also fueled by stringent safety regulations and the adoption of smart technologies in both commercial and consumer vehicles. Moreover, significant advancements in sensor technology and R&D investments in the U.S. continue to foster growth. Additionally, Canada's automotive sector contributes to the market's strength, with innovations in sensor integration for enhanced vehicle stability and crash detection systems. North America's dominance is also supported by the presence of major manufacturers, making it a key hub for shock sensor market growth.

The Asia-Pacific region is the fastest-growing market for shock sensors, with significant growth projected from 2024 to 2032. This growth is driven by the booming automotive industry, particularly in China, Japan, and South Korea, where advancements in vehicle safety and the adoption of electric vehicles (EVs) are rapidly accelerating. The rising demand for advanced driver-assistance systems (ADAS) and enhanced safety features has further fueled the need for shock sensors. Additionally, the expanding industrial sector in countries like India and China is contributing to the increasing demand for sensors in manufacturing processes. The region’s robust technological innovations and cost-effective production methods also position it as a key player in the global shock sensor market, making it an essential market for future growth.

Shock-Sensor-Market-By-Region

Key Players

Some of the major players in Shock Sensor Market Along with their product:

  • TE Connectivity (Piezoelectric Sensors, Strain Gage Sensors)

  • PCB Piezotronics, Inc. (Piezoelectric Shock Sensors, Accelerometers)

  • Honeywell International Inc. (MEMS Shock Sensors, Vibration Sensors)

  • DYTRAN INSTRUMENTS INCORPORATED (Piezoelectric Accelerometers, Shock Sensors)

  • Murata Manufacturing Co., Ltd. (Capacitive Sensors, MEMS Sensors)

  • Mobitron AB (Shock and Vibration Sensors, Monitoring Systems)

  • Meggitt PLC (Industrial Vibration Sensors, Shock and Impact Sensors)

  • SpotSee (Shockwatch, Drop Tag Sensors)

  • SignalQuest, LLC (Wireless Shock Sensors, Vibration Monitoring Systems)

  • Climax Technology Co., Ltd. (Wireless Shock Sensors, Alarm Sensors)

  • Kistler Instrumente AG (Piezoelectric Pressure and Shock Sensors)

  • Sensonor AS (MEMS Vibration Sensors, Accelerometers)

  • Bruel & Kjaer (B&K) (Shock and Vibration Sensors, Sound and Vibration Measurement)

  • Hansford Sensors Ltd. (Industrial Vibration and Shock Sensors)

  • Applied Measurements Ltd. (Strain Gage and Shock Sensors)

  • R&D Instrumentation, Inc. (Shock and Vibration Measurement Sensors)

  • Vibrant Technology, Inc. (Shock Sensors, Vibration Test Systems)

  • National Instruments (Vibration and Shock Monitoring Sensors)

  • DynaTronic Systems, Inc. (Vibration and Shock Detection Systems)

  • Accelerometer Technology, Inc. (Shock and Vibration Sensors, Data Acquisition Systems)

Lit of Suppliers who supplies raw material and component for the Shock Sensor Market:

  • 3M

  • Dow Inc.

  • DuPont

  • BASF

  • Henkel AG & Co. KGaA

  • Kyocera Corporation

  • Murata Manufacturing Co., Ltd.

  • Texas Instruments

  • STMicroelectronics

  • Vishay Intertechnology

Recent Development

  • February 2024 – PCB Piezotronics has launched the Endevco Model 7330 triaxial angular rate sensor, designed for measuring rotational velocity in extreme environments like automotive testing. With full-scale angular rate ranges from ±100 to ±18,000 deg/sec, it provides a ±2V voltage output, making it suitable for automotive rollover, safety testing, and applications in sports, helmet, and aerospace testing

Recent Trends

  • December 16, 2024 – NASA is preparing to test a shock-sensing probe for its X-59 supersonic aircraft. The cone-shaped probe, designed to measure sonic thumps, will capture precise pressure data during supersonic flights, with versions optimized for near-field and mid-field measurements. This test is part of ongoing efforts to reduce noise levels from supersonic flight.

  • Casio launched the G-Shock Move DWH5600MB1A4 and DWH5600MB8A9 in the US on November 11, 2024. These multi-sport watches feature heart rate monitoring, blood oxygen tracking, and Strava compatibility, with a 35-hour battery life and solar charging. The DWH5600MB1A4 has a black resin casing, while the DWH5600MB8A9 is light gray. The watches retail for USD 320, slightly higher than previous models.

Shock Sensor Market Report Scope:

Report Attributes Details
Market Size in 2023 USD 1062.16 Billion
Market Size by 2032 USD 6504.91 Million
CAGR CAGR of 22.31% From 2024 to 2032
Base Year 2023
Forecast Period 2024-2032
Historical Data 2020-2022
Report Scope & Coverage Market Size, Segments Analysis, Competitive  Landscape, Regional Analysis, DROC & SWOT Analysis, Forecast Outlook
Key Segments • By Type (Piezoelectric, Piezoresistive, Capacitors, Strain Gaze, Others)
• By End Use (Automotive, Aerospace, Industrial, Consumer Electronics, Others)
Regional Analysis/Coverage North America (US, Canada, Mexico), Europe (Eastern Europe [Poland, Romania, Hungary, Turkey, Rest of Eastern Europe] Western Europe] Germany, France, UK, Italy, Spain, Netherlands, Switzerland, Austria, Rest of Western Europe]), Asia Pacific (China, India, Japan, South Korea, Vietnam, Singapore, Australia, Rest of Asia Pacific), Middle East & Africa (Middle East [UAE, Egypt, Saudi Arabia, Qatar, Rest of Middle East], Africa [Nigeria, South Africa, Rest of Africa], Latin America (Brazil, Argentina, Colombia, Rest of Latin America)
Company Profiles TE Connectivity, PCB Piezotronics, Inc., Honeywell International Inc., DYTRAN INSTRUMENTS INCORPORATED, Murata Manufacturing Co., Ltd., Mobitron AB, Meggitt PLC, SpotSee, SignalQuest, LLC, Climax Technology Co., Ltd., Kistler Instrumente AG, Sensonor AS, Bruel & Kjaer (B&K), Hansford Sensors Ltd., Applied Measurements Ltd., R&D Instrumentation, Inc., Vibrant Technology, Inc., National Instruments, DynaTronic Systems, Inc., Accelerometer Technology, Inc.


Key Drivers • Shock sensors are vital for enhancing automotive safety by improving vehicle stability and accident detection, especially as ADAS technologies advance. 
Restraints • Calibration Challenges in the Shock Sensor Market Overcoming Complexity for Optimal Performance

Frequently Asked Questions

Ans:  The Shock Sensor Market is expected to grow at a CAGR of 22.31%.

Ans: Shock Sensor Market size was USD 1062.16 Million in 2023 and is expected to Reach USD 6504.91 Million by 2032.

Ans: Growing demand for automotive applications and security surveillance drives the growth of the Shock Sensor Market.

Ans: Some of the restraints on the growth of the Shock Sensor Market are it may give false alarms sometimes and also is very high in maintenance.

Ans: North America is the dominating region in the Shock Sensor Market.

Table of Content

1. Introduction

1.1 Market Definition

1.2 Scope (Inclusion and Exclusions)

1.3 Research Assumptions

2. Executive Summary

2.1 Market Overview

2.2 Regional Synopsis

2.3 Competitive Summary

3. Research Methodology

3.1 Top-Down Approach

3.2 Bottom-up Approach

3.3. Data Validation

3.4 Primary Interviews

4. Market Dynamics Impact Analysis

4.1 Market Driving Factors Analysis

4.1.2 Drivers

4.1.2 Restraints

4.1.3 Opportunities

4.1.4 Challenges

4.2 PESTLE Analysis

4.3 Porter’s Five Forces Model

5. Statistical Insights and Trends Reporting

5.1 Technology Adoption and Innovation Rates

5.2 Customer Demographics

5.3 Failure Rates and Reliability Metrics

5.4 Sensor Lifecycle and Replacement Rates

5.5 Supply Chain Data

 6. Competitive Landscape

6.1 List of Major Companies, By Region

6.2 Market Share Analysis, By Region

6.3 Product Benchmarking

6.3.1 Product specifications and features

6.3.2 Pricing

6.4 Strategic Initiatives

6.4.1 Marketing and promotional activities

6.4.2 Distribution and supply chain strategies

6.4.3 Expansion plans and new product launches

6.4.4 Strategic partnerships and collaborations

6.5 Technological Advancements

6.6 Market Positioning and Branding

7. Shock Sensor Market Segmentation, by Type

7.1 Chapter Overview

7.2 Piezoelectric

7.2.1 Piezoelectric Market Trends Analysis (2020-2032)

7.2.2 Piezoelectric Market Size Estimates and Forecasts to 2032 (USD Million)

7.3 Piezo resistive

7.3.1 Piezo resistive Market Trends Analysis (2020-2032)

7.3.2 Piezo resistive Market Size Estimates and Forecasts to 2032 (USD Million)

7.4 Capacitors

7.4.1 Capacitors Market Trends Analysis (2020-2032)

7.4.2 Capacitors Market Size Estimates and Forecasts to 2032 (USD Million)

7.5 Strain Gage

7.5.1 Strain Gage Market Trends Analysis (2020-2032)

7.5.2 Strain Gage Market Size Estimates and Forecasts to 2032 (USD Million)

7.5 Others

7.5.1 Others Market Trends Analysis (2020-2032)

7.5.2 Others Market Size Estimates and Forecasts to 2032 (USD Million)

8. Shock Sensor Market Segmentation, by End Use

8.1 Chapter Overview

8.2 Automotive

8.2.1 Automotive Market Trends Analysis (2020-2032)

8.2.2 Automotive Market Size Estimates and Forecasts to 2032 (USD Million)

8.3 Aerospace

8.3.1 Aerospace Market Trends Analysis (2020-2032)

8.3.2 Aerospace Market Size Estimates and Forecasts to 2032 (USD Million)

8.4 Industrial

8.4.1 Industrial Market Trends Analysis (2020-2032)

8.4.2 Industrial Market Size Estimates and Forecasts to 2032 (USD Million)

8.5 Consumer Electronics

8.5.1 Consumer Electronics Market Trends Analysis (2020-2032)

8.5.2 Consumer Electronics Market Size Estimates and Forecasts to 2032 (USD Million)

8.5 Others

8.5.1 Others Market Trends Analysis (2020-2032)

8.5.2 Others Market Size Estimates and Forecasts to 2032 (USD Million)

9. Regional Analysis

9.1 Chapter Overview

9.2 North America

9.2.1 Trends Analysis

9.2.2 North America Shock Sensor Market Estimates and Forecasts, by Country (2020-2032) (USD Million)

9.2.3 North America Shock Sensor Market Estimates and Forecasts, by Type (2020-2032) (USD Million) 

9.2.4 North America Shock Sensor Market Estimates and Forecasts, by End Use (2020-2032) (USD Million)

9.2.5 USA

9.2.5.1 USA Shock Sensor Market Estimates and Forecasts, by Type (2020-2032) (USD Million)

9.2.5.2 USA Shock Sensor Market Estimates and Forecasts, by End Use (2020-2032) (USD Million)

9.2.6 Canada

9.2.6.1 Canada Shock Sensor Market Estimates and Forecasts, by Type (2020-2032) (USD Million)

9.2.6.2 Canada Shock Sensor Market Estimates and Forecasts, by End Use (2020-2032) (USD Million)

9.2.7 Mexico

9.2.7.1 Mexico Shock Sensor Market Estimates and Forecasts, by Type (2020-2032) (USD Million)

9.2.7.2 Mexico Shock Sensor Market Estimates and Forecasts, by End Use (2020-2032) (USD Million)

9.3 Europe

9.3.1 Eastern Europe

9.3.1.1 Trends Analysis

9.3.1.2 Eastern Europe Shock Sensor Market Estimates and Forecasts, by Country (2020-2032) (USD Million)

9.3.1.3 Eastern Europe Shock Sensor Market Estimates and Forecasts, by Type (2020-2032) (USD Million) 

9.3.1.4 Eastern Europe Shock Sensor Market Estimates and Forecasts, by End Use (2020-2032) (USD Million)

9.3.1.5 Poland

9.3.1.5.1 Poland Shock Sensor Market Estimates and Forecasts, by Type (2020-2032) (USD Million)

9.3.1.5.2 Poland Shock Sensor Market Estimates and Forecasts, by End Use (2020-2032) (USD Million)

9.3.1.6 Romania

9.3.1.6.1 Romania Shock Sensor Market Estimates and Forecasts, by Type (2020-2032) (USD Million)

9.3.1.6.2 Romania Shock Sensor Market Estimates and Forecasts, by End Use (2020-2032) (USD Million)

9.3.1.7 Hungary

9.3.1.7.1 Hungary Shock Sensor Market Estimates and Forecasts, by Type (2020-2032) (USD Million)

9.3.1.7.2 Hungary Shock Sensor Market Estimates and Forecasts, by End Use (2020-2032) (USD Million)

9.3.1.8 Turkey

9.3.1.8.1 Turkey Shock Sensor Market Estimates and Forecasts, by Type (2020-2032) (USD Million)

9.3.1.8.2 Turkey Shock Sensor Market Estimates and Forecasts, by End Use (2020-2032) (USD Million)

9.3.1.9 Rest of Eastern Europe

9.3.1.9.1 Rest of Eastern Europe Shock Sensor Market Estimates and Forecasts, by Type (2020-2032) (USD Million)

9.3.1.9.2 Rest of Eastern Europe Shock Sensor Market Estimates and Forecasts, by End Use (2020-2032) (USD Million)

9.3.2 Western Europe

9.3.2.1 Trends Analysis

9.3.2.2 Western Europe Shock Sensor Market Estimates and Forecasts, by Country (2020-2032) (USD Million)

9.3.2.3 Western Europe Shock Sensor Market Estimates and Forecasts, by Type (2020-2032) (USD Million) 

9.3.2.4 Western Europe Shock Sensor Market Estimates and Forecasts, by End Use (2020-2032) (USD Million)

9.3.2.5 Germany

9.3.2.5.1 Germany Shock Sensor Market Estimates and Forecasts, by Type (2020-2032) (USD Million)

9.3.2.5.2 Germany Shock Sensor Market Estimates and Forecasts, by End Use (2020-2032) (USD Million)

9.3.2.6 France

9.3.2.6.1 France Shock Sensor Market Estimates and Forecasts, by Type (2020-2032) (USD Million)

9.3.2.6.2 France Shock Sensor Market Estimates and Forecasts, by End Use (2020-2032) (USD Million)

9.3.2.7 UK

9.3.2.7.1 UK Shock Sensor Market Estimates and Forecasts, by Type (2020-2032) (USD Million)

9.3.2.7.2 UK Shock Sensor Market Estimates and Forecasts, by End Use (2020-2032) (USD Million)

9.3.2.8 Italy

9.3.2.8.1 Italy Shock Sensor Market Estimates and Forecasts, by Type (2020-2032) (USD Million)

9.3.2.8.2 Italy Shock Sensor Market Estimates and Forecasts, by End Use (2020-2032) (USD Million)

9.3.2.9 Spain

9.3.2.9.1 Spain Shock Sensor Market Estimates and Forecasts, by Type (2020-2032) (USD Million)

9.3.2.9.2 Spain Shock Sensor Market Estimates and Forecasts, by End Use (2020-2032) (USD Million)

9.3.2.10 Netherlands

9.3.2.10.1 Netherlands Shock Sensor Market Estimates and Forecasts, by Type (2020-2032) (USD Million)

9.3.2.10.2 Netherlands Shock Sensor Market Estimates and Forecasts, by End Use (2020-2032) (USD Million)

9.3.2.11 Switzerland

9.3.2.11.1 Switzerland Shock Sensor Market Estimates and Forecasts, by Type (2020-2032) (USD Million)

9.3.2.11.2 Switzerland Shock Sensor Market Estimates and Forecasts, by End Use (2020-2032) (USD Million)

9.3.2.12 Austria

9.3.2.12.1 Austria Shock Sensor Market Estimates and Forecasts, by Type (2020-2032) (USD Million)

9.3.2.12.2 Austria Shock Sensor Market Estimates and Forecasts, by End Use (2020-2032) (USD Million)

9.3.2.13 Rest of Western Europe

9.3.2.13.1 Rest of Western Europe Shock Sensor Market Estimates and Forecasts, by Type (2020-2032) (USD Million)

9.3.2.13.2 Rest of Western Europe Shock Sensor Market Estimates and Forecasts, by End Use (2020-2032) (USD Million)

9.4 Asia-Pacific

9.4.1 Trends Analysis

9.4.2 Asia-Pacific Shock Sensor Market Estimates and Forecasts, by Country (2020-2032) (USD Million)

9.4.3 Asia-Pacific Shock Sensor Market Estimates and Forecasts, by Type (2020-2032) (USD Million) 

9.4.4 Asia-Pacific Shock Sensor Market Estimates and Forecasts, by End Use (2020-2032) (USD Million)

9.4.5 China

9.4.5.1 China Shock Sensor Market Estimates and Forecasts, by Type (2020-2032) (USD Million)

9.4.5.2 China Shock Sensor Market Estimates and Forecasts, by End Use (2020-2032) (USD Million)

9.4.6 India

9.4.5.1 India Shock Sensor Market Estimates and Forecasts, by Type (2020-2032) (USD Million)

9.4.5.2 India Shock Sensor Market Estimates and Forecasts, by End Use (2020-2032) (USD Million)

9.4.5 Japan

9.4.5.1 Japan Shock Sensor Market Estimates and Forecasts, by Type (2020-2032) (USD Million)

9.4.5.2 Japan Shock Sensor Market Estimates and Forecasts, by End Use (2020-2032) (USD Million)

9.4.6 South Korea

9.4.6.1 South Korea Shock Sensor Market Estimates and Forecasts, by Type (2020-2032) (USD Million)

9.4.6.2 South Korea Shock Sensor Market Estimates and Forecasts, by End Use (2020-2032) (USD Million)

9.4.7 Vietnam

9.4.7.1 Vietnam Shock Sensor Market Estimates and Forecasts, by Type (2020-2032) (USD Million)

9.2.7.2 Vietnam Shock Sensor Market Estimates and Forecasts, by End Use (2020-2032) (USD Million)

9.4.8 Singapore

9.4.8.1 Singapore Shock Sensor Market Estimates and Forecasts, by Type (2020-2032) (USD Million)

9.4.8.2 Singapore Shock Sensor Market Estimates and Forecasts, by End Use (2020-2032) (USD Million)

9.4.9 Australia

9.4.9.1 Australia Shock Sensor Market Estimates and Forecasts, by Type (2020-2032) (USD Million)

9.4.9.2 Australia Shock Sensor Market Estimates and Forecasts, by End Use (2020-2032) (USD Million)

9.4.10 Rest of Asia-Pacific

9.4.10.1 Rest of Asia-Pacific Shock Sensor Market Estimates and Forecasts, by Type (2020-2032) (USD Million)

9.4.10.2 Rest of Asia-Pacific Shock Sensor Market Estimates and Forecasts, by End Use (2020-2032) (USD Million)

9.5 Middle East and Africa

9.5.1 Middle East

9.5.1.1 Trends Analysis

9.5.1.2 Middle East Shock Sensor Market Estimates and Forecasts, by Country (2020-2032) (USD Million)

9.5.1.3 Middle East Shock Sensor Market Estimates and Forecasts, by Type (2020-2032) (USD Million) 

9.5.1.4 Middle East Shock Sensor Market Estimates and Forecasts, by End Use (2020-2032) (USD Million)

9.5.1.5 UAE

9.5.1.5.1 UAE Shock Sensor Market Estimates and Forecasts, by Type (2020-2032) (USD Million)

9.5.1.5.2 UAE Shock Sensor Market Estimates and Forecasts, by End Use (2020-2032) (USD Million)

9.5.1.6 Egypt

9.5.1.6.1 Egypt Shock Sensor Market Estimates and Forecasts, by Type (2020-2032) (USD Million)

9.5.1.6.2 Egypt Shock Sensor Market Estimates and Forecasts, by End Use (2020-2032) (USD Million)

9.5.1.7 Saudi Arabia

9.5.1.7.1 Saudi Arabia Shock Sensor Market Estimates and Forecasts, by Type (2020-2032) (USD Million)

9.5.1.7.2 Saudi Arabia Shock Sensor Market Estimates and Forecasts, by End Use (2020-2032) (USD Million)

9.5.1.8 Qatar

9.5.1.8.1 Qatar Shock Sensor Market Estimates and Forecasts, by Type (2020-2032) (USD Million)

9.5.1.8.2 Qatar Shock Sensor Market Estimates and Forecasts, by End Use (2020-2032) (USD Million)

9.5.1.9 Rest of Middle East

9.5.1.9.1 Rest of Middle East Shock Sensor Market Estimates and Forecasts, by Type (2020-2032) (USD Million)

9.5.1.9.2 Rest of Middle East Shock Sensor Market Estimates and Forecasts, by End Use (2020-2032) (USD Million)

9.5.2 Africa

9.5.2.1 Trends Analysis

9.5.2.2 Africa Shock Sensor Market Estimates and Forecasts, by Country (2020-2032) (USD Million)

9.5.2.3 Africa Shock Sensor Market Estimates and Forecasts, by Type (2020-2032) (USD Million) 

9.5.2.4 Africa Shock Sensor Market Estimates and Forecasts, by End Use (2020-2032) (USD Million)

9.5.2.5 South Africa

9.5.2.5.1 South Africa Shock Sensor Market Estimates and Forecasts, by Type (2020-2032) (USD Million)

9.5.2.5.2 South Africa Shock Sensor Market Estimates and Forecasts, by End Use (2020-2032) (USD Million)

9.5.2.6 Nigeria

9.5.2.6.1 Nigeria Shock Sensor Market Estimates and Forecasts, by Type (2020-2032) (USD Million)

9.5.2.6.2 Nigeria Shock Sensor Market Estimates and Forecasts, by End Use (2020-2032) (USD Million)

9.5.2.7 Rest of Africa

9.5.2.7.1 Rest of Africa Shock Sensor Market Estimates and Forecasts, by Type (2020-2032) (USD Million)

9.5.2.7.2 Rest of Africa Shock Sensor Market Estimates and Forecasts, by End Use (2020-2032) (USD Million)

9.6 Latin America

9.6.1 Trends Analysis

9.6.2 Latin America Shock Sensor Market Estimates and Forecasts, by Country (2020-2032) (USD Million)

9.6.3 Latin America Shock Sensor Market Estimates and Forecasts, by Type (2020-2032) (USD Million) 

9.6.4 Latin America Shock Sensor Market Estimates and Forecasts, by End Use (2020-2032) (USD Million)

9.6.5 Brazil

9.6.5.1 Brazil Shock Sensor Market Estimates and Forecasts, by Type (2020-2032) (USD Million)

9.6.5.2 Brazil Shock Sensor Market Estimates and Forecasts, by End Use (2020-2032) (USD Million)

9.6.6 Argentina

9.6.6.1 Argentina Shock Sensor Market Estimates and Forecasts, by Type (2020-2032) (USD Million)

9.6.6.2 Argentina Shock Sensor Market Estimates and Forecasts, by End Use (2020-2032) (USD Million)

9.6.7 Colombia

9.6.7.1 Colombia Shock Sensor Market Estimates and Forecasts, by Type (2020-2032) (USD Million)

9.6.7.2 Colombia Shock Sensor Market Estimates and Forecasts, by End Use (2020-2032) (USD Million)

9.6.8 Rest of Latin America

9.6.8.1 Rest of Latin America Shock Sensor Market Estimates and Forecasts, by Type (2020-2032) (USD Million)

9.6.8.2 Rest of Latin America Shock Sensor Market Estimates and Forecasts, by End Use (2020-2032) (USD Million)

10. Company Profiles

10.1 TE Connectivity

 10.1.1 Company Overview

10.1.2 Financial

10.1.3 Products/ Services Offered

10.1.4 SWOT Analysis

10.2 PCB Piezotronics, Inc.

10.2.1 Company Overview

10.2.2 Financial

10.2.3 Products/ Services Offered

10.2.4 SWOT Analysis

10.3 Honeywell International Inc.

 10.3.1 Company Overview

10.3.2 Financial

10.3.3 Products/ Services Offered

10.3.4 SWOT Analysis

10.4 DYTRAN INSTRUMENTS INCORPORATED

10.4.1 Company Overview

10.4.2 Financial

10.4.3 Products/ Services Offered

10.4.4 SWOT Analysis

10.5 Murata Manufacturing Co., Ltd

10.5.1 Company Overview

10.5.2 Financial

10.5.3 Products/ Services Offered

10.5.4 SWOT Analysis

10.6 Mobitron AB

10.6.1 Company Overview

10.6.2 Financial

10.6.3 Products/ Services Offered

10.6.4 SWOT Analysis

10.7 Meggitt PLC

 10.7.1 Company Overview

10.7.2 Financial

10.7.3 Products/ Services Offered

10.7.4 SWOT Analysis

10.8 SpotSee

   10.8.1 Company Overview

10.8.2 Financial

10.8.3 Products/ Services Offered

10.8.4 SWOT Analysis

10.9 SignalQuest, LLC

10.9.1 Company Overview

10.9.2 Financial

10.9.3 Products/ Services Offered

10.9.4 SWOT Analysis

10.10 Climax Technology Co., Ltd.

10.10.1 Company Overview

10.10.2 Financial

10.10.3 Products/ Services Offered

10.10.4 SWOT Analysis

11. Use Cases and Best Practices

12. Conclusion

An accurate research report requires proper strategizing as well as implementation. There are multiple factors involved in the completion of good and accurate research report and selecting the best methodology to compete the research is the toughest part. Since the research reports we provide play a crucial role in any company’s decision-making process, therefore we at SNS Insider always believe that we should choose the best method which gives us results closer to reality. This allows us to reach at a stage wherein we can provide our clients best and accurate investment to output ratio.

Each report that we prepare takes a timeframe of 350-400 business hours for production. Starting from the selection of titles through a couple of in-depth brain storming session to the final QC process before uploading our titles on our website we dedicate around 350 working hours. The titles are selected based on their current market cap and the foreseen CAGR and growth.


The 5 steps process:

Step 1: Secondary Research:

Secondary Research or Desk Research is as the name suggests is a research process wherein, we collect data through the readily available information. In this process we use various paid and unpaid databases which our team has access to and gather data through the same. This includes examining of listed companies’ annual reports, Journals, SEC filling etc. Apart from this our team has access to various associations across the globe across different industries. Lastly, we have exchange relationships with various university as well as individual libraries.

Secondary Research

Step 2: Primary Research

When we talk about primary research, it is a type of study in which the researchers collect relevant data samples directly, rather than relying on previously collected data.  This type of research is focused on gaining content specific facts that can be sued to solve specific problems. Since the collected data is fresh and first hand therefore it makes the study more accurate and genuine.

We at SNS Insider have divided Primary Research into 2 parts.

Part 1 wherein we interview the KOLs of major players as well as the upcoming ones across various geographic regions. This allows us to have their view over the market scenario and acts as an important tool to come closer to the accurate market numbers. As many as 45 paid and unpaid primary interviews are taken from both the demand and supply side of the industry to make sure we land at an accurate judgement and analysis of the market.

This step involves the triangulation of data wherein our team analyses the interview transcripts, online survey responses and observation of on filed participants. The below mentioned chart should give a better understanding of the part 1 of the primary interview.

Primary Research

Part 2: In this part of primary research the data collected via secondary research and the part 1 of the primary research is validated with the interviews from individual consultants and subject matter experts.

Consultants are those set of people who have at least 12 years of experience and expertise within the industry whereas Subject Matter Experts are those with at least 15 years of experience behind their back within the same space. The data with the help of two main processes i.e., FGDs (Focused Group Discussions) and IDs (Individual Discussions). This gives us a 3rd party nonbiased primary view of the market scenario making it a more dependable one while collation of the data pointers.

Step 3: Data Bank Validation

Once all the information is collected via primary and secondary sources, we run that information for data validation. At our intelligence centre our research heads track a lot of information related to the market which includes the quarterly reports, the daily stock prices, and other relevant information. Our data bank server gets updated every fortnight and that is how the information which we collected using our primary and secondary information is revalidated in real time.

Data Bank Validation

Step 4: QA/QC Process

After all the data collection and validation our team does a final level of quality check and quality assurance to get rid of any unwanted or undesired mistakes. This might include but not limited to getting rid of the any typos, duplication of numbers or missing of any important information. The people involved in this process include technical content writers, research heads and graphics people. Once this process is completed the title gets uploader on our platform for our clients to read it.

Step 5: Final QC/QA Process:

This is the last process and comes when the client has ordered the study. In this process a final QA/QC is done before the study is emailed to the client. Since we believe in giving our clients a good experience of our research studies, therefore, to make sure that we do not lack at our end in any way humanly possible we do a final round of quality check and then dispatch the study to the client.

Key Segments:

By Type

  • Piezoelectric

  • Piezo resistive

  • Capacitors

  • Strain Gage

  • Others

By End Use

  • Automotive

  • Aerospace

  • Industrial

  • Consumer Electronics

  • Others

Request for Segment Customization as per your Business Requirement: Segment Customization Request

REGIONAL COVERAGE:

North America

  • US

  • Canada

  • Mexico

Europe

  • Eastern Europe

    • Poland

    • Romania

    • Hungary

    • Turkey

    • Rest of Eastern Europe

  • Western Europe

    • Germany

    • France

    • UK

    • Italy

    • Spain

    • Netherlands

    • Switzerland

    • Austria

    • Rest of Western Europe

Asia-Pacific

  • China

  • India

  • Japan

  • South Korea

  • Vietnam

  • Singapore

  • Australia

  • Rest of Asia Pacific

Middle East & Africa

  • Middle East

    • UAE

    • Egypt

    • Saudi Arabia

    • Qatar

    • Rest of the Middle East

  • Africa

    • Nigeria

    • South Africa

    • Rest of Africa

Latin America

  • Brazil

  • Argentina

  • Colombia

  • Rest of Latin America

Request for Country Level Research Report: Country Level Customization Request

Available Customization

With the given market data, SNS Insider offers customization as per the company’s specific needs. The following customization options are available for the report:

  • Product Analysis

  • Criss-Cross segment analysis (e.g. Product X Application)

  • Product Matrix which gives a detailed comparison of the product portfolio of each company

  • Geographic Analysis

  • Additional countries in any of the regions

  • Company Information

  • Detailed analysis and profiling of additional market players (Up to five)


  •            5000 (33% Discount)


  •            8950 (40% Discount)


  •            3050 (23% Discount)

Start a Conversation

Hi! Click one of our member below to chat on Phone