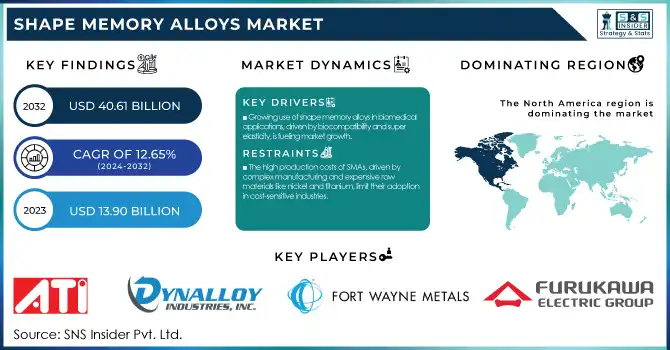
The Shape Memory Alloys Market Size was estimated at USD 13.90 billion in 2023 and is supposed to reach USD 40.61 billion by 2032 with a growing CAGR of 12.65% over the forecast period 2024-2032. The Shape Memory Alloys (SMA) Market report offers a unique perspective by analyzing production capacity & utilization trends across key regions, highlighting supply-demand dynamics. It explores regulatory standards & compliance variations shaping regional market entry. The study tracks technological advancements and adoption rates, showcasing innovations in biomedical, aerospace, and robotics applications. Additionally, export/import trends reveal shifts in global trade flows. A key trend includes the rising integration of AI-driven material design, enhancing SMA performance and lifecycle predictions.
To Get more information on Shape Memory Alloys Market - Request Free Sample Report
Drivers
The increasing adoption of shape memory alloys in biomedical applications, driven by their biocompatibility, super elasticity, and advancements in medical technology, is a key factor fueling market growth.
The growing demand for shape memory alloys (SMAs) in biomedical applications is a key driver of market growth. Due to its biocompatibility, super elasticity, and shape recovery properties, it has become one of the most used alloys for devices like stents, orthopedic implants, guidewires, and dental braces. SMA-based medical devices are gaining traction due to the rising prevalence of cardiovascular diseases, growing orthopedic surgeries, and advancements in minimally invasive procedures. Moreover, recent technological innovations in the healthcare sector, which comprise smart implants and self-expanding stents, are extending the range of SMAs. Market opportunities are further boosted by the trend towards patient-specific and adaptive medical solutions. Ongoing R&D work results in increasing fatigue resistance and mechanical performance, increasing long-term reliability of SMAs. Ease of the biomedical segment is anticipated to aid the overall development of the shape memory alloys industry on the back of rising aging population and rising healthcare investments.
Restraint
The high production costs of SMAs, driven by complex manufacturing and expensive raw materials like nickel and titanium, limit their adoption in cost-sensitive industries.
Shape memory alloys (SMAs) are costly due to their complex manufacturing processes and the high prices of essential raw materials like nickel and titanium. SMAs are costly to produce because they require exact alloy compositions coupled with specialized heat treatments and advanced processing methods, such as vacuum melting and thermomechanical training. And the main constituents of the majority of the SMAs, titanium and nickel, are generally expensive and have a sensitive market too, aggravating the expenses. These combined characteristics deter use of SMAs in cost-sensitive industries, which often opt to use inexpensive replacements such as regular metals or polymers. Additionally, the requirement for strict quality control, as well as specialized equipment, raise operational costs, hindering large-scale implementation. Note: while SMAs provide unique characteristics like super elasticity and shape memory effects, their relatively high price limits their applications to the high-value domains of aerospace, healthcare, and robotics, hindering their penetration into mass-market consumer products and general manufacturing sectors.
Opportunities
Shape memory alloys (SMAs) enhance energy efficiency in smart grids, renewable energy, and sustainable infrastructure through adaptive, self-healing, and lightweight designs.
The development of shape memory alloys (SMAs) for sustainable and eco-friendly applications is gaining momentum, particularly in energy-efficient systems. With the implementation of SMAs in smart grids, energy storage can be improved, power distribution can be optimized, and the resilience of the grid can be enhanced. For renewable energy, alloys are employed with solar panel actuators, wind turbine components, and thermal systems that self-adjust to secure the greatest efficiency. Their ability to phase transform with low energy input means they are excellent candidates for adaptive and self-healing structures, thereby decreasing maintenance and material waste. Moreover, SMAs promote sustainability because they are used in lightweight, durable green buildings and transportation, which ultimately reduce carbon footprints. The focus of industries on sustainable development will lead to an increase in demand for SMAs in green applications. With the increasing potential of material science and manufacturing techniques to drive the costs of these materials down, SMAs are set to unlock the next chapter of cleaner and energy-efficient technologies.
Challenges
Designing SMA-based systems is complex due to the need for precise control over phase transformation temperatures, material behavior, and integration challenges.
Designing shape memory alloy (SMA)-based systems is technically complex due to the precise control required over phase transformation temperatures and material behavior. SMAs have unique properties like the ability to return to a predefined shape by applying heating or removing stress, but these properties depend on parameters such as alloy composition, processing methods, and thermal cycling. In high-stakes industries such as aerospace, automotive, and robotics, engineers face rigorous challenges to design these SMA components to maintain reliable performance in response to changing environmental conditions. Further, SMAs possess nonlinear stress-strain behavior, which can make analysis and predictions challenging, often necessitating the use of envelopes and specialized computational tools. Integration with current systems means that the material must also be compatible with other materials and control methods, further complicating matters. In applications including medical devices and actuators, even marginal transformations are critical in functionality, demanding precision in manufacturing and testing. However, these technical challenges have constrained the widespread adoption of SMAs despite their potential benefits.
By Product
The Nickel-Titanium (Nitinol) Alloys segment dominated with a market share of over 74% in 2023, due to its exceptional super elasticity, corrosion resistance, and biocompatibility. All these properties have made it the material of choice for certain medical applications, such as stents, orthopedic implants and guidewires. Nitinol's properties enable its use in actuators and adaptive structures in the aerospace industry, where extreme conditions must be able to be withstood. Moreover, its excellent durability and flexibility propel its usage in robotics and industrial automation for advanced actuating mechanisms. Nitinol's market quadrants are also reinforced by the increasing need for minimally invasive surgical procedures with rising demand for high-performance materials in critical industries. As there are new inventions in the field of Biomedical Engineering and Smart Materials continuously, this segment will also witness the fastest growth in the market.
By End Use
The Biomedical segment dominated with a market share of over 68% in 2023, due to its widespread use in critical medical applications. These alloys are widely used, e.g., in stents, guidewires, orthopedic implants, and dental braces, where their properties confer major advantages. Its high biocompatibility makes it safe to contact with human tissues, while corrosion resistance is one of the main reasons for its long-lasting applications and durability of medical devices. Their super elastic property also enables flexibility and shape recovery, making them suitable for minimally invasive procedures. The increasing incidence of cardiovascular disorders, orthopedic disorders, and dental correction is another major factor driving the market. Owing to the increased efficacy of shape memory alloys, as medical technology keeps advancing, the biomedical sector remains the driving force behind the market leader.
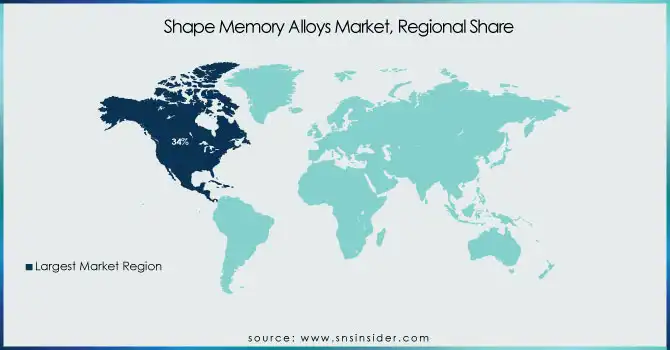
North America region dominated with a market share of over 34% in 2023, owing to its well-established aerospace, automotive, and biomedical industries that continuously utilize these advanced materials. Factors such as significant R&D investments, tech innovations, and presence of key market players are driving the growth across the region. In aerospace, shape memory metals are used in the design of actuators, smart morphing structures, etc., and in biomedical applications, they are used in the design of medical implants, surgical instruments, and more. The automotive industry also incorporates these alloys for improved performance and safety features. North America continues to be the most dominant region for shape memory alloys due to the growing utilization of smart materials, along with governmental assistance to drive research and innovation.
The Asia-Pacific region is the fastest-growing market for shape memory alloys (SMAs) due to rising demand from key industries such as healthcare, consumer electronics, and automotive. Countries such as China, Japan, and India are investing significantly in advanced manufacturing technologies as the region goes on to witness rapid industrialization. The increasing healthcare costs are driving the demand for SMAs in medical applications such as stents, orthopedic implants, and surgical instruments. In addition, the burgeoning consumer electronics industry is energizing the demand for shape memory alloys (SMAs) in smartphones, wearables, and flexible devices. SMAs for lightweight and high-performance parts are also being used in the automotive sector. Strong government support, advances in technology and a budding industrial base also propels Asia-Pacific in leading the charge for market growth.
Get Customized Report as per Your Business Requirement - Enquiry Now
Some of the major key players in the Shape Memory Alloys Market
ATI – (Nickel-Titanium Alloys, Cobalt-Based SMAs)
Baoji Seabird Metal Material Co., Ltd. – (Nickel-Titanium Wires, SMA Sheets)
Dynalloy, Inc. – (Flexinol Shape Memory Alloy Wires)
Fort Wayne Metals Research Products Corp – (Nickel-Titanium Wires, Nitinol Tubing)
Furukawa Electric Co., Ltd. – (Shape Memory Alloy Actuators, Medical-Grade SMAs)
Johnson Matthey – (Nickel-Titanium Alloys, Biomedical SMAs)
Mishra Dhatu Nigam Limited (MIDHANI) – (Nitinol Alloys, Aerospace-Grade SMAs)
Nippon Seisen Co., Ltd. – (Nickel-Titanium Wires, Shape Memory Tubes)
Nippon Steel Corporation – (Shape Memory Alloy Sheets, Structural SMAs)
SAES Group – (SMA Actuators, Smart Materials for Robotics)
Memory Corporation – (Medical-Grade Nitinol, SMA Tubing)
Confluent Medical Technologies – (Biomedical Nitinol Components)
TiNi Alloy Co. – (SMA Actuators, Smart Springs)
G.RAU GmbH & Co. KG – (Shape Memory Alloy Wires, Nitinol Components)
Metalwerks PMD Inc. – (Nickel-Titanium Shape Memory Materials)
SAES Getters S.p.A. – (SMA Actuators, Smart Materials)
Xian Saite Metal Materials Development Co., Ltd. – (Nitinol Tubing, SMA Wires)
Ultimate NiTi Technologies – (Nickel-Titanium Medical Devices, SMA Components)
Baoji Titanium Industry Co., Ltd. – (SMA Sheets, Medical Wires)
Mitsubishi Materials Corporation – (Shape Memory Alloy Actuators, Industrial SMAs)
Suppliers for (Special metals and alloys, including shape memory alloys for aerospace and defense) on the Shape Memory Alloys Market
SAES Getters S.p.A.
Mishra Dhatu Nigam Limited (MIDHANI)
Memory Corporation
SAES Smart Materials
Special Metals Corporation
Memory GmbH
Actuator Solutions GmbH
Power & Energy
Alfmeier
National Aerospace Laboratories (CSIR-NAL)
RECENT DEVELOPMENT
In April 2024: ATI Inc. (NYSE: ATI) announced the completion of its Vandergrift Operations expansion, now the most advanced materials finishing facility of its kind. The event, attended by government and community leaders, highlights ATI’s strategic focus on high-quality titanium and nickel-based alloys. By consolidating production from five other sites, the expansion enhances efficiency and boosts the output of high-value, specialized materials.
| Report Attributes | Details |
|---|---|
| Market Size in 2023 | USD 13.90 Billion |
| Market Size by 2032 | USD 40.61 Billion |
| CAGR | CAGR of 12.65% From 2024 to 2032 |
| Base Year | 2023 |
| Forecast Period | 2024-2032 |
| Historical Data | 2020-2022 |
| Report Scope & Coverage | Market Size, Segments Analysis, Competitive Landscape, Regional Analysis, DROC & SWOT Analysis, Forecast Outlook |
| Key Segments | • By Product (Nickel-Titanium (Nitinol) Alloys, Copper-Based Alloys, Others) • By End Use (Biomedical, Automotive, Aerospace & Defense, Consumer Electronics & Household, Others) |
| Regional Analysis/Coverage | North America (US, Canada, Mexico), Europe (Eastern Europe [Poland, Romania, Hungary, Turkey, Rest of Eastern Europe] Western Europe] Germany, France, UK, Italy, Spain, Netherlands, Switzerland, Austria, Rest of Western Europe]), Asia Pacific (China, India, Japan, South Korea, Vietnam, Singapore, Australia, Rest of Asia Pacific), Middle East & Africa (Middle East [UAE, Egypt, Saudi Arabia, Qatar, Rest of Middle East], Africa [Nigeria, South Africa, Rest of Africa], Latin America (Brazil, Argentina, Colombia, Rest of Latin America) |
| Company Profiles | ATI, Baoji Seabird Metal Material Co., Ltd., Dynalloy, Inc., Fort Wayne Metals Research Products Corp, Furukawa Electric Co., Ltd., Johnson Matthey, Mishra Dhatu Nigam Limited (MIDHANI), Nippon Seisen Co., Ltd., Nippon Steel Corporation, SAES Group, Memry Corporation, Confluent Medical Technologies, TiNi Alloy Co., G.RAU GmbH & Co. KG, Metalwerks PMD Inc., SAES Getters S.p.A., Xian Saite Metal Materials Development Co., Ltd., Ultimate NiTi Technologies, Baoji Titanium Industry Co., Ltd., Mitsubishi Materials Corporation. |
Ans: The Shape Memory Alloys Market is expected to grow at a CAGR of 12.65% during 2024-2032.
Ans: The Shape Memory Alloys Market was USD 13.90 billion in 2023 and is expected to reach USD 40.61 billion by 2032.
Ans: The increasing adoption of shape memory alloys in biomedical applications, driven by their biocompatibility, super elasticity, and advancements in medical technology, is a key factor fueling market growth.
Ans: The “Nickel-Titanium (Nitinol) Alloys” segment dominated the Shape Memory Alloys Market.
Ans: North America dominated the Shape Memory Alloys Market in 2023
Table of Contents:
1. Introduction
1.1 Market Definition
1.2 Scope (Inclusion and Exclusions)
1.3 Research Assumptions
2. Executive Summary
2.1 Market Overview
2.2 Regional Synopsis
2.3 Competitive Summary
3. Research Methodology
3.1 Top-Down Approach
3.2 Bottom-up Approach
3.3. Data Validation
3.4 Primary Interviews
4. Market Dynamics Impact Analysis
4.1 Market Driving Factors Analysis
4.1.2 Drivers
4.1.2 Restraints
4.1.3 Opportunities
4.1.4 Challenges
4.2 PESTLE Analysis
4.3 Porter’s Five Forces Model
5. Statistical Insights and Trends Reporting
5.1 Production Capacity & Utilization Rates, by Region (2020-2023)
5.2 Regulatory Standards & Compliance, by Region
5.3 Technological Advancements & Adoption Rates, by Region
5.4 Export/Import Trends, by Region (2023)
6. Competitive Landscape
6.1 List of Major Companies, By Region
6.2 Market Share Analysis, By Region
6.3 Product Benchmarking
6.3.1 Product specifications and features
6.3.2 Pricing
6.4 Strategic Initiatives
6.4.1 Marketing and promotional activities
6.4.2 Distribution and Supply Chain Strategies
6.4.3 Expansion plans and new product launches
6.4.4 Strategic partnerships and collaborations
6.5 Technological Advancements
6.6 Market Positioning and Branding
7. Shape Memory Alloys Market Segmentation, By Product
7.1 Chapter Overview
7.2 Nickel-Titanium (Nitinol) Alloys
7.2.1 Nickel-Titanium (Nitinol) Alloys Market Trends Analysis (2020-2032)
7.2.2 Nickel-Titanium (Nitinol) Alloys Market Size Estimates and Forecasts to 2032 (USD Billion)
7.3 Copper-Based Alloys
7.3.1 Copper-Based Alloys Market Trends Analysis (2020-2032)
7.3.2 Copper-Based Alloys Market Size Estimates and Forecasts to 2032 (USD Billion)
7.4 Others
7.4.1 Others Market Trends Analysis (2020-2032)
7.4.2 Others Market Size Estimates and Forecasts to 2032 (USD Billion)
8. Shape Memory Alloys Market Segmentation, By End Use
8.1 Chapter Overview
8.2 Biomedical
8.2.1 Biomedical Market Trends Analysis (2020-2032)
8.2.2 Biomedical Market Size Estimates and Forecasts to 2032 (USD Billion)
8.3 Automotive
8.3.1 Automotive Market Trends Analysis (2020-2032)
8.3.2 Automotive Market Size Estimates and Forecasts to 2032 (USD Billion)
8.4 Aerospace & Defense
8.4.1 Aerospace & Defense Market Trends Analysis (2020-2032)
8.4.2 Aerospace & Defense Market Size Estimates and Forecasts to 2032 (USD Billion)
8.5 Consumer Electronics & Household
8.5.1 Consumer Electronics & Household Market Trends Analysis (2020-2032)
8.5.2 Consumer Electronics & Household Market Size Estimates and Forecasts to 2032 (USD Billion)
8.6 Others
8.6.1 Others Market Trends Analysis (2020-2032)
8.6.2 Others Market Size Estimates and Forecasts to 2032 (USD Billion)
9. Regional Analysis
9.1 Chapter Overview
9.2 North America
9.2.1 Trends Analysis
9.2.2 North America Shape Memory Alloys Market Estimates and Forecasts, by Country (2020-2032) (USD Billion)
9.2.3 North America Shape Memory Alloys Market Estimates and Forecasts, By Product (2020-2032) (USD Billion)
9.2.4 North America Shape Memory Alloys Market Estimates and Forecasts, By End-Use (2020-2032) (USD Billion)
9.2.5 USA
9.2.5.1 USA Shape Memory Alloys Market Estimates and Forecasts, By Product (2020-2032) (USD Billion)
9.2.5.2 USA Shape Memory Alloys Market Estimates and Forecasts, By End-Use (2020-2032) (USD Billion)
9.2.6 Canada
9.2.6.1 Canada Shape Memory Alloys Market Estimates and Forecasts, By Product (2020-2032) (USD Billion)
9.2.6.2 Canada Shape Memory Alloys Market Estimates and Forecasts, By End-Use (2020-2032) (USD Billion)
9.2.7 Mexico
9.2.7.1 Mexico Shape Memory Alloys Market Estimates and Forecasts, By Product (2020-2032) (USD Billion)
9.2.7.2 Mexico Shape Memory Alloys Market Estimates and Forecasts, By End-Use (2020-2032) (USD Billion)
9.3 Europe
9.3.1 Eastern Europe
9.3.1.1 Trends Analysis
9.3.1.2 Eastern Europe Shape Memory Alloys Market Estimates and Forecasts, by Country (2020-2032) (USD Billion)
9.3.1.3 Eastern Europe Shape Memory Alloys Market Estimates and Forecasts, By Product (2020-2032) (USD Billion)
9.3.1.4 Eastern Europe Shape Memory Alloys Market Estimates and Forecasts, By End-Use (2020-2032) (USD Billion)
9.3.1.5 Poland
9.3.1.5.1 Poland Shape Memory Alloys Market Estimates and Forecasts, By Product (2020-2032) (USD Billion)
9.3.1.5.2 Poland Shape Memory Alloys Market Estimates and Forecasts, By End-Use (2020-2032) (USD Billion)
9.3.1.6 Romania
9.3.1.6.1 Romania Shape Memory Alloys Market Estimates and Forecasts, By Product (2020-2032) (USD Billion)
9.3.1.6.2 Romania Shape Memory Alloys Market Estimates and Forecasts, By End-Use (2020-2032) (USD Billion)
9.3.1.7 Hungary
9.3.1.7.1 Hungary Shape Memory Alloys Market Estimates and Forecasts, By Product (2020-2032) (USD Billion)
9.3.1.7.2 Hungary Shape Memory Alloys Market Estimates and Forecasts, By End-Use (2020-2032) (USD Billion)
9.3.1.8 Turkey
9.3.1.8.1 Turkey Shape Memory Alloys Market Estimates and Forecasts, By Product (2020-2032) (USD Billion)
9.3.1.8.2 Turkey Shape Memory Alloys Market Estimates and Forecasts, By End-Use (2020-2032) (USD Billion)
9.3.1.9 Rest of Eastern Europe
9.3.1.9.1 Rest of Eastern Europe Shape Memory Alloys Market Estimates and Forecasts, By Product (2020-2032) (USD Billion)
9.3.1.9.2 Rest of Eastern Europe Shape Memory Alloys Market Estimates and Forecasts, By End-Use (2020-2032) (USD Billion)
9.3.2 Western Europe
9.3.2.1 Trends Analysis
9.3.2.2 Western Europe Shape Memory Alloys Market Estimates and Forecasts, by Country (2020-2032) (USD Billion)
9.3.2.3 Western Europe Shape Memory Alloys Market Estimates and Forecasts, By Product (2020-2032) (USD Billion)
9.3.2.4 Western Europe Shape Memory Alloys Market Estimates and Forecasts, By End-Use (2020-2032) (USD Billion)
9.3.2.5 Germany
9.3.2.5.1 Germany Shape Memory Alloys Market Estimates and Forecasts, By Product (2020-2032) (USD Billion)
9.3.2.5.2 Germany Shape Memory Alloys Market Estimates and Forecasts, By End-Use (2020-2032) (USD Billion)
9.3.2.6 France
9.3.2.6.1 France Shape Memory Alloys Market Estimates and Forecasts, By Product (2020-2032) (USD Billion)
9.3.2.6.2 France Shape Memory Alloys Market Estimates and Forecasts, By End-Use (2020-2032) (USD Billion)
9.3.2.7 UK
9.3.2.7.1 UK Shape Memory Alloys Market Estimates and Forecasts, By Product (2020-2032) (USD Billion)
9.3.2.7.2 UK Shape Memory Alloys Market Estimates and Forecasts, By End-Use (2020-2032) (USD Billion)
9.3.2.8 Italy
9.3.2.8.1 Italy Shape Memory Alloys Market Estimates and Forecasts, By Product (2020-2032) (USD Billion)
9.3.2.8.2 Italy Shape Memory Alloys Market Estimates and Forecasts, By End-Use (2020-2032) (USD Billion)
9.3.2.9 Spain
9.3.2.9.1 Spain Shape Memory Alloys Market Estimates and Forecasts, By Product (2020-2032) (USD Billion)
9.3.2.9.2 Spain Shape Memory Alloys Market Estimates and Forecasts, By End-Use (2020-2032) (USD Billion)
9.3.2.10 Netherlands
9.3.2.10.1 Netherlands Shape Memory Alloys Market Estimates and Forecasts, By Product (2020-2032) (USD Billion)
9.3.2.10.2 Netherlands Shape Memory Alloys Market Estimates and Forecasts, By End-Use (2020-2032) (USD Billion)
9.3.2.11 Switzerland
9.3.2.11.1 Switzerland Shape Memory Alloys Market Estimates and Forecasts, By Product (2020-2032) (USD Billion)
9.3.2.11.2 Switzerland Shape Memory Alloys Market Estimates and Forecasts, By End-Use (2020-2032) (USD Billion)
9.3.2.12 Austria
9.3.2.12.1 Austria Shape Memory Alloys Market Estimates and Forecasts, By Product (2020-2032) (USD Billion)
9.3.2.12.2 Austria Shape Memory Alloys Market Estimates and Forecasts, By End-Use (2020-2032) (USD Billion)
9.3.2.13 Rest of Western Europe
9.3.2.13.1 Rest of Western Europe Shape Memory Alloys Market Estimates and Forecasts, By Product (2020-2032) (USD Billion)
9.3.2.13.2 Rest of Western Europe Shape Memory Alloys Market Estimates and Forecasts, By End-Use (2020-2032) (USD Billion)
9.4 Asia Pacific
9.4.1 Trends Analysis
9.4.2 Asia Pacific Shape Memory Alloys Market Estimates and Forecasts, by Country (2020-2032) (USD Billion)
9.4.3 Asia Pacific Shape Memory Alloys Market Estimates and Forecasts, By Product (2020-2032) (USD Billion)
9.4.4 Asia Pacific Shape Memory Alloys Market Estimates and Forecasts, By End-Use (2020-2032) (USD Billion)
9.4.5 China
9.4.5.1 China Shape Memory Alloys Market Estimates and Forecasts, By Product (2020-2032) (USD Billion)
9.4.5.2 China Shape Memory Alloys Market Estimates and Forecasts, By End-Use (2020-2032) (USD Billion)
9.4.6 India
9.4.5.1 India Shape Memory Alloys Market Estimates and Forecasts, By Product (2020-2032) (USD Billion)
9.4.5.2 India Shape Memory Alloys Market Estimates and Forecasts, By End-Use (2020-2032) (USD Billion)
9.4.5 Japan
9.4.5.1 Japan Shape Memory Alloys Market Estimates and Forecasts, By Product (2020-2032) (USD Billion)
9.4.5.2 Japan Shape Memory Alloys Market Estimates and Forecasts, By End-Use (2020-2032) (USD Billion)
9.4.6 South Korea
9.4.6.1 South Korea Shape Memory Alloys Market Estimates and Forecasts, By Product (2020-2032) (USD Billion)
9.4.6.2 South Korea Shape Memory Alloys Market Estimates and Forecasts, By End-Use (2020-2032) (USD Billion)
9.4.7 Vietnam
9.4.7.1 Vietnam Shape Memory Alloys Market Estimates and Forecasts, By Product (2020-2032) (USD Billion)
9.2.7.2 Vietnam Shape Memory Alloys Market Estimates and Forecasts, By End-Use (2020-2032) (USD Billion)
9.4.8 Singapore
9.4.8.1 Singapore Shape Memory Alloys Market Estimates and Forecasts, By Product (2020-2032) (USD Billion)
9.4.8.2 Singapore Shape Memory Alloys Market Estimates and Forecasts, By End-Use (2020-2032) (USD Billion)
9.4.9 Australia
9.4.9.1 Australia Shape Memory Alloys Market Estimates and Forecasts, By Product (2020-2032) (USD Billion)
9.4.9.2 Australia Shape Memory Alloys Market Estimates and Forecasts, By End-Use (2020-2032) (USD Billion)
9.4.10 Rest of Asia Pacific
9.4.10.1 Rest of Asia Pacific Shape Memory Alloys Market Estimates and Forecasts, By Product (2020-2032) (USD Billion)
9.4.10.2 Rest of Asia Pacific Shape Memory Alloys Market Estimates and Forecasts, By End-Use (2020-2032) (USD Billion)
9.5 Middle East and Africa
9.5.1 Middle East
9.5.1.1 Trends Analysis
9.5.1.2 Middle East Shape Memory Alloys Market Estimates and Forecasts, by Country (2020-2032) (USD Billion)
9.5.1.3 Middle East Shape Memory Alloys Market Estimates and Forecasts, By Product (2020-2032) (USD Billion)
9.5.1.4 Middle East Shape Memory Alloys Market Estimates and Forecasts, By End-Use (2020-2032) (USD Billion)
9.5.1.5 UAE
9.5.1.5.1 UAE Shape Memory Alloys Market Estimates and Forecasts, By Product (2020-2032) (USD Billion)
9.5.1.5.2 UAE Shape Memory Alloys Market Estimates and Forecasts, By End-Use (2020-2032) (USD Billion)
9.5.1.6 Egypt
9.5.1.6.1 Egypt Shape Memory Alloys Market Estimates and Forecasts, By Product (2020-2032) (USD Billion)
9.5.1.6.2 Egypt Shape Memory Alloys Market Estimates and Forecasts, By End-Use (2020-2032) (USD Billion)
9.5.1.7 Saudi Arabia
9.5.1.7.1 Saudi Arabia Shape Memory Alloys Market Estimates and Forecasts, By Product (2020-2032) (USD Billion)
9.5.1.7.2 Saudi Arabia Shape Memory Alloys Market Estimates and Forecasts, By End-Use (2020-2032) (USD Billion)
9.5.1.8 Qatar
9.5.1.8.1 Qatar Shape Memory Alloys Market Estimates and Forecasts, By Product (2020-2032) (USD Billion)
9.5.1.8.2 Qatar Shape Memory Alloys Market Estimates and Forecasts, By End-Use (2020-2032) (USD Billion)
9.5.1.9 Rest of Middle East
9.5.1.9.1 Rest of Middle East Shape Memory Alloys Market Estimates and Forecasts, By Product (2020-2032) (USD Billion)
9.5.1.9.2 Rest of Middle East Shape Memory Alloys Market Estimates and Forecasts, By End-Use (2020-2032) (USD Billion)
9.5.2 Africa
9.5.2.1 Trends Analysis
9.5.2.2 Africa Shape Memory Alloys Market Estimates and Forecasts, by Country (2020-2032) (USD Billion)
9.5.2.3 Africa Shape Memory Alloys Market Estimates and Forecasts, By Product (2020-2032) (USD Billion)
9.5.2.4 Africa Shape Memory Alloys Market Estimates and Forecasts, By End-Use (2020-2032) (USD Billion)
9.5.2.5 South Africa
9.5.2.5.1 South Africa Shape Memory Alloys Market Estimates and Forecasts, By Product (2020-2032) (USD Billion)
9.5.2.5.2 South Africa Shape Memory Alloys Market Estimates and Forecasts, By End-Use (2020-2032) (USD Billion)
9.5.2.6 Nigeria
9.5.2.6.1 Nigeria Shape Memory Alloys Market Estimates and Forecasts, By Product (2020-2032) (USD Billion)
9.5.2.6.2 Nigeria Shape Memory Alloys Market Estimates and Forecasts, By End-Use (2020-2032) (USD Billion)
9.5.2.7 Rest of Africa
9.5.2.7.1 Rest of Africa Shape Memory Alloys Market Estimates and Forecasts, By Product (2020-2032) (USD Billion)
9.5.2.7.2 Rest of Africa Shape Memory Alloys Market Estimates and Forecasts, By End-Use (2020-2032) (USD Billion)
9.6 Latin America
9.6.1 Trends Analysis
9.6.2 Latin America Shape Memory Alloys Market Estimates and Forecasts, by Country (2020-2032) (USD Billion)
9.6.3 Latin America Shape Memory Alloys Market Estimates and Forecasts, By Product (2020-2032) (USD Billion)
9.6.4 Latin America Shape Memory Alloys Market Estimates and Forecasts, By End-Use (2020-2032) (USD Billion)
9.6.5 Brazil
9.6.5.1 Brazil Shape Memory Alloys Market Estimates and Forecasts, By Product (2020-2032) (USD Billion)
9.6.5.2 Brazil Shape Memory Alloys Market Estimates and Forecasts, By End-Use (2020-2032) (USD Billion)
9.6.6 Argentina
9.6.6.1 Argentina Shape Memory Alloys Market Estimates and Forecasts, By Product (2020-2032) (USD Billion)
9.6.6.2 Argentina Shape Memory Alloys Market Estimates and Forecasts, By End-Use (2020-2032) (USD Billion)
9.6.7 Colombia
9.6.7.1 Colombia Shape Memory Alloys Market Estimates and Forecasts, By Product (2020-2032) (USD Billion)
9.6.7.2 Colombia Shape Memory Alloys Market Estimates and Forecasts, By End-Use (2020-2032) (USD Billion)
9.6.8 Rest of Latin America
9.6.8.1 Rest of Latin America Shape Memory Alloys Market Estimates and Forecasts, By Product (2020-2032) (USD Billion)
9.6.8.2 Rest of Latin America Shape Memory Alloys Market Estimates and Forecasts, By End-Use (2020-2032) (USD Billion)
10. Company Profiles
10.1 Mishra Dhatu Nigam Limited (MIDHANI)
10.1.1 Company Overview
10.1.2 Financial
10.1.3 Products/ Services Offered
110.1.4 SWOT Analysis
10.2 SAES Group
10.2.1 Company Overview
10.2.2 Financial
10.2.3 Products/ Services Offered
10.2.4 SWOT Analysis
10.3 Furukawa Electric Co., Ltd.
10.3.1 Company Overview
10.3.2 Financial
10.3.3 Products/ Services Offered
10.3.4 SWOT Analysis
10.4 Baoji Seabird Metal Material Co., Ltd.
10.4.1 Company Overview
10.4.2 Financial
10.4.3 Products/ Services Offered
10.4.4 SWOT Analysis
10.5 Nippon Seisen Co., Ltd.
10.5.1 Company Overview
10.5.2 Financial
10.5.3 Products/ Services Offered
10.5.4 SWOT Analysis
10.6 Dynalloy, Inc.
10.6.1 Company Overview
10.6.2 Financial
10.6.3 Products/ Services Offered
10.6.4 SWOT Analysis
10.7 Johnson Matthey
10.7.1 Company Overview
10.7.2 Financial
10.7.3 Products/ Services Offered
10.7.4 SWOT Analysis
10.8 ATI
10.8.1 Company Overview
10.8.2 Financial
10.8.3 Products/ Services Offered
10.8.4 SWOT Analysis
10.9 Fort Wayne Metals Research Products Corp
10.9.1 Company Overview
10.9.2 Financial
10.9.3 Products/ Services Offered
10.9.4 SWOT Analysis
10.10 Nippon Steel Corporation
10.9.1 Company Overview
10.9.2 Financial
10.9.3 Products/ Services Offered
10.9.4 SWOT Analysis
11. Use Cases and Best Practices
12. Conclusion
An accurate research report requires proper strategizing as well as implementation. There are multiple factors involved in the completion of good and accurate research report and selecting the best methodology to compete the research is the toughest part. Since the research reports we provide play a crucial role in any company’s decision-making process, therefore we at SNS Insider always believe that we should choose the best method which gives us results closer to reality. This allows us to reach at a stage wherein we can provide our clients best and accurate investment to output ratio.
Each report that we prepare takes a timeframe of 350-400 business hours for production. Starting from the selection of titles through a couple of in-depth brain storming session to the final QC process before uploading our titles on our website we dedicate around 350 working hours. The titles are selected based on their current market cap and the foreseen CAGR and growth.
The 5 steps process:
Step 1: Secondary Research:
Secondary Research or Desk Research is as the name suggests is a research process wherein, we collect data through the readily available information. In this process we use various paid and unpaid databases which our team has access to and gather data through the same. This includes examining of listed companies’ annual reports, Journals, SEC filling etc. Apart from this our team has access to various associations across the globe across different industries. Lastly, we have exchange relationships with various university as well as individual libraries.

Step 2: Primary Research
When we talk about primary research, it is a type of study in which the researchers collect relevant data samples directly, rather than relying on previously collected data. This type of research is focused on gaining content specific facts that can be sued to solve specific problems. Since the collected data is fresh and first hand therefore it makes the study more accurate and genuine.
We at SNS Insider have divided Primary Research into 2 parts.
Part 1 wherein we interview the KOLs of major players as well as the upcoming ones across various geographic regions. This allows us to have their view over the market scenario and acts as an important tool to come closer to the accurate market numbers. As many as 45 paid and unpaid primary interviews are taken from both the demand and supply side of the industry to make sure we land at an accurate judgement and analysis of the market.
This step involves the triangulation of data wherein our team analyses the interview transcripts, online survey responses and observation of on filed participants. The below mentioned chart should give a better understanding of the part 1 of the primary interview.

Part 2: In this part of primary research the data collected via secondary research and the part 1 of the primary research is validated with the interviews from individual consultants and subject matter experts.
Consultants are those set of people who have at least 12 years of experience and expertise within the industry whereas Subject Matter Experts are those with at least 15 years of experience behind their back within the same space. The data with the help of two main processes i.e., FGDs (Focused Group Discussions) and IDs (Individual Discussions). This gives us a 3rd party nonbiased primary view of the market scenario making it a more dependable one while collation of the data pointers.
Step 3: Data Bank Validation
Once all the information is collected via primary and secondary sources, we run that information for data validation. At our intelligence centre our research heads track a lot of information related to the market which includes the quarterly reports, the daily stock prices, and other relevant information. Our data bank server gets updated every fortnight and that is how the information which we collected using our primary and secondary information is revalidated in real time.

Step 4: QA/QC Process
After all the data collection and validation our team does a final level of quality check and quality assurance to get rid of any unwanted or undesired mistakes. This might include but not limited to getting rid of the any typos, duplication of numbers or missing of any important information. The people involved in this process include technical content writers, research heads and graphics people. Once this process is completed the title gets uploader on our platform for our clients to read it.
Step 5: Final QC/QA Process:
This is the last process and comes when the client has ordered the study. In this process a final QA/QC is done before the study is emailed to the client. Since we believe in giving our clients a good experience of our research studies, therefore, to make sure that we do not lack at our end in any way humanly possible we do a final round of quality check and then dispatch the study to the client.
Key Segmentation:
By Product
Nickel-Titanium (Nitinol) Alloys
Copper-Based Alloys
Others
By End Use
Biomedical
Automotive
Aerospace & Defense
Consumer Electronics & Household
Others
Request for Segment Customization as per your Business Requirement: Segment Customization Request
Regional Coverage:
North America
US
Canada
Mexico
Europe
Eastern Europe
Poland
Romania
Hungary
Turkey
Rest of Eastern Europe
Western Europe
Germany
France
UK
Italy
Spain
Netherlands
Switzerland
Austria
Rest of Western Europe
Asia Pacific
China
India
Japan
South Korea
Vietnam
Singapore
Australia
Rest of Asia Pacific
Middle East & Africa
Middle East
UAE
Egypt
Saudi Arabia
Qatar
Rest of Middle East
Africa
Nigeria
South Africa
Rest of Africa
Latin America
Brazil
Argentina
Colombia
Rest of Latin America
Request for Country Level Research Report: Country Level Customization Request
Available Customization
With the given market data, SNS Insider offers customization as per the company’s specific needs. The following customization options are available for the report:
Detailed Volume Analysis
Criss-Cross segment analysis (e.g. Product X Application)
Competitive Product Benchmarking
Geographic Analysis
Additional countries in any of the regions
Customized Data Representation
Detailed analysis and profiling of additional market players
Gas Analyzer, Sensor & Detector Market was estimated at USD 4.31 Bn in 2023 and is expected to reach USD 7.40 Bn by 2032, growing CAGR of 6.19% from 2024-2032.
The Industrial Air Filtration Market size was valued at USD 7.33 Billion in 2023 and is expected to reach USD 12.83 Billion by 2032 and grow at a CAGR of 6.42% over the forecast period 2024-2032.
Industrial Cooling System Market was estimated at USD 21.07 Bn in 2023 and is expected to arrive at USD 34.15 Bn by 2032, at a CAGR of 5.51% from 2024-2032.
The Material Testing Market Size was estimated at USD 5.98 billion in 2023 and is expected to arrive at USD 8.93 billion by 2032 with a growing CAGR of 4.55% over the forecast period 2024-2032.
The Pre-Insulated Pipes Market Size was valued at USD 7.30 Billion in 2023 and is expected to reach USD 14.76 Billion by 2032 and grow at a CAGR of 8.22% over the forecast period 2024-2032.
Modular Robotics Market size was estimated at USD 10.51 billion in 2023 and is expected to reach USD 47.44 billion by 2032 at a CAGR of 18.23% during the forecast period of 2024-2032.

Hi! Click one of our member below to chat on Phone
© 2025 All Rights Reserved by SNS Insider Pvt Ltd


