image

Service Virtualization Market Report Scope & Overview:

Service Virtualization Market Revenue Analysis

Get More Information on Service Virtualization Market - Request Sample Report

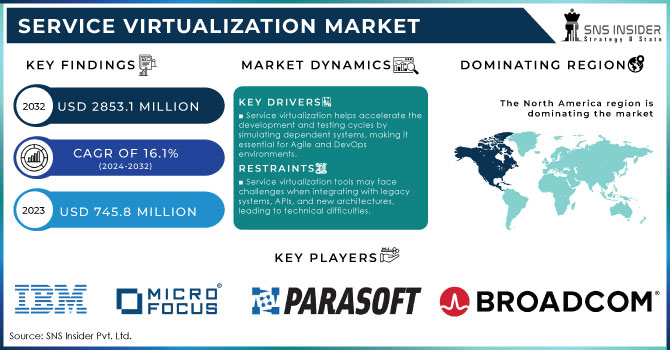
The Service Virtualization Market Share was valued at USD 745.8 Million in 2023 and is expected to reach USD 2853.1 Million by 2032, growing at a CAGR of 16.1% over the forecast period 2024-2032.

The service virtualization market is growing rapidly due to the vast scope of digitalization across industries. Governments are driving this change through increased investments in digital infrastructures. In developed countries, the need for advanced digital services is leading to high demand for service virtualization. Different governments have reported their financial contributions toward improving their digital infrastructure. The United States government contributed $65 billion to improve digital services and broadband access through the 2021 Infrastructure Investment and Jobs Act. This investment is channeled to solutions such as cloud services and automation, which directly benefit the service virtualization market. The high demand for service virtualization is due to its cost-saving benefits. Organizations can reduce testing and development costs and shorten the time required for new services or applications to reach the market. This benefit is appealing to government agencies seeking to streamline their IT processes. In 2023, the U.S. Department of Defense spent 10% more on IT infrastructure modernization. The organization continued to demonstrate its interest in service virtualization through its budgets. These investments show that service virtualization is quickly becoming a universal solution to help governments and other organizations meet their digitalization ambitions. It is worth noting that other governments also report investments in technological advancements that indicate future market growth. The service virtualization market can be expected to thrive as governments invest in technological improvements.

Digitalization is a growing trend across industries. Different companies are working to modernize their IT infrastructure to adapt to the growing demand for their services to be delivered digitally. One of the most appealing benefits of service virtualization is that companies can test systems in a simulated environment before deploying them. Such testing can occur in the early stages of application development and continue throughout the lifecycle of a specific solution. By enabling continuous testing, organizations can reduce the time-to-market for their applications. Attrition is one of the significant features of today’s competitive market. It is essential for companies to ensure that their applications reach the market as quickly as possible. Additionally, the development teams, in most companies are expected to go the extra mile to test these systems effectively. The use of Agile and DevOps methodologies is one sure way of enhancing the delivery of new applications. However, these methodologies are dependent on continuous integration and continuous delivery. Their use is hampered by the inability to test the new application as it pertains to other software. Service virtualization resolves this by enabling developers to test software without undue delays. As the demand for service virtualization continues to grow, it is expected to become a universal standard for companies running multi-cloud or hybrid systems. Testing in such environments is difficult due to reliance on software supported by multiple cloud providers and these in on-premises systems.

Service Virtualization Market Dynamics

Drivers

  • Service virtualization helps accelerate the development and testing cycles by simulating dependent systems, making it essential for Agile and DevOps environments.

  • By simulating expensive third-party services or systems in a test environment, service virtualization reduces infrastructure costs, making it a cost-effective solution for enterprises.

  • With the expansion of microservices, cloud computing, and APIs, service virtualization helps in simplifying the testing of complex, interdependent systems.

  • The demand for faster releases and enhanced user experiences across digital platforms is driving organizations to adopt service virtualization to ensure quality without compromising on speed.

One of the key drivers of the Service Virtualization Market is the increased adoption of Agile and DevOps practices. These practices have been expanding rapidly across industries since they are beneficial for software development. They focus on continuous development and the rapid delivery of products, which involves testing multiple dependent systems and services. However, the development of a specific application can be delayed because not all systems and services are functional yet. Service virtualization allows the simulating of these missing systems, and the developers can test their applications as if they were in the real environment. According to the U.S. Digital Service, a federal government agency that advocates for modern tech solutions, currently, about 80% of development projects in the U.S. public sector are involved in the public sector. This demand is attributed to the necessity of rapid innovation in high-priority government projects in various spheres, such as healthcare, defense, citizen services, etc.

A good example is the Department of Veterans Affairs, which has been using service virtualization in the development of its digital health services platform and, as a result, was able to deliver health benefits and services for veterans faster. The U.S. Federal CIO Council has also accentuated the importance of this practice, mentioning that the use of virtualization tools helps save time by troubleshooting unavailable systems, an issue critical for both security testing and system functionality. Overall, the use of Agile and DevOps methodologies in the public sector has become one of the drivers of service virtualization because they help businesses develop software more effectively.

Restraints:

  • High Initial Setup and Maintenance Costs

  • Service virtualization tools may face challenges when integrating with legacy systems, APIs, and new architectures, leading to technical difficulties.

  • Despite its benefits, there is still limited awareness about service virtualization, and the lack of skilled professionals poses a barrier to its widespread adoption.

One of the main restraints in the Service Virtualization Market is high initial setup and maintenance costs. Deploying service virtualization is associated with the use of complicated software tools, and specialized personnel to implement such tools, and incorporate them into the existing IT environment. Smaller to medium-sized enterprises might not have the budget to afford such deployment. Moreover, the system will require regular updates, and day-to-day maintenance, and need to be compatible with the latest technology solutions, meaning long-term operational costs. Therefore, for smaller business organizations, it will be challenging from a financial perspective to decide to implement such a form of support, despite the fact that it can streamline many of their testing and development processes. At this point, larger companies will have more resources at their disposal to afford such investment, meaning that currently, they are the leading adopters, while smaller players will be lagging.

Service Virtualization Market Segmentation:

By Component

The largest revenue share was held by the service segment in the service virtualization market by component, which accounted for 68% of the market in 2023. Demand for virtualized testing and service environments that help applications drive application development cycles is the key driving force behind the service’s dominance in the market. Business development is facilitated by testing various acquisitions of applications. and other simulation APIs, databases, and service virtualization components in databases without using real-time physical resources and real testing frameworks. This is important for developers in the banking, healthcare, and telecommunications sectors because the speed and efficiency of development are critical to gaining a competitive advantage.

On the other hand, the software segment is expected to grow at the fastest compound annual growth rate over the forecast period. With the emergence of continuous integration and continuous delivery applications driving demand for advanced software, this is the best way to replicate ICD processes. Another factor contributing to demand is that an increasing number of virtualization software is being combined with artificial intelligence and machine learning, thereby attracting investment. Governments are also funding software development to improve national security facilities and public services. The European Union is a typical example of a recent statistical shift in government funding for the development of software based on artificial intelligence, thereby increasing the size of the software segment in service virtualization by 12%.

By Enterprise Size

The largest market revenue share in the service virtualization market was held by large enterprises in 2023. As such organizations have complex infrastructure, the number of applications and services that need to be implemented is vast. Thus, such enterprises can capitalize on service virtualization as they can reduce costs associated with the development and testing processes. Government policies encourage large organizations to pursue digital transformation, especially in the finance, health, and utility sectors. Accordingly, the United States government reports that large enterprises benefited from the $150 billion investment in enhancing digital infrastructure, with more than 40% of the budget spent on such technologies as cloud computing and virtualization. As a result, the service virtualization market is greatly impacted by these initiatives since large organizations require powerful, secure, and scalable solutions helping them to stay competitive and compliant. With the strong support from the government in implementing technologies aimed at modernization and increased returns, the dominance of large enterprises in the market is expected to continue. As a result, the service virtualization industry will accelerate its growth.

By End-Use

In terms of end-use, the IT and telecommunications segment accounted for the largest market revenue share in 2023. The dominance of this sector is primarily due to its rapid digital transformation, the increasing use of cloud services, and a vital need for continuous software development and testing. Specifically, with the help of service virtualization, IT and telecommunications companies can simulate complex environments to test new services and applications, thus significantly reducing the time-to-market.

The IT and telecommunications sector is highly competitive and the ability of companies to innovate and deliver services quickly and efficiently is the critical success factor, such a benefit is particularly essential. The trend is supported by a study conducted by the government, confirming that the implementation of service virtualization has been at the level of 35% of IT and telecommunications companies in North America and Europe in 2023. In Japan, where the modernization of telecommunications infrastructure is a top governmental priority, the use of virtualized services in the telecom sector increased by 15%. As IT and telecommunications companies continue to expand their service offerings, incorporating 5G networks, for example, the use of the service virtualization tool is expected to increase.

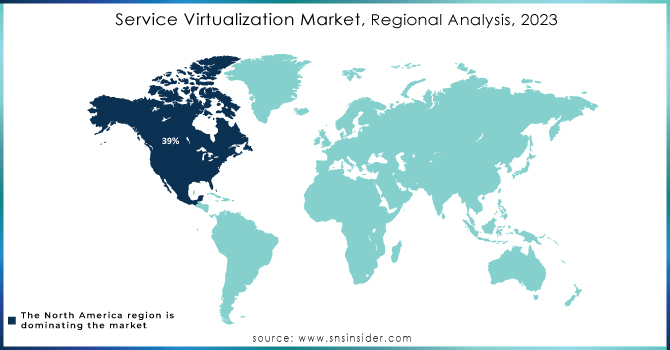
Service Virtualization Market Regional Dominance

In 2023, North America led the service virtualization market, accounting for over 39% of the global market share. This dominance is associated with established technology companies, developed IT infrastructure, and the increased uptake of cloud services. The U.S. government has been at the forefront of modernizing its operations to ensure it uses the latest technology in its operations. The government has developed cloud computing, automation, and other system solutions. According to information from the U.S. Bureau of Economic Analysis, the federal government investment in digital service and infrastructure rose by over 8% in 2023. This investment has led to a relatively high number of clients seeking service virtualization solutions in various sectors.

Furthermore, the presence of major market players, such as CA Technologies, IBM Corporation, and Microsoft Corporation, among others, in the North American region also supports the platform’s growth. The U.S. government has been implementing modern technology in both public and private entities in efforts to modernize their operations. The ongoing improvement in digital operations in healthcare, finance, and defense sectors under the private-public partnership will maintain North America’s lead in the service virtualization platform throughout the forecast period.

The Asia Pacific service virtualization market is expected to expand at a rapid pace and record the fastest CAGR during the forecast period. This expansion is fuelled by a rapid shift towards digital transformation in the financial, telecommunication, and healthcare sectors which accelerates the demand for service virtualization for efficient software development process and cost-effectiveness. The emerging cloud infrastructure in countries, including China, India, and Japan, drives the demand for the development of complex applications. In China, a robust 5G network, rapid IoT growth demand testing environment, and government schemes that facilitate R&D investments accelerate time-to-market for the new technology solutions.

Service-Virtualization-Market-Regional-Analysis-2023

Need any customization research on Service Virtualization Market - Enquiry Now

Latest Market News

  • In July 2024, the U.S. Department of Defence announced a partnership with the leading service virtualization vendor, CA Technologies, which is expected to help in testing the department’s IT infrastructure through advanced virtualization technologies.

  • In August 2024, the European Commission declared that it would invest € 500 million in cloud and virtualization technologies, which would help to improve and strengthen its IT and telecommunications market and make it more innovative and swifter in development.

  • In June 2024, Broadcom released an update of its leading VMware Cloud Foundation, which is aimed at helping organizations become more digitally innovative via accelerated modernization of infrastructure, as well as more productive in software development and cyber resiliency.

  • In April 2024, Microsoft and Cloud Software Group signed a strategic eight-year-long agreement, according to which the latter plans to invest $1.65 billion in the delivery of cloud and AI services from the former. This partnership is expected to assist in the creation of integrated products and marketing campaigns, which should improve the productivity of the companies’ 100 million clients and positively influence the development of AI technology.

Key Players in Service Virtualization Market

  • CA Technologies (Broadcom) – (CA Service Virtualization, CA DevTest)

  • IBM Corporation – (Rational Test Virtualization Server, IBM Rational Integration Tester)

  • Micro Focus – (Service Virtualization, LoadRunner Professional)

  • Parasoft – (Parasoft Virtualize, Parasoft SOAtest)

  • SmartBear Software – (ReadyAPI Virtualization, TestComplete)

  • Cavisson Systems – (Cavisson Service Virtualization, NetStorm)

  • Tricentis – (Tosca, Tricentis Virtualize)

  • Broadcom Inc. – (Broadcom DevTest, Broadcom Service Virtualization)

  • Maveric Systems – (Maveric Service Virtualization, Maveric Continuous Testing)

  • Wipro Limited – (Wipro HOLMES™, Wipro Virtualization Solutions)

  • Cognizant Technology Solutions – (Cognizant Testing Services, Cognizant Virtualization)

  • Sogeti (Capgemini) – (Sogeti Testing Services, Virtualization Platform)

  • Infosys Limited – (Infosys Virtualization Service, Infosys Test Automation)

  • Accenture – (Accenture Cloud Virtualization, Accenture Service Testing)

  • Tata Consultancy Services (TCS) – (TCS Service Virtualization, TCS Testing Services)

  • Delphix – (Delphix Data Platform, Delphix Virtualization)

  • Quali Systems – (CloudShell, Quali Service Virtualization)

  • QASymphony – (qTest, Service Virtualization)

  • Vector Software – (VectorCAST Virtualization, VectorCAST Test)

  • Tech Mahindra – (Tech Mahindra Virtualization Suite, Service Virtualization Framework), and others.

Service Virtualization Market Report Scope

Report Attributes Details
Market Size in 2023 US$ 745.8 Million
Market Size by 2032 US$ 2853.1 Million
CAGR CAGR of 16.1% From 2024 to 2032
Base Year 2023
Forecast Period 2024-2032
Historical Data 2020-2022
Report Scope & Coverage Market Size, Segments Analysis, Competitive  Landscape, Regional Analysis, DROC & SWOT Analysis, Forecast Outlook
Key Segments • By Component (Software, Service)
• By Enterprise Size (Large Enterprise, SMEs)
• By Deployment (Cloud, On-premise)
• By End Use (BFSI, Healthcare, IT & Telecommunication, Automotive, Retail & E-Commerce, Others)
Regional Analysis/Coverage North America (US, Canada, Mexico), Europe (Eastern Europe [Poland, Romania, Hungary, Turkey, Rest of Eastern Europe] Western Europe] Germany, France, UK, Italy, Spain, Netherlands, Switzerland, Austria, Rest of Western Europe]), Asia Pacific (China, India, Japan, South Korea, Vietnam, Singapore, Australia, Rest of Asia Pacific), Middle East & Africa (Middle East [UAE, Egypt, Saudi Arabia, Qatar, Rest of Middle East], Africa [Nigeria, South Africa, Rest of Africa], Latin America (Brazil, Argentina, Colombia, Rest of Latin America)
Company Profiles CA Technologies, IBM Corporation, Micro Focus, Parasoft, SmartBear Software, Cavisson Systems, Tricentis, Broadcom Inc., Maveric Systems, Wipro Limited, Cognizant Technology Solutions, Infosys Limited, Accenture, Tata Consultancy Services (TCS), Delphix, Quali Systems, Tech Mahindra and other key players
Key Drivers • By simulating expensive third-party services or systems in a test environment, service virtualization reduces infrastructure costs, making it a cost-effective solution for enterprises
• The demand for faster releases and enhanced user experiences across digital platforms is driving organizations to adopt service virtualization to ensure quality without compromising on speed.
RESTRAINTS • Service virtualization tools may face challenges when integrating with legacy systems, APIs, and new architectures, leading to technical difficulties

Frequently Asked Questions

Ans. The projected market size for the Service Virtualization Market is USD 2853.1 Million by 2032.

Ans: The Service Component segment dominated the Service Virtualization Market.

Ans: The North American region dominated the Service Virtualization Market in 2023.

Ans. The CAGR of the Service Virtualization Market is 16.1% During the forecast period of 2024-2032.

Ans:

  • Service virtualization helps accelerate the development and testing cycles by simulating dependent systems, making it essential for Agile and DevOps environments.

  • By simulating expensive third-party services or systems in a test environment, service virtualization reduces infrastructure costs, making it a cost-effective solution for enterprises.

Table of Contents:

1. Introduction

1.1 Market Definition

1.2 Scope (Inclusion and Exclusions)

1.3 Research Assumptions

2. Executive Summary

2.1 Market Overview

2.2 Regional Synopsis

2.3 Competitive Summary

3. Research Methodology

3.1 Top-Down Approach

3.2 Bottom-up Approach

3.3. Data Validation

3.4 Primary Interviews

4. Market Dynamics Impact Analysis

4.1 Market Driving Factors Analysis

4.1.1 Drivers

4.1.2 Restraints

4.1.3 Opportunities

4.1.4 Challenges

4.2 PESTLE Analysis

4.3 Porter’s Five Forces Model

5. Statistical Insights and Trends Reporting

5.1 Adoption Rates of Emerging Technologies

5.2 Network Infrastructure Expansion, by Region

5.3 Cybersecurity Incidents, by Region (2020-2023)

5.4 Cloud Services Usage, by Region

6. Competitive Landscape

6.1 List of Major Companies, By Region

6.2 Market Share Analysis, By Region

6.3 Type Benchmarking

6.3.1 Type specifications and features

6.3.2 Pricing

6.4 Strategic Initiatives

6.4.1 Marketing and promotional activities

6.4.2 Distribution and supply chain strategies

6.4.3 Expansion plans and new Age Cohort launches

6.4.4 Strategic partnerships and collaborations

6.5 Technological Advancements

6.6 Market Positioning and Branding

7. Service Virtualization Market Segmentation, By Component

7.1 Chapter Overview

7.2 Software

7.2.1 Software Market Trends Analysis (2020-2032)

7.2.2 Software Market Size Estimates and Forecasts to 2032 (USD Million)

7.3 Service

7.3.1 Service Market Trends Analysis (2020-2032)

7.3.2 Service Market Size Estimates and Forecasts to 2032 (USD Million)

8. Service Virtualization Market Segmentation, By Enterprise Size

8.1 Chapter Overview

8.2 Large Enterprise

8.2.1 Large Enterprise Market Trends Analysis (2020-2032)

8.2.2 Large Enterprise Market Size Estimates and Forecasts to 2032 (USD Million)

8.3 SMEs

8.3.1 SMEs Market Trends Analysis (2020-2032)

8.3.2 SMEs Market Size Estimates and Forecasts to 2032 (USD Million)

9. Service Virtualization Market Segmentation, By Deployment

9.1 Chapter Overview

9.2 Cloud

9.2.1 Cloud Market Trends Analysis (2020-2032)

9.2.2 Cloud Market Size Estimates and Forecasts to 2032 (USD Million)

9.3 On-premise

9.3.1 On-premise Market Trends Analysis (2020-2032)

9.3.2 On-premise Market Size Estimates and Forecasts to 2032 (USD Million)

10. Service Virtualization Market Segmentation, By End Use

10.1 Chapter Overview

10.2 BFSI

         10.2.1 BFSI Market Trends Analysis (2020-2032)

10.2.2 BFSI Market Size Estimates and Forecasts to 2032 (USD Million)

10.3 Healthcare

         10.3.1 Healthcare Market Trends Analysis (2020-2032)

10.3.2 Healthcare Market Size Estimates and Forecasts to 2032 (USD Million)

10.4 IT & Telecommunication

         10.4.1 IT & Telecommunication Market Trends Analysis (2020-2032)

10.4.2 IT & Telecommunication Market Size Estimates and Forecasts to 2032 (USD Million)

10.5 Automotive

         10.5.1 Automotive Market Trends Analysis (2020-2032)

10.5.2 Automotive Market Size Estimates and Forecasts to 2032 (USD Million)

10.6 Retail & E-Commerce

         10.6.1 Retail & E-Commerce Market Trends Analysis (2020-2032)

10.6.2 Retail & E-Commerce Market Size Estimates and Forecasts to 2032 (USD Million)

10.7 Others

         10.7.1 Others Market Trends Analysis (2020-2032)

10.7.2 Others Market Size Estimates and Forecasts to 2032 (USD Million)

11. Regional Analysis

11.1 Chapter Overview

11.2 North America

11.2.1 Trends Analysis

11.2.2 North America Service Virtualization Market Estimates and Forecasts, by Country (2020-2032) (USD Million)

11.2.3 North America Service Virtualization Market Estimates and Forecasts, By Component (2020-2032) (USD Million)

11.2.4 North America Service Virtualization Market Estimates and Forecasts, By Enterprise Size (2020-2032) (USD Million)

11.2.5 North America Service Virtualization Market Estimates and Forecasts, By Deployment (2020-2032) (USD Million)

11.2.6 North America Service Virtualization Market Estimates and Forecasts, By End Use (2020-2032) (USD Million)

11.2.7 USA

11.2.7.1 USA Service Virtualization Market Estimates and Forecasts, By Component (2020-2032) (USD Million)

11.2.7.2 USA Service Virtualization Market Estimates and Forecasts, By Enterprise Size (2020-2032) (USD Million)

11.2.7.3 USA Service Virtualization Market Estimates and Forecasts, By Deployment (2020-2032) (USD Million)

11.2.7.4 USA Service Virtualization Market Estimates and Forecasts, By End Use (2020-2032) (USD Million)

11.2.8 Canada

11.2.8.1 Canada Service Virtualization Market Estimates and Forecasts, By Component (2020-2032) (USD Million)

11.2.8.2 Canada Service Virtualization Market Estimates and Forecasts, By Enterprise Size (2020-2032) (USD Million)

11.2.8.3 Canada Service Virtualization Market Estimates and Forecasts, By Deployment (2020-2032) (USD Million)

11.2.8.4 Canada Service Virtualization Market Estimates and Forecasts, By End Use (2020-2032) (USD Million)

11.2.9 Mexico

11.2.9.1 Mexico Service Virtualization Market Estimates and Forecasts, By Component (2020-2032) (USD Million)

11.2.9.2 Mexico Service Virtualization Market Estimates and Forecasts, By Enterprise Size (2020-2032) (USD Million)

11.2.9.3 Mexico Service Virtualization Market Estimates and Forecasts, By Deployment (2020-2032) (USD Million)

11.2.9.4 Mexico Service Virtualization Market Estimates and Forecasts, By End Use (2020-2032) (USD Million)

11.3 Europe

11.3.1 Eastern Europe

11.3.1.1 Trends Analysis

11.3.1.2 Eastern Europe Service Virtualization Market Estimates and Forecasts, by Country (2020-2032) (USD Million)

11.3.1.3 Eastern Europe Service Virtualization Market Estimates and Forecasts, By Component (2020-2032) (USD Million)

11.3.1.4 Eastern Europe Service Virtualization Market Estimates and Forecasts, By Enterprise Size (2020-2032) (USD Million)

11.3.1.5 Eastern Europe Service Virtualization Market Estimates and Forecasts, By Deployment (2020-2032) (USD Million)

11.3.1.6 Eastern Europe Service Virtualization Market Estimates and Forecasts, By End Use (2020-2032) (USD Million)

11.3.1.7 Poland

11.3.1.7.1 Poland Service Virtualization Market Estimates and Forecasts, By Component (2020-2032) (USD Million)

11.3.1.7.2 Poland Service Virtualization Market Estimates and Forecasts, By Enterprise Size (2020-2032) (USD Million)

11.3.1.7.3 Poland Service Virtualization Market Estimates and Forecasts, By Deployment (2020-2032) (USD Million)

11.3.1.7.4 Poland Service Virtualization Market Estimates and Forecasts, By End Use (2020-2032) (USD Million)

11.3.1.8 Romania

11.3.1.8.1 Romania Service Virtualization Market Estimates and Forecasts, By Component (2020-2032) (USD Million)

11.3.1.8.2 Romania Service Virtualization Market Estimates and Forecasts, By Enterprise Size (2020-2032) (USD Million)

11.3.1.8.3 Romania Service Virtualization Market Estimates and Forecasts, By Deployment (2020-2032) (USD Million)

11.3.1.8.4 Romania Service Virtualization Market Estimates and Forecasts, By End Use (2020-2032) (USD Million)

11.3.1.9 Hungary

11.3.1.9.1 Hungary Service Virtualization Market Estimates and Forecasts, By Component (2020-2032) (USD Million)

11.3.1.9.2 Hungary Service Virtualization Market Estimates and Forecasts, By Enterprise Size (2020-2032) (USD Million)

11.3.1.9.3 Hungary Service Virtualization Market Estimates and Forecasts, By Deployment (2020-2032) (USD Million)

11.3.1.9.4 Hungary Service Virtualization Market Estimates and Forecasts, By End Use (2020-2032) (USD Million)

11.3.1.10 Turkey

11.3.1.10.1 Turkey Service Virtualization Market Estimates and Forecasts, By Component (2020-2032) (USD Million)

11.3.1.10.2 Turkey Service Virtualization Market Estimates and Forecasts, By Enterprise Size (2020-2032) (USD Million)

11.3.1.10.3 Turkey Service Virtualization Market Estimates and Forecasts, By Deployment (2020-2032) (USD Million)

11.3.1.10.4 Turkey Service Virtualization Market Estimates and Forecasts, By End Use (2020-2032) (USD Million)

11.3.1.11 Rest of Eastern Europe

11.3.1.11.1 Rest of Eastern Europe Service Virtualization Market Estimates and Forecasts, By Component (2020-2032) (USD Million)

11.3.1.11.2 Rest of Eastern Europe Service Virtualization Market Estimates and Forecasts, By Enterprise Size (2020-2032) (USD Million)

11.3.1.11.3 Rest of Eastern Europe Service Virtualization Market Estimates and Forecasts, By Deployment (2020-2032) (USD Million)

11.3.1.11.4 Rest of Eastern Europe Service Virtualization Market Estimates and Forecasts, By End Use (2020-2032) (USD Million)

11.3.2 Western Europe

11.3.2.1 Trends Analysis

11.3.2.2 Western Europe Service Virtualization Market Estimates and Forecasts, by Country (2020-2032) (USD Million)

11.3.2.3 Western Europe Service Virtualization Market Estimates and Forecasts, By Component (2020-2032) (USD Million)

11.3.2.4 Western Europe Service Virtualization Market Estimates and Forecasts, By Enterprise Size (2020-2032) (USD Million)

11.3.2.5 Western Europe Service Virtualization Market Estimates and Forecasts, By Deployment (2020-2032) (USD Million)

11.3.2.6 Western Europe Service Virtualization Market Estimates and Forecasts, By End Use (2020-2032) (USD Million)

11.3.2.7 Germany

11.3.2.7.1 Germany Service Virtualization Market Estimates and Forecasts, By Component (2020-2032) (USD Million)

11.3.2.7.2 Germany Service Virtualization Market Estimates and Forecasts, By Enterprise Size (2020-2032) (USD Million)

11.3.2.7.3 Germany Service Virtualization Market Estimates and Forecasts, By Deployment (2020-2032) (USD Million)

11.3.2.7.4 Germany Service Virtualization Market Estimates and Forecasts, By End Use (2020-2032) (USD Million)

11.3.2.8 France

11.3.2.8.1 France Service Virtualization Market Estimates and Forecasts, By Component (2020-2032) (USD Million)

11.3.2.8.2 France Service Virtualization Market Estimates and Forecasts, By Enterprise Size (2020-2032) (USD Million)

11.3.2.8.3 France Service Virtualization Market Estimates and Forecasts, By Deployment (2020-2032) (USD Million)

11.3.2.8.4 France Service Virtualization Market Estimates and Forecasts, By End Use (2020-2032) (USD Million)

11.3.2.9 UK

11.3.2.9.1 UK Service Virtualization Market Estimates and Forecasts, By Component (2020-2032) (USD Million)

11.3.2.9.2 UK Service Virtualization Market Estimates and Forecasts, By Enterprise Size (2020-2032) (USD Million)

11.3.2.9.3 UK Service Virtualization Market Estimates and Forecasts, By Deployment (2020-2032) (USD Million)

11.3.2.9.4 UK Service Virtualization Market Estimates and Forecasts, By End Use (2020-2032) (USD Million)

11.3.2.10 Italy

11.3.2.10.1 Italy Service Virtualization Market Estimates and Forecasts, By Component (2020-2032) (USD Million)

11.3.2.10.2 Italy Service Virtualization Market Estimates and Forecasts, By Enterprise Size (2020-2032) (USD Million)

11.3.2.10.3 Italy Service Virtualization Market Estimates and Forecasts, By Deployment (2020-2032) (USD Million)

11.3.2.10.4 Italy Service Virtualization Market Estimates and Forecasts, By End Use (2020-2032) (USD Million)

11.3.2.11 Spain

11.3.2.11.1 Spain Service Virtualization Market Estimates and Forecasts, By Component (2020-2032) (USD Million)

11.3.2.11.2 Spain Service Virtualization Market Estimates and Forecasts, By Enterprise Size (2020-2032) (USD Million)

11.3.2.11.3 Spain Service Virtualization Market Estimates and Forecasts, By Deployment (2020-2032) (USD Million)

11.3.2.11.4 Spain Service Virtualization Market Estimates and Forecasts, By End Use (2020-2032) (USD Million)

11.3.2.12 Netherlands

11.3.2.12.1 Netherlands Service Virtualization Market Estimates and Forecasts, By Component (2020-2032) (USD Million)

11.3.2.12.2 Netherlands Service Virtualization Market Estimates and Forecasts, By Enterprise Size (2020-2032) (USD Million)

11.3.2.12.3 Netherlands Service Virtualization Market Estimates and Forecasts, By Deployment (2020-2032) (USD Million)

11.3.2.12.4 Netherlands Service Virtualization Market Estimates and Forecasts, By End Use (2020-2032) (USD Million)

11.3.2.13 Switzerland

11.3.2.13.1 Switzerland Service Virtualization Market Estimates and Forecasts, By Component (2020-2032) (USD Million)

11.3.2.13.2 Switzerland Service Virtualization Market Estimates and Forecasts, By Enterprise Size (2020-2032) (USD Million)

11.3.2.13.3 Switzerland Service Virtualization Market Estimates and Forecasts, By Deployment (2020-2032) (USD Million)

11.3.2.13.4 Switzerland Service Virtualization Market Estimates and Forecasts, By End Use (2020-2032) (USD Million)

11.3.2.14 Austria

11.3.2.14.1 Austria Service Virtualization Market Estimates and Forecasts, By Component (2020-2032) (USD Million)

11.3.2.14.2 Austria Service Virtualization Market Estimates and Forecasts, By Enterprise Size (2020-2032) (USD Million)

11.3.2.14.3 Austria Service Virtualization Market Estimates and Forecasts, By Deployment (2020-2032) (USD Million)

11.3.2.14.4 Austria Service Virtualization Market Estimates and Forecasts, By End Use (2020-2032) (USD Million)

11.3.2.15 Rest of Western Europe

11.3.2.15.1 Rest of Western Europe Service Virtualization Market Estimates and Forecasts, By Component (2020-2032) (USD Million)

11.3.2.15.2 Rest of Western Europe Service Virtualization Market Estimates and Forecasts, By Enterprise Size (2020-2032) (USD Million)

11.3.2.15.3 Rest of Western Europe Service Virtualization Market Estimates and Forecasts, By Deployment (2020-2032) (USD Million)

11.3.2.15.4 Rest of Western Europe Service Virtualization Market Estimates and Forecasts, By End Use (2020-2032) (USD Million)

11.4 Asia Pacific

11.4.1 Trends Analysis

11.4.2 Asia Pacific Service Virtualization Market Estimates and Forecasts, by Country (2020-2032) (USD Million)

11.4.3 Asia Pacific Service Virtualization Market Estimates and Forecasts, By Component (2020-2032) (USD Million)  

11.4.4 Asia Pacific Service Virtualization Market Estimates and Forecasts, By Enterprise Size (2020-2032) (USD Million)

11.4.5 Asia Pacific Service Virtualization Market Estimates and Forecasts, By Deployment (2020-2032) (USD Million)

11.4.6 Asia Pacific Service Virtualization Market Estimates and Forecasts, By End Use (2020-2032) (USD Million)

11.4.7 China

11.4.7.1 China Service Virtualization Market Estimates and Forecasts, By Component (2020-2032) (USD Million)

11.4.7.2 China Service Virtualization Market Estimates and Forecasts, By Enterprise Size (2020-2032) (USD Million)

11.4.7.3 China Service Virtualization Market Estimates and Forecasts, By Deployment (2020-2032) (USD Million)

11.4.7.4 China Service Virtualization Market Estimates and Forecasts, By End Use (2020-2032) (USD Million)

11.4.8 India

11.4.8.1 India Service Virtualization Market Estimates and Forecasts, By Component (2020-2032) (USD Million)

11.4.8.2 India Service Virtualization Market Estimates and Forecasts, By Enterprise Size (2020-2032) (USD Million)

11.4.8.3 India Service Virtualization Market Estimates and Forecasts, By Deployment (2020-2032) (USD Million)

11.4.8.4 India Service Virtualization Market Estimates and Forecasts, By End Use (2020-2032) (USD Million)

11.4.9 Japan

11.4.9.1 Japan Service Virtualization Market Estimates and Forecasts, By Component (2020-2032) (USD Million)

11.4.9.2 Japan Service Virtualization Market Estimates and Forecasts, By Enterprise Size (2020-2032) (USD Million)

11.4.9.3 Japan Service Virtualization Market Estimates and Forecasts, By Deployment (2020-2032) (USD Million)

11.4.9.4 Japan Service Virtualization Market Estimates and Forecasts, By End Use (2020-2032) (USD Million)

11.4.10 South Korea

11.4.10.1 South Korea Service Virtualization Market Estimates and Forecasts, By Component (2020-2032) (USD Million)

11.4.10.2 South Korea Service Virtualization Market Estimates and Forecasts, By Enterprise Size (2020-2032) (USD Million)

11.4.10.3 South Korea Service Virtualization Market Estimates and Forecasts, By Deployment (2020-2032) (USD Million)

11.4.10.4 South Korea Service Virtualization Market Estimates and Forecasts, By End Use (2020-2032) (USD Million)

11.4.11 Vietnam

11.4.11.1 Vietnam Service Virtualization Market Estimates and Forecasts, By Component (2020-2032) (USD Million)

11.4.11.2 Vietnam Service Virtualization Market Estimates and Forecasts, By Enterprise Size (2020-2032) (USD Million)

11.4.11.3 Vietnam Service Virtualization Market Estimates and Forecasts, By Deployment (2020-2032) (USD Million)

11.4.11.4 Vietnam Service Virtualization Market Estimates and Forecasts, By End Use (2020-2032) (USD Million)

11.4.12 Singapore

11.4.12.1 Singapore Service Virtualization Market Estimates and Forecasts, By Component (2020-2032) (USD Million)

11.4.12.2 Singapore Service Virtualization Market Estimates and Forecasts, By Enterprise Size (2020-2032) (USD Million)

11.4.12.3 Singapore Service Virtualization Market Estimates and Forecasts, By Deployment (2020-2032) (USD Million)

11.4.12.4 Singapore Service Virtualization Market Estimates and Forecasts, By End Use (2020-2032) (USD Million)

11.4.13 Australia

11.4.13.1 Australia Service Virtualization Market Estimates and Forecasts, By Component (2020-2032) (USD Million)

11.4.13.2 Australia Service Virtualization Market Estimates and Forecasts, By Enterprise Size (2020-2032) (USD Million)

11.4.13.3 Australia Service Virtualization Market Estimates and Forecasts, By Deployment (2020-2032) (USD Million)

11.4.13.4 Australia Service Virtualization Market Estimates and Forecasts, By End Use (2020-2032) (USD Million)

11.4.14 Rest of Asia Pacific

11.4.14.1 Rest of Asia Pacific Service Virtualization Market Estimates and Forecasts, By Component (2020-2032) (USD Million)

11.4.14.2 Rest of Asia Pacific Service Virtualization Market Estimates and Forecasts, By Enterprise Size (2020-2032) (USD Million)

11.4.14.3 Rest of Asia Pacific Service Virtualization Market Estimates and Forecasts, By Deployment (2020-2032) (USD Million)

11.4.14.4 Rest of Asia Pacific Service Virtualization Market Estimates and Forecasts, By End Use (2020-2032) (USD Million)

11.5 Middle East and Africa

11.5.1 Middle East

11.5.1.1 Trends Analysis

11.5.1.2 Middle East Service Virtualization Market Estimates and Forecasts, by Country (2020-2032) (USD Million)

11.5.1.3 Middle East Service Virtualization Market Estimates and Forecasts, By Component (2020-2032) (USD Million)  

11.5.1.4 Middle East Service Virtualization Market Estimates and Forecasts, By Enterprise Size (2020-2032) (USD Million)

11.5.1.5 Middle East Service Virtualization Market Estimates and Forecasts, By Deployment (2020-2032) (USD Million)

11.5.1.6 Middle East Service Virtualization Market Estimates and Forecasts, By End Use (2020-2032) (USD Million)

11.5.1.7 UAE

11.5.1.7.1 UAE Service Virtualization Market Estimates and Forecasts, By Component (2020-2032) (USD Million)

11.5.1.7.2 UAE Service Virtualization Market Estimates and Forecasts, By Enterprise Size (2020-2032) (USD Million)

11.5.1.7.3 UAE Service Virtualization Market Estimates and Forecasts, By Deployment (2020-2032) (USD Million)

11.5.1.7.4 UAE Service Virtualization Market Estimates and Forecasts, By End Use  (2020-2032) (USD Million)

11.5.1.8 Egypt

11.5.1.8.1 Egypt Service Virtualization Market Estimates and Forecasts, By Component (2020-2032) (USD Million)

11.5.1.8.2 Egypt Service Virtualization Market Estimates and Forecasts, By Enterprise Size (2020-2032) (USD Million)

11.5.1.8.3 Egypt Service Virtualization Market Estimates and Forecasts, By Deployment (2020-2032) (USD Million)

11.5.1.8.4 Egypt Service Virtualization Market Estimates and Forecasts, By End Use (2020-2032) (USD Million)

11.5.1.9 Saudi Arabia

11.5.1.9.1 Saudi Arabia Service Virtualization Market Estimates and Forecasts, By Component (2020-2032) (USD Million)

11.5.1.9.2 Saudi Arabia Service Virtualization Market Estimates and Forecasts, By Enterprise Size (2020-2032) (USD Million)

11.5.1.9.3 Saudi Arabia Service Virtualization Market Estimates and Forecasts, By Deployment (2020-2032) (USD Million)

11.5.1.9.4 Saudi Arabia Service Virtualization Market Estimates and Forecasts, By End Use (2020-2032) (USD Million)

11.5.1.10 Qatar

11.5.1.10.1 Qatar Service Virtualization Market Estimates and Forecasts, By Component (2020-2032) (USD Million)

11.5.1.10.2 Qatar Service Virtualization Market Estimates and Forecasts, By Enterprise Size (2020-2032) (USD Million)

11.5.1.10.3 Qatar Service Virtualization Market Estimates and Forecasts, By Deployment (2020-2032) (USD Million)

11.5.1.10.4 Qatar Service Virtualization Market Estimates and Forecasts, By End Use (2020-2032) (USD Million)

11.5.1.11 Rest of Middle East

11.5.1.11.1 Rest of Middle East Service Virtualization Market Estimates and Forecasts, By Component (2020-2032) (USD Million)

11.5.1.11.2 Rest of Middle East Service Virtualization Market Estimates and Forecasts, By Enterprise Size (2020-2032) (USD Million)

11.5.1.11.3 Rest of Middle East Service Virtualization Market Estimates and Forecasts, By Deployment (2020-2032) (USD Million)

11.5.1.11.4 Rest of Middle East Service Virtualization Market Estimates and Forecasts, By End Use (2020-2032) (USD Million)

11.5.2 Africa

11.5.2.1 Trends Analysis

11.5.2.2 Africa Service Virtualization Market Estimates and Forecasts, by Country (2020-2032) (USD Million)

11.5.2.3 Africa Service Virtualization Market Estimates and Forecasts, By Component (2020-2032) (USD Million)  

11.5.2.4 Africa Service Virtualization Market Estimates and Forecasts, By Enterprise Size (2020-2032) (USD Million)

11.5.2.5 Africa Service Virtualization Market Estimates and Forecasts, By Deployment (2020-2032) (USD Million)

11.5.2.6 Africa Service Virtualization Market Estimates and Forecasts, By End Use (2020-2032) (USD Million)

11.5.2.7 South Africa

11.5.2.7.1 South Africa Service Virtualization Market Estimates and Forecasts, By Component (2020-2032) (USD Million)

11.5.2.7.2 South Africa Service Virtualization Market Estimates and Forecasts, By Enterprise Size (2020-2032) (USD Million)

11.5.2.7.3 South Africa Service Virtualization Market Estimates and Forecasts, By Deployment (2020-2032) (USD Million)

11.5.2.7.4 South Africa Service Virtualization Market Estimates and Forecasts, By End Use (2020-2032) (USD Million)

11.5.2.8 Nigeria

11.5.2.8.1 Nigeria Service Virtualization Market Estimates and Forecasts, By Component (2020-2032) (USD Million)

11.5.2.8.2 Nigeria Service Virtualization Market Estimates and Forecasts, By Enterprise Size (2020-2032) (USD Million)

11.5.2.8.3 Nigeria Service Virtualization Market Estimates and Forecasts, By Deployment (2020-2032) (USD Million)

11.5.2.8.4 Nigeria Service Virtualization Market Estimates and Forecasts, By End Use (2020-2032) (USD Million)

11.5.2.9 Rest of Africa

11.5.2.9.1 Rest of Africa Service Virtualization Market Estimates and Forecasts, By Component (2020-2032) (USD Million)

11.5.2.9.2 Rest of Africa Service Virtualization Market Estimates and Forecasts, By Enterprise Size (2020-2032) (USD Million)

11.5.2.9.3 Rest of Africa Service Virtualization Market Estimates and Forecasts, By Deployment (2020-2032) (USD Million)

11.5.2.9.4 Rest of Africa Service Virtualization Market Estimates and Forecasts, By End Use (2020-2032) (USD Million)

11.6 Latin America

11.6.1 Trends Analysis

11.6.2 Latin America Service Virtualization Market Estimates and Forecasts, by Country (2020-2032) (USD Million)

11.6.3 Latin America Service Virtualization Market Estimates and Forecasts, By Component (2020-2032) (USD Million)  

11.6.4 Latin America Service Virtualization Market Estimates and Forecasts, By Enterprise Size (2020-2032) (USD Million)

11.6.5 Latin America Service Virtualization Market Estimates and Forecasts, By Deployment (2020-2032) (USD Million)

11.6.6 Latin America Service Virtualization Market Estimates and Forecasts, By End Use (2020-2032) (USD Million)

11.6.7 Brazil

11.6.7.1 Brazil Service Virtualization Market Estimates and Forecasts, By Component (2020-2032) (USD Million)

11.6.7.2 Brazil Service Virtualization Market Estimates and Forecasts, By Enterprise Size (2020-2032) (USD Million)

11.6.7.3 Brazil Service Virtualization Market Estimates and Forecasts, By Deployment (2020-2032) (USD Million)

11.6.7.4 Brazil Service Virtualization Market Estimates and Forecasts, By End Use (2020-2032) (USD Million)

11.6.8 Argentina

11.6.8.1 Argentina Service Virtualization Market Estimates and Forecasts, By Component (2020-2032) (USD Million)

11.6.8.2 Argentina Service Virtualization Market Estimates and Forecasts, By Enterprise Size (2020-2032) (USD Million)

11.6.8.3 Argentina Service Virtualization Market Estimates and Forecasts, By Deployment (2020-2032) (USD Million)

11.6.8.4 Argentina Service Virtualization Market Estimates and Forecasts, By End Use (2020-2032) (USD Million)

11.6.9 Colombia

11.6.9.1 Colombia Service Virtualization Market Estimates and Forecasts, By Component (2020-2032) (USD Million)

11.6.9.2 Colombia Service Virtualization Market Estimates and Forecasts, By Enterprise Size (2020-2032) (USD Million)

11.6.9.3 Colombia Service Virtualization Market Estimates and Forecasts, By Deployment (2020-2032) (USD Million)

11.6.9.4 Colombia Service Virtualization Market Estimates and Forecasts, By End Use (2020-2032) (USD Million)

11.6.10 Rest of Latin America

11.6.10.1 Rest of Latin America Service Virtualization Market Estimates and Forecasts, By Component (2020-2032) (USD Million)

11.6.10.2 Rest of Latin America Service Virtualization Market Estimates and Forecasts, By Enterprise Size (2020-2032) (USD Million)

11.6.10.3 Rest of Latin America Service Virtualization Market Estimates and Forecasts, By Deployment (2020-2032) (USD Million)

11.6.10.4 Rest of Latin America Service Virtualization Market Estimates and Forecasts, By End Use (2020-2032) (USD Million)

12. Company Profiles

12.1 CA Technologies

12.1.1 Company Overview

12.1.2 Financial

12.1.3 Product / Services Offered

12.1.4 SWOT Analysis

12.2 IBM Corporation

12.2.1 Company Overview

12.2.2 Financial

12.2.3 Product / Services Offered

12.2.4 SWOT Analysis

12.3 Micro Focus

               12.3.1 Company Overview

12.3.2 Financial

12.3.3 Product / Services Offered

12.3.4 SWOT Analysis

12.4 Parasoft

               12.4.1 Company Overview

12.4.2 Financial

12.4.3 Product / Services Offered

12.4.4 SWOT Analysis

12.5 Cavisson Systems

               12.5.1 Company Overview

12.5.2 Financial

12.5.3 Product / Services Offered

12.5.4 SWOT Analysis

12.6 Tricentis

               12.6.1 Company Overview

12.6.2 Financial

12.6.3 Product / Services Offered

12.6.4 SWOT Analysis

12.7 Broadcom Inc.

12.7.1 Company Overview

12.7.2 Financial

12.7.3 Product / Services Offered

12.7.4 SWOT Analysis

12.8 Maveric Systems

               12.8.1 Company Overview

12.8.2 Financial

12.8.3 Product / Services Offered

12.8.4 SWOT Analysis

12.9 Wipro Limited

              12.9.1 Company Overview

12.9.2 Financial

12.9.3 Product / Services Offered

12.9.4 SWOT Analysis

12.10 Cognizant Technology Solutions

               12.10.1 Company Overview

12.10.2 Financial

12.10.3 Product/ Services Offered

12.10.4 SWOT Analysis

13. Use Cases and Best Practices

14. Conclusion

An accurate research report requires proper strategizing as well as implementation. There are multiple factors involved in the completion of good and accurate research report and selecting the best methodology to compete the research is the toughest part. Since the research reports we provide play a crucial role in any company’s decision-making process, therefore we at SNS Insider always believe that we should choose the best method which gives us results closer to reality. This allows us to reach at a stage wherein we can provide our clients best and accurate investment to output ratio.

Each report that we prepare takes a timeframe of 350-400 business hours for production. Starting from the selection of titles through a couple of in-depth brain storming session to the final QC process before uploading our titles on our website we dedicate around 350 working hours. The titles are selected based on their current market cap and the foreseen CAGR and growth.


The 5 steps process:

Step 1: Secondary Research:

Secondary Research or Desk Research is as the name suggests is a research process wherein, we collect data through the readily available information. In this process we use various paid and unpaid databases which our team has access to and gather data through the same. This includes examining of listed companies’ annual reports, Journals, SEC filling etc. Apart from this our team has access to various associations across the globe across different industries. Lastly, we have exchange relationships with various university as well as individual libraries.

Secondary Research

Step 2: Primary Research

When we talk about primary research, it is a type of study in which the researchers collect relevant data samples directly, rather than relying on previously collected data.  This type of research is focused on gaining content specific facts that can be sued to solve specific problems. Since the collected data is fresh and first hand therefore it makes the study more accurate and genuine.

We at SNS Insider have divided Primary Research into 2 parts.

Part 1 wherein we interview the KOLs of major players as well as the upcoming ones across various geographic regions. This allows us to have their view over the market scenario and acts as an important tool to come closer to the accurate market numbers. As many as 45 paid and unpaid primary interviews are taken from both the demand and supply side of the industry to make sure we land at an accurate judgement and analysis of the market.

This step involves the triangulation of data wherein our team analyses the interview transcripts, online survey responses and observation of on filed participants. The below mentioned chart should give a better understanding of the part 1 of the primary interview.

Primary Research

Part 2: In this part of primary research the data collected via secondary research and the part 1 of the primary research is validated with the interviews from individual consultants and subject matter experts.

Consultants are those set of people who have at least 12 years of experience and expertise within the industry whereas Subject Matter Experts are those with at least 15 years of experience behind their back within the same space. The data with the help of two main processes i.e., FGDs (Focused Group Discussions) and IDs (Individual Discussions). This gives us a 3rd party nonbiased primary view of the market scenario making it a more dependable one while collation of the data pointers.

Step 3: Data Bank Validation

Once all the information is collected via primary and secondary sources, we run that information for data validation. At our intelligence centre our research heads track a lot of information related to the market which includes the quarterly reports, the daily stock prices, and other relevant information. Our data bank server gets updated every fortnight and that is how the information which we collected using our primary and secondary information is revalidated in real time.

Data Bank Validation

Step 4: QA/QC Process

After all the data collection and validation our team does a final level of quality check and quality assurance to get rid of any unwanted or undesired mistakes. This might include but not limited to getting rid of the any typos, duplication of numbers or missing of any important information. The people involved in this process include technical content writers, research heads and graphics people. Once this process is completed the title gets uploader on our platform for our clients to read it.

Step 5: Final QC/QA Process:

This is the last process and comes when the client has ordered the study. In this process a final QA/QC is done before the study is emailed to the client. Since we believe in giving our clients a good experience of our research studies, therefore, to make sure that we do not lack at our end in any way humanly possible we do a final round of quality check and then dispatch the study to the client.

Key Segments:

By Component

  • Software

  • Service

By Enterprise Size

  • Large Enterprise

  • SMEs

By Deployment

  • Cloud

  • On-premise

By End Use

  • BFSI

  • Healthcare

  • IT & Telecommunication

  • Automotive

  • Retail & E-Commerce

  • Others

Request for Segment Customization as per your Business Requirement: Segment Customization Request

REGIONAL COVERAGE:

North America

  • US

  • Canada

  • Mexico

Europe

  • Eastern Europe

    • Poland

    • Romania

    • Hungary

    • Turkey

    • Rest of Eastern Europe

  • Western Europe

    • Germany

    • France

    • UK

    • Italy

    • Spain

    • Netherlands

    • Switzerland

    • Austria

    • Rest of Western Europe

Asia Pacific

  • China

  • India

  • Japan

  • South Korea

  • Vietnam

  • Singapore

  • Australia

  • Rest of Asia Pacific

Middle East & Africa

  • Middle East

    • UAE

    • Egypt

    • Saudi Arabia

    • Qatar

    • Rest of the Middle East

  • Africa

    • Nigeria

    • South Africa

    • Rest of Africa

Latin America

  • Brazil

  • Argentina

  • Colombia

Request for Country Level Research Report: Country Level Customization Request

Available Customization

With the given market data, SNS Insider offers customization as per the company’s specific needs. The following customization options are available for the report:

  • Product Analysis

  • Criss-Cross segment analysis (e.g. Product X Application)

  • Product Matrix which gives a detailed comparison of product portfolio of each company

  • Geographic Analysis

  • Additional countries in any of the regions

  • Company Information

  • Detailed analysis and profiling of additional market players (Up to five)


  •            5000 (33% Discount)


  •            8950 (40% Discount)


  •            3050 (23% Discount)

Start a Conversation

Hi! Click one of our member below to chat on Phone