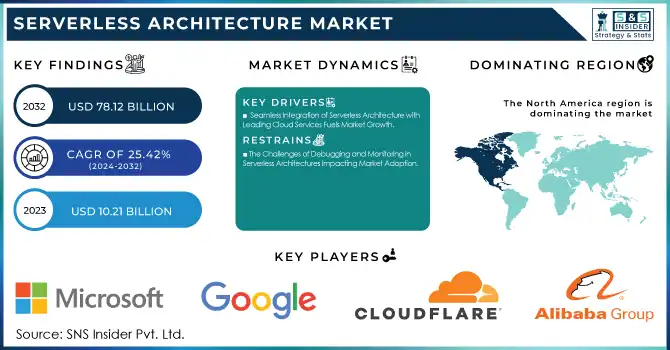
The Serverless Architecture Market was valued at USD 10.21 billion in 2023 and is expected to reach USD 78.12 billion by 2032, growing at a CAGR of 25.42% from 2024-2032.
To Get More Information on Serverless Architecture Market - Request Sample Report
The Serverless Architecture Market has experienced rapid expansion as companies pursue scalable, budget-friendly options to fulfill their IT requirements. In 2024, expenditures on IT services are anticipated to hit USD 1.6 trillion, indicating substantial investments in cloud technologies. This expansion is primarily fueled by the removal of conventional server management, enabling companies to concentrate on coding as cloud providers manage the infrastructure. In August 2024, Coherence introduced serverless deployment choices for AWS and GCP, allowing developers to deploy applications straight onto AWS Lambda and GCP Cloud Run. As the use of cloud technology grows, companies are attracted to the adaptability of serverless architectures, which provide automatic scaling and lower operational costs. As a result, companies in various industries acknowledge the importance of serverless solutions to optimize processes and promote innovation, accelerating additional market growth.
The increasing need for serverless architecture is driven by its built-in benefits, especially cost-effectiveness and scalability, which assist organizations in managing resources more efficiently. Serverless models provide businesses the capability to operate applications without the concern of provisioning or managing servers, leading to enhanced agility and quicker deployment periods. In June 2024, OpenMetal investigated the combination of serverless computing with OpenStack, assessing the application of Cloud Hypervisor, Unikernel, and Firecracker technologies, thus progressing this strategy. This effectiveness is vital for sectors such as e-commerce, fintech, and healthcare, where rapid innovation and minimal operational expenses are essential. As an increasing number of organizations enhance their IT infrastructure, the need for serverless solutions is on the rise.
Looking toward the future, the Serverless Architecture Market is set for additional expansion, as new technologies present fresh possibilities for innovation. In September 2024, Kong introduced Konnect Serverless Gateways, a completely managed API management solution, enhancing serverless functionalities even further. The ongoing development of serverless solutions is anticipated to lead to enhancements in performance, security, and the overall experience for developers, increasing their attractiveness to companies looking for optimized cloud settings. Moreover, incorporating advanced technologies like AI and machine learning into serverless frameworks will facilitate smarter and more autonomous operations. As edge computing and IoT gain more attention, serverless architectures will penetrate new markets, maintaining their importance and offering significant growth prospects in the years ahead.
Drivers
Seamless Integration of Serverless Architecture with Leading Cloud Services Fuels Market Growth
The combination of serverless architecture with leading cloud platforms like AWS Lambda, Azure Functions, and Google Cloud Functions is crucial for boosting its adoption. These platforms provide smooth integration with various cloud services, allowing developers to easily add functionalities such as storage, databases, and messaging systems to their serverless applications. By utilizing current cloud ecosystems, companies can simplify their development workflows, lessen integration difficulties, and quickly launch applications in various settings. The simplicity of use, combined with access to a range of managed services, enables organizations to concentrate on innovation while delegating infrastructure management to cloud providers. As an increasing number of companies acknowledge the benefits of these unified solutions, the need for serverless architecture steadily grows, solidifying its role as an essential technology for contemporary application development.
The Rise of Microservices and Its Synergy with Serverless Architecture in Modern Application Development
The increasing popularity of microservices architecture plays a key role in the growth of serverless computing in the industry. Serverless platforms are especially advantageous for microservices, facilitating the creation of modular, event-driven applications that are both scalable and adaptable. Every microservice can be deployed, maintained, and scaled independently, which fits seamlessly with serverless models that allocate resources dynamically according to demand. This integration enables organizations to decompose intricate applications into smaller, easier-to-handle parts, enhancing agility and streamlining deployment procedures. Additionally, serverless computing improves the overall effectiveness of microservices by minimizing the overhead associated with managing infrastructure. With an increasing number of companies adopting microservices to enhance application performance, serverless architecture emerges as a logical and efficient selection, promoting smooth integration, quicker deployments, and simpler scalability.
Restraints
The Challenges of Debugging and Monitoring in Serverless Architectures Impacting Market Adoption
Debugging and overseeing serverless applications pose major difficulties because of their stateless and distributed characteristics. In a serverless setting, functions operate autonomously and scale automatically, complicating the tracking of request flows and pinpointing the source of problems. Conventional debugging tools might not be entirely suitable, necessitating customized solutions designed for serverless architectures. Additionally, tracking the performance of these applications can be intricate, as they are distributed across various services and trigger numerous events, potentially causing visibility gaps and slow issue resolution. Consequently, businesses must allocate resources towards sophisticated tools and skills to proficiently track the performance of serverless applications and guarantee seamless functionality. These intricacies may discourage certain businesses from completely adopting serverless solutions, particularly those with strict operational needs.
The Challenge of Cost Management in Serverless Architectures and Its Impact on Market Growth
While serverless architecture provides substantial cost savings in various situations, it may lead to unpredictable expenses, especially during usage surges or when functions are called repeatedly. In contrast to conventional models with set pricing, serverless operates on a pay-per-use basis, where expenses fluctuate depending on the volume of requests and the length of function execution. Consequently, organizations might encounter difficulties in managing budgets and controlling costs, particularly when workloads vary or surpass expectations. In the absence of strong monitoring and cost optimization tools, companies might find it difficult to predict and control expenses accurately, resulting in possible financial shocks. This uncertainty may discourage certain organizations from completely embracing serverless solutions, particularly those with strict budget limitations or particular financial planning requirements.
By Vertical
In 2023, the IT and Telecom segment dominated the Serverless Architecture Market with the highest revenue share of approximately 26%. This can be attributed to the sector's growing need for scalable and cost-effective solutions to manage vast amounts of data, support rapid application development, and optimize resource allocation. Serverless architecture enables IT and telecom companies to handle fluctuating workloads efficiently, minimize infrastructure overhead, and accelerate time-to-market for new services, making it a preferred choice for this industry.
The Healthcare segment is projected to grow at the fastest CAGR of about 29.07% from 2024 to 2032. The increasing demand for cloud-based healthcare solutions, coupled with the need for scalable and flexible infrastructure to manage sensitive patient data, is driving this growth. Serverless architecture provides the agility and cost savings necessary for healthcare organizations to deploy applications quickly, enhance data security, and maintain regulatory compliance, positioning it as a key enabler in the transformation of healthcare IT systems.
By Deployment
In 2023, the Public Cloud segment led the Serverless Architecture Market with the highest revenue share of approximately 58%. This dominance is primarily driven by the widespread adoption of public cloud services across various industries, offering flexibility, scalability, and reduced infrastructure management costs. Public cloud providers, such as AWS, Microsoft Azure, and Google Cloud, offer robust serverless platforms that seamlessly integrate with other cloud-based services, making them the go-to choice for businesses seeking efficient, cost-effective solutions.
The Hybrid Cloud segment is expected to grow at the fastest CAGR of about 27.67% from 2024 to 2032. This growth is fueled by organizations seeking the best of both worlds—combining the scalability and cost benefits of the public cloud with the security and control offered by private cloud infrastructures. Hybrid cloud solutions allow businesses to optimize workloads, maintain compliance, and ensure greater flexibility, driving their rapid adoption and fueling the segment's impressive growth trajectory in the coming years.
By Services
In 2023, the Automation & Integration segment led the Serverless Architecture Market with the highest revenue share of approximately 25%. This dominance stems from the growing demand for automated processes and seamless integration of diverse services across cloud platforms. Serverless architecture offers significant advantages in automating routine tasks, managing workflows, and reducing the complexity of integrating various systems, making it a crucial enabler for businesses looking to enhance operational efficiency and speed up time-to-market.
The Security segment is expected to grow at the fastest CAGR of about 29.49% from 2024 to 2032. As organizations increasingly move to serverless environments, the need for robust security measures to protect sensitive data and ensure compliance becomes paramount. Serverless architectures, with their distributed nature and reliance on third-party services, require specialized security solutions to address potential vulnerabilities. This growing focus on securing cloud-based infrastructures is driving the rapid expansion of the security segment in the serverless architecture market.
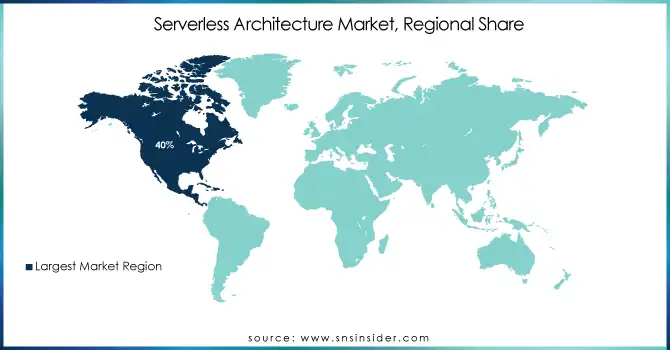
In 2023, North America dominated the Serverless Architecture Market with the highest revenue share of approximately 40%. This leadership is driven by the region’s strong technological infrastructure, early adoption of cloud services, and the presence of major cloud service providers like AWS, Microsoft Azure, and Google Cloud. The demand for scalable, flexible, and cost-efficient solutions in industries such as IT, finance, and telecommunications further propelled the region's dominance, making North America a hub for serverless innovation and deployment.
The Asia Pacific region is expected to grow at the fastest CAGR of about 28.41% from 2024 to 2032. This rapid growth can be attributed to the increasing digital transformation initiatives across countries like China, India, and Japan. As businesses in the region embrace cloud computing to improve scalability and reduce costs, serverless architecture is emerging as an ideal solution to meet these evolving needs. The growing number of tech startups and expanding enterprise sectors in Asia Pacific are expected to drive the adoption of serverless models at an accelerated pace in the coming years.
Do You Need any Customization Research on Serverless Architecture Market - Enquire Now
Alibaba Group (Alibaba Cloud Function Compute, Alibaba Cloud API Gateway)
Cloudflare, Inc. (Cloudflare Workers, Cloudflare Pages)
Google (Google Cloud Functions, Google Cloud Run)
IBM Corporation (IBM Cloud Functions, IBM Cloud Foundry)
Microsoft (Azure Functions, Azure Logic Apps)
NTT DATA Group Corporation (NTT Smart Data Platform, NTT Cloud Functions)
Oracle (Oracle Functions, Oracle API Gateway)
TIBCO Software (Cloud Software Group, Inc.) (TIBCO Cloud Integration, TIBCO Cloud Mashery)
Amazon Web Services (AWS Lambda, Amazon API Gateway)
Rackspace Inc (Rackspace Serverless, Rackspace Cloud)
Salesforce.com, Inc. (Salesforce Functions, Salesforce Heroku)
Platform9 Systems, Inc. (Platform9 Serverless Kubernetes, Platform9 Cloud Managed Kubernetes)
OpenStack Foundation (OpenStack Functions, OpenStack Heat)
PubNub, Inc. (PubNub Functions, PubNub Real-time Messaging)
Spotinst Ltd. (Spotinst Functions, Spotinst Kubernetes)
5 Networks, Inc. (5G Serverless, 5G Edge Functions)
DigitalOcean, Inc. (DigitalOcean Functions, DigitalOcean App Platform)
Kong Inc. (Kong Gateway, Kong Enterprise)
Back4App (Back4App Functions, Back4App Serverless)
Netlify, Inc. (Netlify Functions, Netlify Edge Functions)
Vercel Inc. (Vercel Functions, Vercel Edge Functions)
Cisco Systems, Inc. (Cisco Cloud Functions, Cisco API Management)
VMware, Inc. (VMware Tanzu Application Service, VMware Cloud Functions)
In January 2024, Alibaba Cloud introduced a serverless solution that reduces inference costs by up to 50%, enabling cost-efficient access to generative AI services. The company also integrated its vector engine into various products, enhancing AI performance and information retrieval.
In November 2024, Fauna and Cloudflare partnered to streamline serverless development, enabling faster and more scalable solutions. This collaboration leverages Fauna's serverless database with Cloudflare's edge network, offering quick deployments, enhanced global reach, and simplified management for developers.
In October 2024, IBM introduced Quantum Serverless, a toolset that enhances quantum and classical resource management for long-running workloads. This approach allows dynamic allocation of CPUs, GPUs, and QPUs, overcoming traditional system limitations and ensuring persistence of tasks, improving the scalability and efficiency of quantum computing.
Report Attributes | Details |
---|---|
Market Size in 2023 | USD 10.21 Billion |
Market Size by 2032 | USD 78.21 Billion |
CAGR | CAGR of 25.42% From 2024 to 2032 |
Base Year | 2023 |
Forecast Period | 2024-2032 |
Historical Data | 2020-2022 |
Report Scope & Coverage | Market Size, Segments Analysis, Competitive Landscape, Regional Analysis, DROC & SWOT Analysis, Forecast Outlook |
Key Segments | • By Services (Automation & Integration, API Management, Monitoring, Security, Support and Maintenance, Training and Consulting, Others) • By Deployment (Public Cloud, Private Cloud, Hybrid Cloud) • By Organization Size (Large Enterprise, SME) • By Vertical (IT and Telecom, Healthcare, Retail and E-commerce, Banking, Financial Services, and Insurance (BFSI), Government, Education, Others) |
Regional Analysis/Coverage | North America (US, Canada, Mexico), Europe (Eastern Europe [Poland, Romania, Hungary, Turkey, Rest of Eastern Europe] Western Europe] Germany, France, UK, Italy, Spain, Netherlands, Switzerland, Austria, Rest of Western Europe]), Asia Pacific (China, India, Japan, South Korea, Vietnam, Singapore, Australia, Rest of Asia Pacific), Middle East & Africa (Middle East [UAE, Egypt, Saudi Arabia, Qatar, Rest of Middle East], Africa [Nigeria, South Africa, Rest of Africa], Latin America (Brazil, Argentina, Colombia, Rest of Latin America) |
Company Profiles | Alibaba.com, Cloudflare, Inc., Google, IBM, Microsoft, NTT DATA Group Corporation, Oracle, TIBCO Software (Cloud Software Group, Inc.), Amazon, Rackspace Technology, Inc., Salesforce.com, Inc., Platform9 Systems, Inc., OpenStack Foundation, PubNub, Inc., Spotinst Ltd., 5 Networks, Inc., DigitalOcean, Inc., Kong Inc., Back4App, Netlify, Inc., Vercel Inc., Cisco Systems, Inc., VMware, Inc. |
Key Drivers | • Seamless Integration of Serverless Architecture with Leading Cloud Services Fuels Market Growth • The Rise of Microservices and Its Synergy with Serverless Architecture in Modern Application Development |
RESTRAINTS | • The Challenges of Debugging and Monitoring in Serverless Architectures Impacting Market Adoption • The Challenge of Cost Management in Serverless Architectures and Its Impact on Market Growth |
Ans: Serverless Architecture Market was valued at USD 10.21 billion in 2023 and is expected to reach USD 78.12 billion by 2032, growing at a CAGR of 25.42% from 2024-2032.
Ans: The IT and Telecom sector led with the highest revenue share of 26%.
Ans: The Public Cloud segment dominated with 58% of the market share.
Ans: The Asia Pacific region is expected to grow at the fastest CAGR of 28.41% from 2024 to 2032.
Ans: The Automation & Integration segment led with 25% of the market share.
Table of Contents
1. Introduction
1.1 Market Definition
1.2 Scope (Inclusion and Exclusions)
1.3 Research Assumptions
2. Executive Summary
2.1 Market Overview
2.2 Regional Synopsis
2.3 Competitive Summary
3. Research Methodology
3.1 Top-Down Approach
3.2 Bottom-up Approach
3.3. Data Validation
3.4 Primary Interviews
4. Market Dynamics Impact Analysis
4.1 Market Driving Factors Analysis
4.1.1 Drivers
4.1.2 Restraints
4.1.3 Opportunities
4.1.4 Challenges
4.2 PESTLE Analysis
4.3 Porter’s Five Forces Model
5. Statistical Insights and Trends Reporting
5.1 Adoption Rates of Emerging Technologies
5.2 Network Infrastructure Expansion, by Region
5.3 Cybersecurity Incidents, by Region (2020-2023)
5.4 Cloud Services Usage, by Region
6. Competitive Landscape
6.1 List of Major Companies, By Region
6.2 Market Share Analysis, By Region
6.3 Product Benchmarking
6.3.1 Product specifications and features
6.3.2 Pricing
6.4 Strategic Initiatives
6.4.1 Marketing and promotional activities
6.4.2 Distribution and supply chain strategies
6.4.3 Expansion plans and new product launches
6.4.4 Strategic partnerships and collaborations
6.5 Technological Advancements
6.6 Market Positioning and Branding
7. Serverless Architecture Market Segmentation, By Services
7.1 Chapter Overview
7.2 Automation & Integration
7.2.1 Automation & Integration Market Trends Analysis (2020-2032)
7.2.2 Automation & Integration Market Size Estimates and Forecasts to 2032 (USD Billion)
7.3 API Management
7.3.1 API Management Market Trends Analysis (2020-2032)
7.3.2 API Management Market Size Estimates and Forecasts to 2032 (USD Billion)
7.4 Monitoring
7.4.1 Monitoring Market Trends Analysis (2020-2032)
7.4.2 Monitoring Market Size Estimates and Forecasts to 2032 (USD Billion)
7.5 Security
7.5.1 Security Market Trends Analysis (2020-2032)
7.5.2 Security Market Size Estimates and Forecasts to 2032 (USD Billion)
7.6 Support and Maintenance
7.6.1 Support and Maintenance Market Trends Analysis (2020-2032)
7.6.2 Support and Maintenance Market Size Estimates and Forecasts to 2032 (USD Billion)
7.7 Training and Consulting
7.7.1 Training and Consulting Market Trends Analysis (2020-2032)
7.7.2 Training and Consulting Market Size Estimates and Forecasts to 2032 (USD Billion)
7.8 Others
7.8.1 Others Market Trends Analysis (2020-2032)
7.8.2 Others Market Size Estimates and Forecasts to 2032 (USD Billion)
8. Serverless Architecture Market Segmentation, By Deployment
8.1 Chapter Overview
8.2 Public Cloud
8.2.1 Public Cloud Market Trends Analysis (2020-2032)
8.2.2 Public Cloud Market Size Estimates and Forecasts to 2032 (USD Billion)
8.3 Private Cloud
8.3.1 Private Cloud Market Trends Analysis (2020-2032)
8.3.2 Private Cloud Market Size Estimates and Forecasts to 2032 (USD Billion)
8.4 Hybrid Cloud
8.4.1 Hybrid Cloud Market Trends Analysis (2020-2032)
8.4.2 Hybrid Cloud Market Size Estimates and Forecasts to 2032 (USD Billion)
9. Serverless Architecture Market Segmentation, By Organization Size
9.1 Chapter Overview
9.2 Large Enterprise
9.2.1 Large Enterprise Market Trends Analysis (2020-2032)
9.2.2 Large Enterprise Market Size Estimates and Forecasts to 2032 (USD Billion)
9.3 SME
9.3.1 SME Market Trends Analysis (2020-2032)
9.3.2 SME Market Size Estimates and Forecasts to 2032 (USD Billion)
10. Serverless Architecture Market Segmentation, By Vertical
10.1 Chapter Overview
10.2 IT and Telecom
10.2.1 IT and Telecom Market Trends Analysis (2020-2032)
10.2.2 IT and Telecom Market Size Estimates and Forecasts to 2032 (USD Billion)
10.3 Healthcare
10.3.1 Healthcare Market Trends Analysis (2020-2032)
10.3.2 Healthcare Market Size Estimates and Forecasts to 2032 (USD Billion)
10.4 Retail and E-commerce
10.4.1 Retail and E-commerce Market Trends Analysis (2020-2032)
10.4.2 Retail and E-commerce Market Size Estimates and Forecasts to 2032 (USD Billion)
10.5 Banking, Financial Services, and Insurance
10.5.1 Banking, Financial Services, and Insurance Market Trends Analysis (2020-2032)
10.5.2 Banking, Financial Services, and Insurance Market Size Estimates and Forecasts to 2032 (USD Billion)
10.6 Government
10.6.1 Government Market Trends Analysis (2020-2032)
10.6.2 Government Market Size Estimates and Forecasts to 2032 (USD Billion)
10.7 Education
10.7.1 Education Market Trends Analysis (2020-2032)
10.7.2 Education Market Size Estimates and Forecasts to 2032 (USD Billion)
10.8 Others
10.8.1 Others Market Trends Analysis (2020-2032)
10.8.2 Others Market Size Estimates and Forecasts to 2032 (USD Billion)
11. Regional Analysis
11.1 Chapter Overview
11.2 North America
11.2.1 Trends Analysis
11.2.2 North America Serverless Architecture Market Estimates and Forecasts, by Country (2020-2032) (USD Billion)
11.2.3 North America Serverless Architecture Market Estimates and Forecasts, By Services (2020-2032) (USD Billion)
11.2.4 North America Serverless Architecture Market Estimates and Forecasts, By Deployment (2020-2032) (USD Billion)
11.2.5 North America Serverless Architecture Market Estimates and Forecasts, By Organization Size (2020-2032) (USD Billion)
11.2.6 North America Serverless Architecture Market Estimates and Forecasts, By Vertical (2020-2032) (USD Billion)
11.2.7 USA
11.2.7.1 USA Serverless Architecture Market Estimates and Forecasts, By Services (2020-2032) (USD Billion)
11.2.7.2 USA Serverless Architecture Market Estimates and Forecasts, By Deployment (2020-2032) (USD Billion)
11.2.7.3 USA Serverless Architecture Market Estimates and Forecasts, By Organization Size (2020-2032) (USD Billion)
11.2.7.4 USA Serverless Architecture Market Estimates and Forecasts, By Vertical (2020-2032) (USD Billion)
11.2.8 Canada
11.2.8.1 Canada Serverless Architecture Market Estimates and Forecasts, By Services (2020-2032) (USD Billion)
11.2.8.2 Canada Serverless Architecture Market Estimates and Forecasts, By Deployment (2020-2032) (USD Billion)
11.2.8.3 Canada Serverless Architecture Market Estimates and Forecasts, By Organization Size (2020-2032) (USD Billion)
11.2.8.4 Canada Serverless Architecture Market Estimates and Forecasts, By Vertical (2020-2032) (USD Billion)
11.2.9 Mexico
11.2.9.1 Mexico Serverless Architecture Market Estimates and Forecasts, By Services (2020-2032) (USD Billion)
11.2.9.2 Mexico Serverless Architecture Market Estimates and Forecasts, By Deployment (2020-2032) (USD Billion)
11.2.9.3 Mexico Serverless Architecture Market Estimates and Forecasts, By Organization Size (2020-2032) (USD Billion)
11.2.9.4 Mexico Serverless Architecture Market Estimates and Forecasts, By Vertical (2020-2032) (USD Billion)
11.3 Europe
11.3.1 Eastern Europe
11.3.1.1 Trends Analysis
11.3.1.2 Eastern Europe Serverless Architecture Market Estimates and Forecasts, by Country (2020-2032) (USD Billion)
11.3.1.3 Eastern Europe Serverless Architecture Market Estimates and Forecasts, By Services (2020-2032) (USD Billion)
11.3.1.4 Eastern Europe Serverless Architecture Market Estimates and Forecasts, By Deployment (2020-2032) (USD Billion)
11.3.1.5 Eastern Europe Serverless Architecture Market Estimates and Forecasts, By Organization Size (2020-2032) (USD Billion)
11.3.1.6 Eastern Europe Serverless Architecture Market Estimates and Forecasts, By Vertical (2020-2032) (USD Billion)
11.3.1.7 Poland
11.3.1.7.1 Poland Serverless Architecture Market Estimates and Forecasts, By Services (2020-2032) (USD Billion)
11.3.1.7.2 Poland Serverless Architecture Market Estimates and Forecasts, By Deployment (2020-2032) (USD Billion)
11.3.1.7.3 Poland Serverless Architecture Market Estimates and Forecasts, By Organization Size (2020-2032) (USD Billion)
11.3.1.7.4 Poland Serverless Architecture Market Estimates and Forecasts, By Vertical (2020-2032) (USD Billion)
11.3.1.8 Romania
11.3.1.8.1 Romania Serverless Architecture Market Estimates and Forecasts, By Services (2020-2032) (USD Billion)
11.3.1.8.2 Romania Serverless Architecture Market Estimates and Forecasts, By Deployment (2020-2032) (USD Billion)
11.3.1.8.3 Romania Serverless Architecture Market Estimates and Forecasts, By Organization Size (2020-2032) (USD Billion)
11.3.1.8.4 Romania Serverless Architecture Market Estimates and Forecasts, By Vertical (2020-2032) (USD Billion)
11.3.1.9 Hungary
11.3.1.9.1 Hungary Serverless Architecture Market Estimates and Forecasts, By Services (2020-2032) (USD Billion)
11.3.1.9.2 Hungary Serverless Architecture Market Estimates and Forecasts, By Deployment (2020-2032) (USD Billion)
11.3.1.9.3 Hungary Serverless Architecture Market Estimates and Forecasts, By Organization Size (2020-2032) (USD Billion)
11.3.1.9.4 Hungary Serverless Architecture Market Estimates and Forecasts, By Vertical (2020-2032) (USD Billion)
11.3.1.10 Turkey
11.3.1.10.1 Turkey Serverless Architecture Market Estimates and Forecasts, By Services (2020-2032) (USD Billion)
11.3.1.10.2 Turkey Serverless Architecture Market Estimates and Forecasts, By Deployment (2020-2032) (USD Billion)
11.3.1.10.3 Turkey Serverless Architecture Market Estimates and Forecasts, By Organization Size (2020-2032) (USD Billion)
11.3.1.10.4 Turkey Serverless Architecture Market Estimates and Forecasts, By Vertical (2020-2032) (USD Billion)
11.3.1.11 Rest of Eastern Europe
11.3.1.11.1 Rest of Eastern Europe Serverless Architecture Market Estimates and Forecasts, By Services (2020-2032) (USD Billion)
11.3.1.11.2 Rest of Eastern Europe Serverless Architecture Market Estimates and Forecasts, By Deployment (2020-2032) (USD Billion)
11.3.1.11.3 Rest of Eastern Europe Serverless Architecture Market Estimates and Forecasts, By Organization Size (2020-2032) (USD Billion)
11.3.1.11.4 Rest of Eastern Europe Serverless Architecture Market Estimates and Forecasts, By Vertical (2020-2032) (USD Billion)
11.3.2 Western Europe
11.3.2.1 Trends Analysis
11.3.2.2 Western Europe Serverless Architecture Market Estimates and Forecasts, by Country (2020-2032) (USD Billion)
11.3.2.3 Western Europe Serverless Architecture Market Estimates and Forecasts, By Services (2020-2032) (USD Billion)
11.3.2.4 Western Europe Serverless Architecture Market Estimates and Forecasts, By Deployment (2020-2032) (USD Billion)
11.3.2.5 Western Europe Serverless Architecture Market Estimates and Forecasts, By Organization Size (2020-2032) (USD Billion)
11.3.2.6 Western Europe Serverless Architecture Market Estimates and Forecasts, By Vertical (2020-2032) (USD Billion)
11.3.2.7 Germany
11.3.2.7.1 Germany Serverless Architecture Market Estimates and Forecasts, By Services (2020-2032) (USD Billion)
11.3.2.7.2 Germany Serverless Architecture Market Estimates and Forecasts, By Deployment (2020-2032) (USD Billion)
11.3.2.7.3 Germany Serverless Architecture Market Estimates and Forecasts, By Organization Size (2020-2032) (USD Billion)
11.3.2.7.4 Germany Serverless Architecture Market Estimates and Forecasts, By Vertical (2020-2032) (USD Billion)
11.3.2.8 France
11.3.2.8.1 France Serverless Architecture Market Estimates and Forecasts, By Services (2020-2032) (USD Billion)
11.3.2.8.2 France Serverless Architecture Market Estimates and Forecasts, By Deployment (2020-2032) (USD Billion)
11.3.2.8.3 France Serverless Architecture Market Estimates and Forecasts, By Organization Size (2020-2032) (USD Billion)
11.3.2.8.4 France Serverless Architecture Market Estimates and Forecasts, By Vertical (2020-2032) (USD Billion)
11.3.2.9 UK
11.3.2.9.1 UK Serverless Architecture Market Estimates and Forecasts, By Services (2020-2032) (USD Billion)
11.3.2.9.2 UK Serverless Architecture Market Estimates and Forecasts, By Deployment (2020-2032) (USD Billion)
11.3.2.9.3 UK Serverless Architecture Market Estimates and Forecasts, By Organization Size (2020-2032) (USD Billion)
11.3.2.9.4 UK Serverless Architecture Market Estimates and Forecasts, By Vertical (2020-2032) (USD Billion)
11.3.2.10 Italy
11.3.2.10.1 Italy Serverless Architecture Market Estimates and Forecasts, By Services (2020-2032) (USD Billion)
11.3.2.10.2 Italy Serverless Architecture Market Estimates and Forecasts, By Deployment (2020-2032) (USD Billion)
11.3.2.10.3 Italy Serverless Architecture Market Estimates and Forecasts, By Organization Size (2020-2032) (USD Billion)
11.3.2.10.4 Italy Serverless Architecture Market Estimates and Forecasts, By Vertical (2020-2032) (USD Billion)
11.3.2.11 Spain
11.3.2.11.1 Spain Serverless Architecture Market Estimates and Forecasts, By Services (2020-2032) (USD Billion)
11.3.2.11.2 Spain Serverless Architecture Market Estimates and Forecasts, By Deployment (2020-2032) (USD Billion)
11.3.2.11.3 Spain Serverless Architecture Market Estimates and Forecasts, By Organization Size (2020-2032) (USD Billion)
11.3.2.11.4 Spain Serverless Architecture Market Estimates and Forecasts, By Vertical (2020-2032) (USD Billion)
11.3.2.12 Netherlands
11.3.2.12.1 Netherlands Serverless Architecture Market Estimates and Forecasts, By Services (2020-2032) (USD Billion)
11.3.2.12.2 Netherlands Serverless Architecture Market Estimates and Forecasts, By Deployment (2020-2032) (USD Billion)
11.3.2.12.3 Netherlands Serverless Architecture Market Estimates and Forecasts, By Organization Size (2020-2032) (USD Billion)
11.3.2.12.4 Netherlands Serverless Architecture Market Estimates and Forecasts, By Vertical (2020-2032) (USD Billion)
11.3.2.13 Switzerland
11.3.2.13.1 Switzerland Serverless Architecture Market Estimates and Forecasts, By Services (2020-2032) (USD Billion)
11.3.2.13.2 Switzerland Serverless Architecture Market Estimates and Forecasts, By Deployment (2020-2032) (USD Billion)
11.3.2.13.3 Switzerland Serverless Architecture Market Estimates and Forecasts, By Organization Size (2020-2032) (USD Billion)
11.3.2.13.4 Switzerland Serverless Architecture Market Estimates and Forecasts, By Vertical (2020-2032) (USD Billion)
11.3.2.14 Austria
11.3.2.14.1 Austria Serverless Architecture Market Estimates and Forecasts, By Services (2020-2032) (USD Billion)
11.3.2.14.2 Austria Serverless Architecture Market Estimates and Forecasts, By Deployment (2020-2032) (USD Billion)
11.3.2.14.3 Austria Serverless Architecture Market Estimates and Forecasts, By Organization Size (2020-2032) (USD Billion)
11.3.2.14.4 Austria Serverless Architecture Market Estimates and Forecasts, By Vertical (2020-2032) (USD Billion)
11.3.2.15 Rest of Western Europe
11.3.2.15.1 Rest of Western Europe Serverless Architecture Market Estimates and Forecasts, By Services (2020-2032) (USD Billion)
11.3.2.15.2 Rest of Western Europe Serverless Architecture Market Estimates and Forecasts, By Deployment (2020-2032) (USD Billion)
11.3.2.15.3 Rest of Western Europe Serverless Architecture Market Estimates and Forecasts, By Organization Size (2020-2032) (USD Billion)
11.3.2.15.4 Rest of Western Europe Serverless Architecture Market Estimates and Forecasts, By Vertical (2020-2032) (USD Billion)
11.4 Asia Pacific
11.4.1 Trends Analysis
11.4.2 Asia Pacific Serverless Architecture Market Estimates and Forecasts, by Country (2020-2032) (USD Billion)
11.4.3 Asia Pacific Serverless Architecture Market Estimates and Forecasts, By Services (2020-2032) (USD Billion)
11.4.4 Asia Pacific Serverless Architecture Market Estimates and Forecasts, By Deployment (2020-2032) (USD Billion)
11.4.5 Asia Pacific Serverless Architecture Market Estimates and Forecasts, By Organization Size (2020-2032) (USD Billion)
11.4.6 Asia Pacific Serverless Architecture Market Estimates and Forecasts, By Vertical (2020-2032) (USD Billion)
11.4.7 China
11.4.7.1 China Serverless Architecture Market Estimates and Forecasts, By Services (2020-2032) (USD Billion)
11.4.7.2 China Serverless Architecture Market Estimates and Forecasts, By Deployment (2020-2032) (USD Billion)
11.4.7.3 China Serverless Architecture Market Estimates and Forecasts, By Organization Size (2020-2032) (USD Billion)
11.4.7.4 China Serverless Architecture Market Estimates and Forecasts, By Vertical (2020-2032) (USD Billion)
11.4.8 India
11.4.8.1 India Serverless Architecture Market Estimates and Forecasts, By Services (2020-2032) (USD Billion)
11.4.8.2 India Serverless Architecture Market Estimates and Forecasts, By Deployment (2020-2032) (USD Billion)
11.4.8.3 India Serverless Architecture Market Estimates and Forecasts, By Organization Size (2020-2032) (USD Billion)
11.4.8.4 India Serverless Architecture Market Estimates and Forecasts, By Vertical (2020-2032) (USD Billion)
11.4.9 Japan
11.4.9.1 Japan Serverless Architecture Market Estimates and Forecasts, By Services (2020-2032) (USD Billion)
11.4.9.2 Japan Serverless Architecture Market Estimates and Forecasts, By Deployment (2020-2032) (USD Billion)
11.4.9.3 Japan Serverless Architecture Market Estimates and Forecasts, By Organization Size (2020-2032) (USD Billion)
11.4.9.4 Japan Serverless Architecture Market Estimates and Forecasts, By Vertical (2020-2032) (USD Billion)
11.4.10 South Korea
11.4.10.1 South Korea Serverless Architecture Market Estimates and Forecasts, By Services (2020-2032) (USD Billion)
11.4.10.2 South Korea Serverless Architecture Market Estimates and Forecasts, By Deployment (2020-2032) (USD Billion)
11.4.10.3 South Korea Serverless Architecture Market Estimates and Forecasts, By Organization Size (2020-2032) (USD Billion)
11.4.10.4 South Korea Serverless Architecture Market Estimates and Forecasts, By Vertical (2020-2032) (USD Billion)
11.4.11 Vietnam
11.4.11.1 Vietnam Serverless Architecture Market Estimates and Forecasts, By Services (2020-2032) (USD Billion)
11.4.11.2 Vietnam Serverless Architecture Market Estimates and Forecasts, By Deployment (2020-2032) (USD Billion)
11.4.11.3 Vietnam Serverless Architecture Market Estimates and Forecasts, By Organization Size (2020-2032) (USD Billion)
11.4.11.4 Vietnam Serverless Architecture Market Estimates and Forecasts, By Vertical (2020-2032) (USD Billion)
11.4.12 Singapore
11.4.12.1 Singapore Serverless Architecture Market Estimates and Forecasts, By Services (2020-2032) (USD Billion)
11.4.12.2 Singapore Serverless Architecture Market Estimates and Forecasts, By Deployment (2020-2032) (USD Billion)
11.4.12.3 Singapore Serverless Architecture Market Estimates and Forecasts, By Organization Size (2020-2032) (USD Billion)
11.4.12.4 Singapore Serverless Architecture Market Estimates and Forecasts, By Vertical (2020-2032) (USD Billion)
11.4.13 Australia
11.4.13.1 Australia Serverless Architecture Market Estimates and Forecasts, By Services (2020-2032) (USD Billion)
11.4.13.2 Australia Serverless Architecture Market Estimates and Forecasts, By Deployment (2020-2032) (USD Billion)
11.4.13.3 Australia Serverless Architecture Market Estimates and Forecasts, By Organization Size (2020-2032) (USD Billion)
11.4.13.4 Australia Serverless Architecture Market Estimates and Forecasts, By Vertical (2020-2032) (USD Billion)
11.4.14 Rest of Asia Pacific
11.4.14.1 Rest of Asia Pacific Serverless Architecture Market Estimates and Forecasts, By Services (2020-2032) (USD Billion)
11.4.14.2 Rest of Asia Pacific Serverless Architecture Market Estimates and Forecasts, By Deployment (2020-2032) (USD Billion)
11.4.14.3 Rest of Asia Pacific Serverless Architecture Market Estimates and Forecasts, By Organization Size (2020-2032) (USD Billion)
11.4.14.4 Rest of Asia Pacific Serverless Architecture Market Estimates and Forecasts, By Vertical (2020-2032) (USD Billion)
11.5 Middle East and Africa
11.5.1 Middle East
11.5.1.1 Trends Analysis
11.5.1.2 Middle East Serverless Architecture Market Estimates and Forecasts, by Country (2020-2032) (USD Billion)
11.5.1.3 Middle East Serverless Architecture Market Estimates and Forecasts, By Services (2020-2032) (USD Billion)
11.5.1.4 Middle East Serverless Architecture Market Estimates and Forecasts, By Deployment (2020-2032) (USD Billion)
11.5.1.5 Middle East Serverless Architecture Market Estimates and Forecasts, By Organization Size (2020-2032) (USD Billion)
11.5.1.6 Middle East Serverless Architecture Market Estimates and Forecasts, By Vertical (2020-2032) (USD Billion)
11.5.1.7 UAE
11.5.1.7.1 UAE Serverless Architecture Market Estimates and Forecasts, By Services (2020-2032) (USD Billion)
11.5.1.7.2 UAE Serverless Architecture Market Estimates and Forecasts, By Deployment (2020-2032) (USD Billion)
11.5.1.7.3 UAE Serverless Architecture Market Estimates and Forecasts, By Organization Size (2020-2032) (USD Billion)
11.5.1.7.4 UAE Serverless Architecture Market Estimates and Forecasts, By Vertical (2020-2032) (USD Billion)
11.5.1.8 Egypt
11.5.1.8.1 Egypt Serverless Architecture Market Estimates and Forecasts, By Services (2020-2032) (USD Billion)
11.5.1.8.2 Egypt Serverless Architecture Market Estimates and Forecasts, By Deployment (2020-2032) (USD Billion)
11.5.1.8.3 Egypt Serverless Architecture Market Estimates and Forecasts, By Organization Size (2020-2032) (USD Billion)
11.5.1.8.4 Egypt Serverless Architecture Market Estimates and Forecasts, By Vertical (2020-2032) (USD Billion)
11.5.1.9 Saudi Arabia
11.5.1.9.1 Saudi Arabia Serverless Architecture Market Estimates and Forecasts, By Services (2020-2032) (USD Billion)
11.5.1.9.2 Saudi Arabia Serverless Architecture Market Estimates and Forecasts, By Deployment (2020-2032) (USD Billion)
11.5.1.9.3 Saudi Arabia Serverless Architecture Market Estimates and Forecasts, By Organization Size (2020-2032) (USD Billion)
11.5.1.9.4 Saudi Arabia Serverless Architecture Market Estimates and Forecasts, By Vertical (2020-2032) (USD Billion)
11.5.1.10 Qatar
11.5.1.10.1 Qatar Serverless Architecture Market Estimates and Forecasts, By Services (2020-2032) (USD Billion)
11.5.1.10.2 Qatar Serverless Architecture Market Estimates and Forecasts, By Deployment (2020-2032) (USD Billion)
11.5.1.10.3 Qatar Serverless Architecture Market Estimates and Forecasts, By Organization Size (2020-2032) (USD Billion)
11.5.1.10.4 Qatar Serverless Architecture Market Estimates and Forecasts, By Vertical (2020-2032) (USD Billion)
11.5.1.11 Rest of Middle East
11.5.1.11.1 Rest of Middle East Serverless Architecture Market Estimates and Forecasts, By Services (2020-2032) (USD Billion)
11.5.1.11.2 Rest of Middle East Serverless Architecture Market Estimates and Forecasts, By Deployment (2020-2032) (USD Billion)
11.5.1.11.3 Rest of Middle East Serverless Architecture Market Estimates and Forecasts, By Organization Size (2020-2032) (USD Billion)
11.5.1.11.4 Rest of Middle East Serverless Architecture Market Estimates and Forecasts, By Vertical (2020-2032) (USD Billion)
11.5.2 Africa
11.5.2.1 Trends Analysis
11.5.2.2 Africa Serverless Architecture Market Estimates and Forecasts, by Country (2020-2032) (USD Billion)
11.5.2.3 Africa Serverless Architecture Market Estimates and Forecasts, By Services (2020-2032) (USD Billion)
11.5.2.4 Africa Serverless Architecture Market Estimates and Forecasts, By Deployment (2020-2032) (USD Billion)
11.5.2.5 Africa Serverless Architecture Market Estimates and Forecasts, By Organization Size (2020-2032) (USD Billion)
11.5.2.6 Africa Serverless Architecture Market Estimates and Forecasts, By Vertical (2020-2032) (USD Billion)
11.5.2.7 South Africa
11.5.2.7.1 South Africa Serverless Architecture Market Estimates and Forecasts, By Services (2020-2032) (USD Billion)
11.5.2.7.2 South Africa Serverless Architecture Market Estimates and Forecasts, By Deployment (2020-2032) (USD Billion)
11.5.2.7.3 South Africa Serverless Architecture Market Estimates and Forecasts, By Organization Size (2020-2032) (USD Billion)
11.5.2.7.4 South Africa Serverless Architecture Market Estimates and Forecasts, By Vertical (2020-2032) (USD Billion)
11.5.2.8 Nigeria
11.5.2.8.1 Nigeria Serverless Architecture Market Estimates and Forecasts, By Services (2020-2032) (USD Billion)
11.5.2.8.2 Nigeria Serverless Architecture Market Estimates and Forecasts, By Deployment (2020-2032) (USD Billion)
11.5.2.8.3 Nigeria Serverless Architecture Market Estimates and Forecasts, By Organization Size (2020-2032) (USD Billion)
11.5.2.8.4 Nigeria Serverless Architecture Market Estimates and Forecasts, By Vertical (2020-2032) (USD Billion)
11.5.2.9 Rest of Africa
11.5.2.9.1 Rest of Africa Serverless Architecture Market Estimates and Forecasts, By Services (2020-2032) (USD Billion)
11.5.2.9.2 Rest of Africa Serverless Architecture Market Estimates and Forecasts, By Deployment (2020-2032) (USD Billion)
11.5.2.9.3 Rest of Africa Serverless Architecture Market Estimates and Forecasts, By Organization Size (2020-2032) (USD Billion)
11.5.2.9.4 Rest of Africa Serverless Architecture Market Estimates and Forecasts, By Vertical (2020-2032) (USD Billion)
11.6 Latin America
11.6.1 Trends Analysis
11.6.2 Latin America Serverless Architecture Market Estimates and Forecasts, by Country (2020-2032) (USD Billion)
11.6.3 Latin America Serverless Architecture Market Estimates and Forecasts, By Services (2020-2032) (USD Billion)
11.6.4 Latin America Serverless Architecture Market Estimates and Forecasts, By Deployment (2020-2032) (USD Billion)
11.6.5 Latin America Serverless Architecture Market Estimates and Forecasts, By Organization Size (2020-2032) (USD Billion)
11.6.6 Latin America Serverless Architecture Market Estimates and Forecasts, By Vertical (2020-2032) (USD Billion)
11.6.7 Brazil
11.6.7.1 Brazil Serverless Architecture Market Estimates and Forecasts, By Services (2020-2032) (USD Billion)
11.6.7.2 Brazil Serverless Architecture Market Estimates and Forecasts, By Deployment (2020-2032) (USD Billion)
11.6.7.3 Brazil Serverless Architecture Market Estimates and Forecasts, By Organization Size (2020-2032) (USD Billion)
11.6.7.4 Brazil Serverless Architecture Market Estimates and Forecasts, By Vertical (2020-2032) (USD Billion)
11.6.8 Argentina
11.6.8.1 Argentina Serverless Architecture Market Estimates and Forecasts, By Services (2020-2032) (USD Billion)
11.6.8.2 Argentina Serverless Architecture Market Estimates and Forecasts, By Deployment (2020-2032) (USD Billion)
11.6.8.3 Argentina Serverless Architecture Market Estimates and Forecasts, By Organization Size (2020-2032) (USD Billion)
11.6.8.4 Argentina Serverless Architecture Market Estimates and Forecasts, By Vertical (2020-2032) (USD Billion)
11.6.9 Colombia
11.6.9.1 Colombia Serverless Architecture Market Estimates and Forecasts, By Services (2020-2032) (USD Billion)
11.6.9.2 Colombia Serverless Architecture Market Estimates and Forecasts, By Deployment (2020-2032) (USD Billion)
11.6.9.3 Colombia Serverless Architecture Market Estimates and Forecasts, By Organization Size (2020-2032) (USD Billion)
11.6.9.4 Colombia Serverless Architecture Market Estimates and Forecasts, By Vertical (2020-2032) (USD Billion)
11.6.10 Rest of Latin America
11.6.10.1 Rest of Latin America Serverless Architecture Market Estimates and Forecasts, By Services (2020-2032) (USD Billion)
11.6.10.2 Rest of Latin America Serverless Architecture Market Estimates and Forecasts, By Deployment (2020-2032) (USD Billion)
11.6.10.3 Rest of Latin America Serverless Architecture Market Estimates and Forecasts, By Organization Size (2020-2032) (USD Billion)
11.6.10.4 Rest of Latin America Serverless Architecture Market Estimates and Forecasts, By Vertical (2020-2032) (USD Billion)
12. Company Profiles
12.1 Alibaba.com
12.1.1 Company Overview
12.1.2 Financial
12.1.3 Products/ Services Offered
12.1.4 SWOT Analysis
12.2 Cloudflare, Inc.
12.2.1 Company Overview
12.2.2 Financial
12.2.3 Products/ Services Offered
12.2.4 SWOT Analysis
12.3 Google
12.3.1 Company Overview
12.3.2 Financial
12.3.3 Products/ Services Offered
12.3.4 SWOT Analysis
12.4 IBM
12.4.1 Company Overview
12.4.2 Financial
12.4.3 Products/ Services Offered
12.4.4 SWOT Analysis
12.5 Microsoft
12.5.1 Company Overview
12.5.2 Financial
12.5.3 Products/ Services Offered
12.5.4 SWOT Analysis
12.6 NTT DATA Group Corporation
12.6.1 Company Overview
12.6.2 Financial
12.6.3 Products/ Services Offered
12.6.4 SWOT Analysis
12.7 Oracle
12.7.1 Company Overview
12.7.2 Financial
12.7.3 Products/ Services Offered
12.7.4 SWOT Analysis
12.8 TIBCO Software (Cloud Software Group, Inc.)
12.8.1 Company Overview
12.8.2 Financial
12.8.3 Products/ Services Offered
12.8.4 SWOT Analysis
12.9 Amazon
12.9.1 Company Overview
12.9.2 Financial
12.9.3 Products/ Services Offered
12.9.4 SWOT Analysis
12.10 Rackspace Technology, Inc.
12.10.1 Company Overview
12.10.2 Financial
12.10.3 Products/ Services Offered
12.10.4 SWOT Analysis
13. Use Cases and Best Practices
14. Conclusion
An accurate research report requires proper strategizing as well as implementation. There are multiple factors involved in the completion of good and accurate research report and selecting the best methodology to compete the research is the toughest part. Since the research reports we provide play a crucial role in any company’s decision-making process, therefore we at SNS Insider always believe that we should choose the best method which gives us results closer to reality. This allows us to reach at a stage wherein we can provide our clients best and accurate investment to output ratio.
Each report that we prepare takes a timeframe of 350-400 business hours for production. Starting from the selection of titles through a couple of in-depth brain storming session to the final QC process before uploading our titles on our website we dedicate around 350 working hours. The titles are selected based on their current market cap and the foreseen CAGR and growth.
The 5 steps process:
Step 1: Secondary Research:
Secondary Research or Desk Research is as the name suggests is a research process wherein, we collect data through the readily available information. In this process we use various paid and unpaid databases which our team has access to and gather data through the same. This includes examining of listed companies’ annual reports, Journals, SEC filling etc. Apart from this our team has access to various associations across the globe across different industries. Lastly, we have exchange relationships with various university as well as individual libraries.
Step 2: Primary Research
When we talk about primary research, it is a type of study in which the researchers collect relevant data samples directly, rather than relying on previously collected data. This type of research is focused on gaining content specific facts that can be sued to solve specific problems. Since the collected data is fresh and first hand therefore it makes the study more accurate and genuine.
We at SNS Insider have divided Primary Research into 2 parts.
Part 1 wherein we interview the KOLs of major players as well as the upcoming ones across various geographic regions. This allows us to have their view over the market scenario and acts as an important tool to come closer to the accurate market numbers. As many as 45 paid and unpaid primary interviews are taken from both the demand and supply side of the industry to make sure we land at an accurate judgement and analysis of the market.
This step involves the triangulation of data wherein our team analyses the interview transcripts, online survey responses and observation of on filed participants. The below mentioned chart should give a better understanding of the part 1 of the primary interview.
Part 2: In this part of primary research the data collected via secondary research and the part 1 of the primary research is validated with the interviews from individual consultants and subject matter experts.
Consultants are those set of people who have at least 12 years of experience and expertise within the industry whereas Subject Matter Experts are those with at least 15 years of experience behind their back within the same space. The data with the help of two main processes i.e., FGDs (Focused Group Discussions) and IDs (Individual Discussions). This gives us a 3rd party nonbiased primary view of the market scenario making it a more dependable one while collation of the data pointers.
Step 3: Data Bank Validation
Once all the information is collected via primary and secondary sources, we run that information for data validation. At our intelligence centre our research heads track a lot of information related to the market which includes the quarterly reports, the daily stock prices, and other relevant information. Our data bank server gets updated every fortnight and that is how the information which we collected using our primary and secondary information is revalidated in real time.
Step 4: QA/QC Process
After all the data collection and validation our team does a final level of quality check and quality assurance to get rid of any unwanted or undesired mistakes. This might include but not limited to getting rid of the any typos, duplication of numbers or missing of any important information. The people involved in this process include technical content writers, research heads and graphics people. Once this process is completed the title gets uploader on our platform for our clients to read it.
Step 5: Final QC/QA Process:
This is the last process and comes when the client has ordered the study. In this process a final QA/QC is done before the study is emailed to the client. Since we believe in giving our clients a good experience of our research studies, therefore, to make sure that we do not lack at our end in any way humanly possible we do a final round of quality check and then dispatch the study to the client.
Key Segments:
By Services
Automation & Integration
API Management
Monitoring
Security
Support and Maintenance
Training and Consulting
Others
By Deployment
Public Cloud
Private Cloud
Hybrid Cloud
By Organization Size
Large Enterprise
SME
By Vertical
IT and Telecom
Healthcare
Retail and E-commerce
Banking, Financial Services, and Insurance (BFSI)
Government
Education
Others
Request for Segment Customization as per your Business Requirement: Segment Customization Request
Regional Coverage:
North America
US
Canada
Mexico
Europe
Eastern Europe
Poland
Romania
Hungary
Turkey
Rest of Eastern Europe
Western Europe
Germany
France
UK
Italy
Spain
Netherlands
Switzerland
Austria
Rest of Western Europe
Asia Pacific
China
India
Japan
South Korea
Vietnam
Singapore
Australia
Rest of Asia Pacific
Middle East & Africa
Middle East
UAE
Egypt
Saudi Arabia
Qatar
Rest of the Middle East
Africa
Nigeria
South Africa
Rest of Africa
Latin America
Brazil
Argentina
Colombia
Rest of Latin America
Request for Country Level Research Report: Country Level Customization Request
Available Customization
With the given market data, SNS Insider offers customization as per the company’s specific needs. The following customization options are available for the report:
Product Analysis
Criss-Cross segment analysis (e.g. Product X Application)
Product Matrix which gives a detailed comparison of the product portfolio of each company
Geographic Analysis
Additional countries in any of the regions
Company Information
Detailed analysis and profiling of additional market players (Up to five)
The 5G Chipset Market Size was valued at USD 37.80 Billion in 2023 and is expected to reach USD 181.25 Billion by 2032 and grow at a CAGR of 19.04% over the forecast period 2024-2032.
Industrial IoT (IIoT) Platform Market was valued at USD 9.8 billion in 2023 and is expected to reach USD 30.33 billion by 2032, growing at a CAGR of 13.41% from 2024-2032.
The E-reader market, valued at USD 7.28 billion in 2023, is set to expand significantly, reaching an impressive USD 12.65 billion by 2032. This growth reflects a healthy CAGR of 6.34% over the forecast period 2024 to 2032.
The Workforce Management Market Size was valued at USD 8.5 Billion in 2023 and will reach USD 19.4 Billion by 2032, growing at a CAGR of 9.6% by 2032.
Digital Asset Management Market Size was valued at USD 4.3 Billion in 2023 and is expected to reach USD 16 Billion by 2032, growing at a CAGR of 15.7% over the forecast period 2024-2032.
The Over-the-Top (OTT) Market size was valued at USD 235.8 Billion in 2023 and is expected to reach USD 1390.8 Billion and CAGR of 21.8% by 2032.
Hi! Click one of our member below to chat on Phone