Semantic Knowledge Graphing Market was valued at USD 1.61 billion in 2023 and is expected to reach USD 5.07 billion by 2032, growing at a CAGR of 13.64% from 2024-2032. This report includes an analysis of adoption rates of emerging technologies, investment and funding trends, data volume and processing trends, and integration & API usage statistics. The market is witnessing rapid growth due to increasing demand for AI-driven data organization, enhanced search capabilities, and improved decision-making processes. Rising investments in AI, machine learning, and data analytics, along with the surge in big data, are driving adoption. Organizations are leveraging APIs for seamless integration, further fueling market expansion across industries such as BFSI, healthcare, and retail.
Drivers
AI and Machine Learning Revolutionizing Semantic Knowledge Graphing for Advanced Data Structuring, Real-Time Insights, and Intelligent Automation Across Industries.
The integration of AI and machine learning is revolutionizing semantic knowledge graphing by allowing sophisticated data structuring and contextualization. AI-based algorithms improve the capacity to process, connect, and analyze massive datasets, enabling greater insights and automation across sectors. With more organizations turning to data-driven decision-making, AI-powered semantic knowledge graphs enable real-time information access, simplifying complexity and enhancing efficiency. Machine learning models regularly refine patterns among data points, optimizing predictive analytics and relevance of search results. Such progression supports usage areas across enterprise knowledge management, conversational AI, and cybersecurity and inspires innovation across connecting data as well as utilization. Increasing the requirement for smarter automation and deep analytics also increasingly boosts adoption across AI-fortified semantic graphing solutions.
Restraints
High Implementation Costs Restrict Adoption of AI-Powered Semantic Knowledge Graphing, Limiting Accessibility for Small and Mid-Sized Enterprises.
Use of AI-enabled semantic knowledge graphing is most frequently inhibited due to the excessive amount of finances needed for execution. Sophisticated infrastructure, qualified staff, and AI-capable data handling software require big initial investments of money, discouraging smaller business entities from bringing these solutions aboard. Furthermore, continuous upkeep and scalability are additional operation expenses that further hinder mass deployment. Most companies lack the justification to make returns from investment, particularly when common needs can be handled by standard data management systems. Consequently, resource-demanding uptake hampers market growth with only major business corporations and technological companies in a position to unlock full advantage. Minimizing cost hindrances and enhancing openness will prove central to increasing widespread market entry as well as ultimate growth.
Opportunities
Semantic Knowledge Graphing Enhances IoT and Smart Systems with Real-Time Data Processing, Intelligent Insights, and Seamless Connectivity Across Industries.
The increasing use of IoT and smart systems is fueling demand for sophisticated data processing, and semantic knowledge graphing is a key facilitator of real-time insights. With billions of connected devices creating enormous amounts of data, efficient structuring of this information is critical to optimizing performance, predictive maintenance, and decision-making. Semantic graphs advance interoperability through the connection of heterogeneous data sources, enhancing context awareness in IoT networks. Real-time analytics and smart automation benefit industries like smart manufacturing, smart cities, and autonomous systems. Semantic graphing enhances operational effectiveness, speeds innovation, and creates new opportunities for AI-based smart technologies in numerous industries by providing seamless data sharing across connected environments.
Challenges
Data Quality and Inconsistency Issues Hinder Effective Semantic Knowledge Graphing, Leading to Errors, Redundancy, and Reduced Decision-Making Accuracy.
The process of incorporating disparate and unstructured data sources into semantic knowledge graphs is fraught with challenges, which more often than not results in errors, redundancy, and inconsistency. With the data coming from different systems, differences in formats, terminologies, and levels of accuracy can make the effectiveness of knowledge representation suffer. Low data quality impacts the accuracy of insights, making AI-powered analytics and automation less efficient. Also, consistency in updating real-time data needs sound validation processes, which are often resource-intensive and cumbersome. Organizations need to implement sophisticated data cleansing, normalization, and data governance frameworks to be assured. Solving these problems is critical to realizing the maximum potential of semantic graphing for industries that make decisions based on accurate and structured information.
By Industry Vertical
The BFSI segment led the Semantic Knowledge Graphing Market with the largest revenue share of around 25% in 2023. The sector is influenced by the sector's dependency on sophisticated data analytics, risk analysis, and fraud detection products. Semantic knowledge graphs allow financial institutions to organize large volumes of unstructured data, enhancing compliance, customer intelligence, and transaction monitoring. Moreover, BFSI companies utilize these graphs for regulatory reporting, anti-money laundering (AML) initiatives, and customized financial services, further establishing their dominance in this space.
The IT & Telecom sector is anticipated to expand at the fastest CAGR of approximately 16.03% during 2024-2032. This expansion is driven by the growing demand for smart data management, network optimization, and AI-based automation in telecom operations. With the fast growth of 5G, IoT, and cloud services, semantic knowledge graphs assist in enhancing data interoperability, cybersecurity, and customer service analytics. The industry's ongoing drive for digital transformation and automation fuels adoption, making it the fastest-growing segment in the market.
By Data Source
The Unstructured segment led the Semantic Knowledge Graphing Market with the largest revenue share of approximately 55% in 2023. This is due to the enormous volumes of unstructured data created across industries, such as text, images, videos, and social media posts. Organizations find it difficult to derive useful insights from such data, hence the use of semantic knowledge graphs for effective data organization, retrieval, and analysis. The growing demand for AI-based solutions for processing unstructured data further reinforces the dominance of this segment.
The Structured segment is poised to grow at the fastest CAGR of approximately 15.39% during the forecast period 2024-2032. The growth is spurred by the growing demand for effective data categorization, governance, and compliance within enterprises. With businesses increasingly adopting AI and analytics-based decision-making, structured data provides a better organized and standardized form of integration. The need for real-time data processing, compliance with regulations, and enterprise knowledge management propels the usage of semantic knowledge graphing even further for structured data.
By Application
The Semantic Search segment held the largest revenue share of around 31% in 2023 for the Semantic Knowledge Graphing Market. This is owing to the rising need for improved and contextually aware search features across various industries. Businesses and consumers use semantic search to access pertinent information out of massive datasets, enhancing user experience and choice-making. The incorporation of AI, natural language processing (NLP), and machine learning in search engines improves search accuracy even further, and semantic search is a major application of knowledge graphing.
The Information Retrieval segment is anticipated to grow at the fastest CAGR of nearly 15.90% between 2024 and 2032. The fast expansion is driven by the increased demand for sophisticated data extraction and organization methods among firms. As organizations manage enormous amounts of structured and unstructured information, semantic knowledge graph-driven information retrieval enhances efficiency, knowledge management, and decision-making. The surging implementation of AI-based analytics and enterprise search platforms fuel the growth of this segment across diverse industries.
By Type
The Context-rich Knowledge Graphs segment led the Semantic Knowledge Graphing Market with the largest revenue contribution of nearly 45% in 2023. The sector is driven by the heightened requirement for advanced data relationships and context-based insights in industries. These graphs allow companies to improve decision-making, recommendation systems, and AI applications by linking disparate data sources. Companies in finance, healthcare, and e-commerce use context-rich knowledge graphs to enhance personalization, risk assessment, and predictive analytics, solidifying their market dominance.
The NLP Knowledge Graphs market is anticipated to grow at the fastest CAGR of approximately 16.49% from 2024 to 2032. The high growth is driven by the rise in adoption of NLP for AI-based chatbots, virtual assistants, and enterprise search. Organizations need increasingly sophisticated methods of processing and interpreting human language, so that NLP-driven knowledge graphs are vital to contextual search, text analysis, and automated insights. Generative AI and conversational AI contribute further to growth in this segment.
By Task Type
Link Prediction segment held the largest share of revenue around 48% in 2023 in Semantic Knowledge Graphing Market. The reason behind the domination is due to its quintessential position for uncovering obscured relations in gigantic data sets, recommendation systems strengthening, fraud identification, and network analysis. These include finance, health, and e-commerce, which use link prediction in predictive analysis, personalized recommendations, and threat detection in cybersecurity. The gradual rise in the use of AI and machine learning further solidifies its position in optimizing knowledge graph applications.
The Link-based Clustering market is expected to grow at the fastest CAGR of 15.61% between 2024 and 2032. This accelerated growth is driven by increasing demand to categorize complicated data structures into relevant clusters. Organizations utilize link-based clustering for better data categorization, detection of communities, and identification of patterns within social networks, bioinformatics, and enterprise analytics. As more structured and effective grouping of data is needed due to applications involving artificial intelligence, adoption of link-based clustering surges in a number of industries.
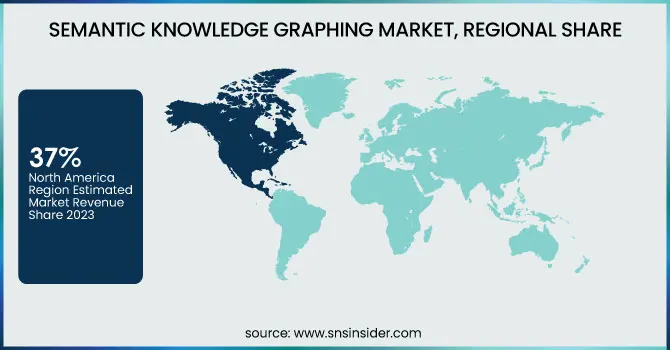
The North American region led the Semantic Knowledge Graphing Market in terms of revenue share of nearly 37% in 2023. It is fueled by the prominent existence of top-tier technology firms, early technology uptake of AI-driven solutions, and cutting-edge semantic technology research. The enterprises within the region adopt knowledge graphs in data analytics, cybersecurity, and automation in various industries like BFSI, healthcare, and IT. Moreover, heavy investments in AI, cloud computing, and big data analytics also enhance North America's market dominance.
The Asia Pacific region is anticipated to grow at the fastest CAGR of approximately 15.49% during 2024-2032. The high growth is driven by growing digital transformation activities, growing adoption of AI, and increasing IT infrastructure. Countries in the region are experiencing a boost in demand for AI-based analytics, enterprise search, and automation in industries like telecom, manufacturing, and e-commerce. Government policies encouraging AI research and smart city initiatives further fuel the uptake of semantic knowledge graphing solutions.
Amazon.com Inc. (Amazon Neptune, AWS Graph Database)
Baidu, Inc. (Baidu Knowledge Graph, PaddlePaddle)
Facebook Inc. (Facebook Graph API, DeepText)
Google LLC (Google Knowledge Graph, Google Cloud Dataproc)
Microsoft Corporation (Azure Cosmos DB, Microsoft Graph)
Mitsubishi Electric Corporation (Maisart AI, MELFA Smart Plus)
NELL (Never-Ending Language Learner, NELL Knowledge Graph)
Semantic Web Company (PoolParty Semantic Suite, Semantic Middleware)
YAGO (YAGO Knowledge Base, YAGO Ontology)
Yandex (Yandex Knowledge Graph, Yandex Cloud ML)
IBM Corporation (IBM Watson Discovery, IBM Graph)
Oracle Corporation (Oracle Spatial and Graph, Oracle Cloud AI)
SAP SE (SAP HANA Graph, SAP Data Intelligence)
Neo4j Inc. (Neo4j Graph Database, Neo4j Bloom)
Databricks Inc. (Databricks GraphFrames, Databricks Delta Lake)
Stardog Union (Stardog Knowledge Graph, Stardog Studio)
OpenAI (GPT-based Knowledge Graphs, OpenAI Embeddings)
Franz Inc. (AllegroGraph, Allegro CL)
Ontotext AD (GraphDB, Ontotext Platform)
Glean (Glean Knowledge Graph, Glean AI Search)
2024: Google expands AI Overviews to more search queries globally, even for logged-out users. It is also testing "AI Mode," an interactive chatbot-style search experience available to Google One AI Premium subscribers, providing AI-generated answers with real-time web data.
2024: Microsoft introduced a Microsoft Graph plugin for Semantic Kernel, enabling developers to integrate AI-driven task management with Microsoft Planner. This plugin allows seamless interaction with Microsoft Graph APIs, simplifying workflow automation and task creation within enterprise environments.
Report Attributes | Details |
---|---|
Market Size in 2023 | USD 1.61 Billion |
Market Size by 2032 | USD 5.07 Billion |
CAGR | CAGR of 13.64% From 2024 to 2032 |
Base Year | 2023 |
Forecast Period | 2024-2032 |
Historical Data | 2020-2022 |
Report Scope & Coverage | Market Size, Segments Analysis, Competitive Landscape, Regional Analysis, DROC & SWOT Analysis, Forecast Outlook |
Key Segments | • By Data Source (Structured, Unstructured, Semi-structured) • By Type (Context-rich Knowledge Graphs, External-sensing Knowledge Graphs, NLP Knowledge Graphs) • By Task Type (Link Prediction, Entity Resolution, Link-based Clustering) • By Application (Semantic Search, QnA Machines, Information Retrieval, Electronic Reading, Others) • By Industry Vertical (BFSI, Healthcare, IT & Telecom, Retail & E-commerce, Government, Others) |
Regional Analysis/Coverage | North America (US, Canada, Mexico), Europe (Eastern Europe [Poland, Romania, Hungary, Turkey, Rest of Eastern Europe] Western Europe] Germany, France, UK, Italy, Spain, Netherlands, Switzerland, Austria, Rest of Western Europe]), Asia Pacific (China, India, Japan, South Korea, Vietnam, Singapore, Australia, Rest of Asia Pacific), Middle East & Africa (Middle East [UAE, Egypt, Saudi Arabia, Qatar, Rest of Middle East], Africa [Nigeria, South Africa, Rest of Africa], Latin America (Brazil, Argentina, Colombia, Rest of Latin America) |
Company Profiles | Amazon.com Inc., Baidu, Inc., Facebook Inc., Google LLC, Microsoft Corporation, Mitsubishi Electric Corporation, NELL, Semantic Web Company, YAGO, Yandex, IBM Corporation, Oracle Corporation, SAP SE, Neo4j Inc., Databricks Inc., Stardog Union, OpenAI, Franz Inc., Ontotext AD, Glean |
ANS: Semantic Knowledge Graphing Market was valued at USD 1.61 billion in 2023 and is expected to reach USD 5.07 billion by 2032, growing at a CAGR of 13.64% from 2024-2032.
ANS: The BFSI segment dominated with a 25% revenue share.
ANS: The Unstructured data segment led with a 55% market share.
ANS: The Semantic Search segment led with a 31% revenue share.
ANS: North America dominated with a 37% revenue share.
Table of Contents:
1. Introduction
1.1 Market Definition
1.2 Scope (Inclusion and Exclusions)
1.3 Research Assumptions
2. Executive Summary
2.1 Market Overview
2.2 Regional Synopsis
2.3 Competitive Summary
3. Research Methodology
3.1 Top-Down Approach
3.2 Bottom-up Approach
3.3. Data Validation
3.4 Primary Interviews
4. Market Dynamics Impact Analysis
4.1 Market Driving Factors Analysis
4.1.1 Drivers
4.1.2 Restraints
4.2 PESTLE Analysis
4.3 Porter’s Five Forces Model
5. Statistical Insights and Trends Reporting
5.1 Adoption Rates of Emerging Technologies
5.2 Investment & Funding Trends
5.3 Data Volume & Processing Trends
5.4 Integration & API Usage Statistics
6. Competitive Landscape
6.1 List of Major Companies, By Region
6.2 Market Share Analysis, By Region
6.3 Product Benchmarking
6.3.1 Product specifications and features
6.3.2 Pricing
6.4 Strategic Initiatives
6.4.1 Marketing and promotional activities
6.4.2 Distribution and supply chain strategies
6.4.3 Expansion plans and new product launches
6.4.4 Strategic partnerships and collaborations
6.5 Technological Advancements
6.6 Market Positioning and Branding
7. Semantic Knowledge Graphing Market Segmentation, By Data Source
7.1 Chapter Overview
7.2 Structured
7.2.1 Structured Market Trends Analysis (2020-2032)
7.2.2 Structured Market Size Estimates and Forecasts to 2032 (USD Billion)
7.3 Unstructured
7.3.1 Unstructured Market Trends Analysis (2020-2032)
7.3.2 Unstructured Market Size Estimates and Forecasts to 2032 (USD Billion)
7.4 Semi-structured
7.4.1 Semi-structured Market Trends Analysis (2020-2032)
7.4.2 Semi-structured Market Size Estimates and Forecasts to 2032 (USD Billion)
8. Semantic Knowledge Graphing Market Segmentation, By Industry Vertical
8.1 Chapter Overview
8.2 BFSI
8.2.1 BFSI Market Trends Analysis (2020-2032)
8.2.2 BFSI Market Size Estimates And Forecasts To 2032 (USD Billion)
8.3 Healthcare
8.3.1 Healthcare Market Trends Analysis (2020-2032)
8.3.2 Healthcare Market Size Estimates And Forecasts To 2032 (USD Billion)
8.4 IT & Telecom
8.4.1 IT & Telecom Market Trends Analysis (2020-2032)
8.4.2 IT & Telecom Market Size Estimates And Forecasts To 2032 (USD Billion)
8.5 Retail & E-commerce
8.5.1 Retail & E-commerce Market Trends Analysis (2020-2032)
8.5.2 Retail & E-commerce Market Size Estimates And Forecasts To 2032 (USD Billion)
8.6 Government
8.6.1 Government Market Trends Analysis (2020-2032)
8.6.2 Government Market Size Estimates And Forecasts To 2032 (USD Billion)
8.7 Others
8.7.1 Others Market Trends Analysis (2020-2032)
8.7.2 Others Market Size Estimates And Forecasts To 2032 (USD Billion)
9. Semantic Knowledge Graphing Market Segmentation, By Application
9.1 Chapter Overview
9.2 Semantic Search
9.2.1 Semantic Search Market Trends Analysis (2020-2032)
9.2.2 Semantic Search Market Size Estimates And Forecasts To 2032 (USD Billion)
9.3 QnA Machines
9.3.1 QnA Machines Market Trends Analysis (2020-2032)
9.3.2 QnA Machines Market Size Estimates And Forecasts To 2032 (USD Billion)
9.4 Information Retrieval
9.4.1 Information Retrieval Market Trends Analysis (2020-2032)
9.4.2 Information Retrieval Market Size Estimates And Forecasts To 2032 (USD Billion)
9.5 Electronic Reading
9.5.1 Electronic Reading Market Trends Analysis (2020-2032)
9.5.2 Electronic Reading Market Size Estimates And Forecasts To 2032 (USD Billion)
9.6 Others
9.6.1 Others Market Trends Analysis (2020-2032)
9.6.2 Others Market Size Estimates And Forecasts To 2032 (USD Billion)
10. Semantic Knowledge Graphing Market Segmentation, By Type
10.1 Chapter Overview
10.2 Context-rich Knowledge Graphs
10.2.1 Context-rich Knowledge Graphs Market Trends Analysis (2020-2032)
10.2.2 Context-rich Knowledge Graphs Market Size Estimates And Forecasts To 2032 (USD Billion)
10.3 External-sensing Knowledge Graphs
10.3.1 External-sensing Knowledge Graphs Market Trends Analysis (2020-2032)
10.3.2 External-sensing Knowledge Graphs Market Size Estimates And Forecasts To 2032 (USD Billion)
10.4 NLP Knowledge Graphs
10.4.1 NLP Knowledge Graphs Market Trends Analysis (2020-2032)
10.4.2 NLP Knowledge Graphs Market Size Estimates And Forecasts To 2032 (USD Billion)
11. Semantic Knowledge Graphing Market Segmentation, By Task Type
11.1 Chapter Overview
11.2 Link Prediction
11.2.1 Link Prediction Market Trends Analysis (2020-2032)
11.2.2 Link Prediction Market Size Estimates And Forecasts To 2032 (USD Billion)
11.3 Entity Resolution
11.3.1 Entity Resolution Market Trends Analysis (2020-2032)
11.3.2 Entity Resolution Market Size Estimates And Forecasts To 2032 (USD Billion)
11.4 Link-based Clustering
11.4.1 Link-based Clustering Market Trends Analysis (2020-2032)
11.4.2 Link-based Clustering Market Size Estimates And Forecasts To 2032 (USD Billion)
12. Regional Analysis
12.1 Chapter Overview
12.2 North America
12.2.1 Trends Analysis
12.2.2 North America Semantic Knowledge Graphing Market Estimates And Forecasts, By Country (2020-2032) (USD Billion)
12.2.3 North America Semantic Knowledge Graphing Market Estimates And Forecasts, By Data Source (2020-2032) (USD Billion)
12.2.4 North America Semantic Knowledge Graphing Market Estimates And Forecasts, By Industry Vertical (2020-2032) (USD Billion)
12.2.5 North America Semantic Knowledge Graphing Market Estimates And Forecasts, By Application (2020-2032) (USD Billion)
12.2.6 North America Semantic Knowledge Graphing Market Estimates And Forecasts, By Type (2020-2032) (USD Billion)
12.2.7 North America Semantic Knowledge Graphing Market Estimates And Forecasts, By Task Type (2020-2032) (USD Billion)
12.2.8 USA
12.2.8.1 USA Semantic Knowledge Graphing Market Estimates And Forecasts, By Data Source (2020-2032) (USD Billion)
12.2.8.2 USA Semantic Knowledge Graphing Market Estimates And Forecasts, By Industry Vertical (2020-2032) (USD Billion)
12.2.8.3 USA Semantic Knowledge Graphing Market Estimates And Forecasts, By Application (2020-2032) (USD Billion)
12.2.8.4 USA Semantic Knowledge Graphing Market Estimates And Forecasts, By Type (2020-2032) (USD Billion)
12.2.8.5 USA Semantic Knowledge Graphing Market Estimates And Forecasts, By Task Type (2020-2032) (USD Billion)
12.2.9 Canada
12.2.9.1 Canada Semantic Knowledge Graphing Market Estimates And Forecasts, By Data Source (2020-2032) (USD Billion)
12.2.9.2 Canada Semantic Knowledge Graphing Market Estimates And Forecasts, By Industry Vertical (2020-2032) (USD Billion)
12.2.9.3 Canada Semantic Knowledge Graphing Market Estimates And Forecasts, By Application (2020-2032) (USD Billion)
12.2.9.4 Canada Semantic Knowledge Graphing Market Estimates And Forecasts, By Type (2020-2032) (USD Billion)
12.2.9.5 Canada Semantic Knowledge Graphing Market Estimates And Forecasts, By Task Type (2020-2032) (USD Billion)
12.2.10 Mexico
12.2.10.1 Mexico Semantic Knowledge Graphing Market Estimates And Forecasts, By Data Source (2020-2032) (USD Billion)
12.2.10.2 Mexico Semantic Knowledge Graphing Market Estimates And Forecasts, By Industry Vertical (2020-2032) (USD Billion)
12.2.10.3 Mexico Semantic Knowledge Graphing Market Estimates And Forecasts, By Application (2020-2032) (USD Billion)
12.2.10.4 Mexico Semantic Knowledge Graphing Market Estimates And Forecasts, By Type (2020-2032) (USD Billion)
12.2.10.5 Mexico Semantic Knowledge Graphing Market Estimates And Forecasts, By Task Type (2020-2032) (USD Billion)
12.3 Europe
12.3.1 Eastern Europe
12.3.1.1 Trends Analysis
12.3.1.2 Eastern Europe Semantic Knowledge Graphing Market Estimates And Forecasts, By Country (2020-2032) (USD Billion)
12.3.1.3 Eastern Europe Semantic Knowledge Graphing Market Estimates And Forecasts, By Data Source (2020-2032) (USD Billion)
12.3.1.4 Eastern Europe Semantic Knowledge Graphing Market Estimates And Forecasts, By Industry Vertical (2020-2032) (USD Billion)
12.3.1.5 Eastern Europe Semantic Knowledge Graphing Market Estimates And Forecasts, By Application (2020-2032) (USD Billion)
12.3.1.6 Eastern Europe Semantic Knowledge Graphing Market Estimates And Forecasts, By Type (2020-2032) (USD Billion)
12.3.1.7 Eastern Europe Semantic Knowledge Graphing Market Estimates And Forecasts, By Task Type (2020-2032) (USD Billion)
12.3.1.8 Poland
12.3.1.8.1 Poland Semantic Knowledge Graphing Market Estimates And Forecasts, By Data Source (2020-2032) (USD Billion)
12.3.1.8.2 Poland Semantic Knowledge Graphing Market Estimates And Forecasts, By Industry Vertical (2020-2032) (USD Billion)
12.3.1.8.3 Poland Semantic Knowledge Graphing Market Estimates And Forecasts, By Application (2020-2032) (USD Billion)
12.3.1.8.4 Poland Semantic Knowledge Graphing Market Estimates And Forecasts, By Type (2020-2032) (USD Billion)
12.3.1.8.5 Poland Semantic Knowledge Graphing Market Estimates And Forecasts, By Task Type (2020-2032) (USD Billion)
12.3.1.9 Romania
12.3.1.9.1 Romania Semantic Knowledge Graphing Market Estimates And Forecasts, By Data Source (2020-2032) (USD Billion)
12.3.1.9.2 Romania Semantic Knowledge Graphing Market Estimates And Forecasts, By Industry Vertical (2020-2032) (USD Billion)
12.3.1.9.3 Romania Semantic Knowledge Graphing Market Estimates And Forecasts, By Application (2020-2032) (USD Billion)
12.3.1.9.4 Romania Semantic Knowledge Graphing Market Estimates And Forecasts, By Type (2020-2032) (USD Billion)
12.3.1.9.5 Romania Semantic Knowledge Graphing Market Estimates And Forecasts, By Task Type (2020-2032) (USD Billion)
12.3.1.10 Hungary
12.3.1.10.1 Hungary Semantic Knowledge Graphing Market Estimates And Forecasts, By Data Source (2020-2032) (USD Billion)
12.3.1.10.2 Hungary Semantic Knowledge Graphing Market Estimates And Forecasts, By Industry Vertical (2020-2032) (USD Billion)
12.3.1.10.3 Hungary Semantic Knowledge Graphing Market Estimates And Forecasts, By Application (2020-2032) (USD Billion)
12.3.1.10.4 Hungary Semantic Knowledge Graphing Market Estimates And Forecasts, By Type (2020-2032) (USD Billion)
12.3.1.10.5 Hungary Semantic Knowledge Graphing Market Estimates And Forecasts, By Task Type (2020-2032) (USD Billion)
12.3.1.11 Turkey
12.3.1.11.1 Turkey Semantic Knowledge Graphing Market Estimates And Forecasts, By Data Source (2020-2032) (USD Billion)
12.3.1.11.2 Turkey Semantic Knowledge Graphing Market Estimates And Forecasts, By Industry Vertical (2020-2032) (USD Billion)
12.3.1.11.3 Turkey Semantic Knowledge Graphing Market Estimates And Forecasts, By Application (2020-2032) (USD Billion)
12.3.1.11.4 Turkey Semantic Knowledge Graphing Market Estimates And Forecasts, By Type (2020-2032) (USD Billion)
12.3.1.11.5 Turkey Semantic Knowledge Graphing Market Estimates And Forecasts, By Task Type (2020-2032) (USD Billion)
12.3.1.12 Rest Of Eastern Europe
12.3.1.12.1 Rest Of Eastern Europe Semantic Knowledge Graphing Market Estimates And Forecasts, By Data Source (2020-2032) (USD Billion)
12.3.1.12.2 Rest Of Eastern Europe Semantic Knowledge Graphing Market Estimates And Forecasts, By Industry Vertical (2020-2032) (USD Billion)
12.3.1.12.3 Rest Of Eastern Europe Semantic Knowledge Graphing Market Estimates And Forecasts, By Application (2020-2032) (USD Billion)
12.3.1.12.4 Rest Of Eastern Europe Semantic Knowledge Graphing Market Estimates And Forecasts, By Type (2020-2032) (USD Billion)
12.3.1.12.5 Rest Of Eastern Europe Semantic Knowledge Graphing Market Estimates And Forecasts, By Task Type (2020-2032) (USD Billion)
12.3.2 Western Europe
12.3.2.1 Trends Analysis
12.3.2.2 Western Europe Semantic Knowledge Graphing Market Estimates And Forecasts, By Country (2020-2032) (USD Billion)
12.3.2.3 Western Europe Semantic Knowledge Graphing Market Estimates And Forecasts, By Data Source (2020-2032) (USD Billion)
12.3.2.4 Western Europe Semantic Knowledge Graphing Market Estimates And Forecasts, By Industry Vertical (2020-2032) (USD Billion)
12.3.2.5 Western Europe Semantic Knowledge Graphing Market Estimates And Forecasts, By Application (2020-2032) (USD Billion)
12.3.2.6 Western Europe Semantic Knowledge Graphing Market Estimates And Forecasts, By Type (2020-2032) (USD Billion)
12.3.2.7 Western Europe Semantic Knowledge Graphing Market Estimates And Forecasts, By Task Type (2020-2032) (USD Billion)
12.3.2.8 Germany
12.3.2.8.1 Germany Semantic Knowledge Graphing Market Estimates And Forecasts, By Data Source (2020-2032) (USD Billion)
12.3.2.8.2 Germany Semantic Knowledge Graphing Market Estimates And Forecasts, By Industry Vertical (2020-2032) (USD Billion)
12.3.2.8.3 Germany Semantic Knowledge Graphing Market Estimates And Forecasts, By Application (2020-2032) (USD Billion)
12.3.2.8.4 Germany Semantic Knowledge Graphing Market Estimates And Forecasts, By Type (2020-2032) (USD Billion)
12.3.2.8.5 Germany Semantic Knowledge Graphing Market Estimates And Forecasts, By Task Type (2020-2032) (USD Billion)
12.3.2.9 France
12.3.2.9.1 France Semantic Knowledge Graphing Market Estimates And Forecasts, By Data Source (2020-2032) (USD Billion)
12.3.2.9.2 France Semantic Knowledge Graphing Market Estimates And Forecasts, By Industry Vertical (2020-2032) (USD Billion)
12.3.2.9.3 France Semantic Knowledge Graphing Market Estimates And Forecasts, By Application (2020-2032) (USD Billion)
12.3.2.9.4 France Semantic Knowledge Graphing Market Estimates And Forecasts, By Type (2020-2032) (USD Billion)
12.3.2.9.5 France Semantic Knowledge Graphing Market Estimates And Forecasts, By Task Type (2020-2032) (USD Billion)
12.3.2.10 UK
12.3.2.10.1 UK Semantic Knowledge Graphing Market Estimates And Forecasts, By Data Source (2020-2032) (USD Billion)
12.3.2.10.2 UK Semantic Knowledge Graphing Market Estimates And Forecasts, By Industry Vertical (2020-2032) (USD Billion)
12.3.2.10.3 UK Semantic Knowledge Graphing Market Estimates And Forecasts, By Application (2020-2032) (USD Billion)
12.3.2.10.4 UK Semantic Knowledge Graphing Market Estimates And Forecasts, By Type (2020-2032) (USD Billion)
12.3.2.10.5 UK Semantic Knowledge Graphing Market Estimates And Forecasts, By Task Type (2020-2032) (USD Billion)
12.3.2.11 Italy
12.3.2.11.1 Italy Semantic Knowledge Graphing Market Estimates And Forecasts, By Data Source (2020-2032) (USD Billion)
12.3.2.11.2 Italy Semantic Knowledge Graphing Market Estimates And Forecasts, By Industry Vertical (2020-2032) (USD Billion)
12.3.2.11.3 Italy Semantic Knowledge Graphing Market Estimates And Forecasts, By Application (2020-2032) (USD Billion)
12.3.2.11.4 Italy Semantic Knowledge Graphing Market Estimates And Forecasts, By Type (2020-2032) (USD Billion)
12.3.2.11.5 Italy Semantic Knowledge Graphing Market Estimates And Forecasts, By Task Type (2020-2032) (USD Billion)
12.3.2.12 Spain
12.3.2.12.1 Spain Semantic Knowledge Graphing Market Estimates And Forecasts, By Data Source (2020-2032) (USD Billion)
12.3.2.12.2 Spain Semantic Knowledge Graphing Market Estimates And Forecasts, By Industry Vertical (2020-2032) (USD Billion)
12.3.2.12.3 Spain Semantic Knowledge Graphing Market Estimates And Forecasts, By Application (2020-2032) (USD Billion)
12.3.2.12.4 Spain Semantic Knowledge Graphing Market Estimates And Forecasts, By Type (2020-2032) (USD Billion)
12.3.2.12.5 Spain Semantic Knowledge Graphing Market Estimates And Forecasts, By Task Type (2020-2032) (USD Billion)
12.3.2.13 Netherlands
12.3.2.13.1 Netherlands Semantic Knowledge Graphing Market Estimates And Forecasts, By Data Source (2020-2032) (USD Billion)
12.3.2.13.2 Netherlands Semantic Knowledge Graphing Market Estimates And Forecasts, By Industry Vertical (2020-2032) (USD Billion)
12.3.2.13.3 Netherlands Semantic Knowledge Graphing Market Estimates And Forecasts, By Application (2020-2032) (USD Billion)
12.3.2.13.4 Netherlands Semantic Knowledge Graphing Market Estimates And Forecasts, By Type (2020-2032) (USD Billion)
12.3.2.13.5 Netherlands Semantic Knowledge Graphing Market Estimates And Forecasts, By Task Type (2020-2032) (USD Billion)
12.3.2.14 Switzerland
12.3.2.14.1 Switzerland Semantic Knowledge Graphing Market Estimates And Forecasts, By Data Source (2020-2032) (USD Billion)
12.3.2.14.2 Switzerland Semantic Knowledge Graphing Market Estimates And Forecasts, By Industry Vertical (2020-2032) (USD Billion)
12.3.2.14.3 Switzerland Semantic Knowledge Graphing Market Estimates And Forecasts, By Application (2020-2032) (USD Billion)
12.3.2.14.4 Switzerland Semantic Knowledge Graphing Market Estimates And Forecasts, By Type (2020-2032) (USD Billion)
12.3.2.12.5 Switzerland Semantic Knowledge Graphing Market Estimates And Forecasts, By Task Type (2020-2032) (USD Billion)
12.3.2.15 Austria
12.3.2.15.1 Austria Semantic Knowledge Graphing Market Estimates And Forecasts, By Data Source (2020-2032) (USD Billion)
12.3.2.15.2 Austria Semantic Knowledge Graphing Market Estimates And Forecasts, By Industry Vertical (2020-2032) (USD Billion)
12.3.2.15.3 Austria Semantic Knowledge Graphing Market Estimates And Forecasts, By Application (2020-2032) (USD Billion)
12.3.2.15.4 Austria Semantic Knowledge Graphing Market Estimates And Forecasts, By Type (2020-2032) (USD Billion)
12.3.2.15.5 Austria Semantic Knowledge Graphing Market Estimates And Forecasts, By Task Type (2020-2032) (USD Billion)
12.3.2.16 Rest Of Western Europe
12.3.2.16.1 Rest Of Western Europe Semantic Knowledge Graphing Market Estimates And Forecasts, By Data Source (2020-2032) (USD Billion)
12.3.2.16.2 Rest Of Western Europe Semantic Knowledge Graphing Market Estimates And Forecasts, By Industry Vertical (2020-2032) (USD Billion)
12.3.2.16.3 Rest Of Western Europe Semantic Knowledge Graphing Market Estimates And Forecasts, By Application (2020-2032) (USD Billion)
12.3.2.16.4 Rest Of Western Europe Semantic Knowledge Graphing Market Estimates And Forecasts, By Type (2020-2032) (USD Billion)
12.3.2.16.5 Rest Of Western Europe Semantic Knowledge Graphing Market Estimates And Forecasts, By Task Type (2020-2032) (USD Billion)
12.4 Asia Pacific
12.4.1 Trends Analysis
12.4.2 Asia Pacific Semantic Knowledge Graphing Market Estimates And Forecasts, By Country (2020-2032) (USD Billion)
12.4.3 Asia Pacific Semantic Knowledge Graphing Market Estimates And Forecasts, By Data Source (2020-2032) (USD Billion)
12.4.4 Asia Pacific Semantic Knowledge Graphing Market Estimates And Forecasts, By Industry Vertical (2020-2032) (USD Billion)
12.4.5 Asia Pacific Semantic Knowledge Graphing Market Estimates And Forecasts, By Application (2020-2032) (USD Billion)
12.4.6 Asia Pacific Semantic Knowledge Graphing Market Estimates And Forecasts, By Type (2020-2032) (USD Billion)
12.4.7 Asia Pacific Semantic Knowledge Graphing Market Estimates And Forecasts, By Task Type (2020-2032) (USD Billion)
12.4.8 China
12.4.8.1 China Semantic Knowledge Graphing Market Estimates And Forecasts, By Data Source (2020-2032) (USD Billion)
12.4.8.2 China Semantic Knowledge Graphing Market Estimates And Forecasts, By Industry Vertical (2020-2032) (USD Billion)
12.4.8.3 China Semantic Knowledge Graphing Market Estimates And Forecasts, By Application (2020-2032) (USD Billion)
12.4.8.4 China Semantic Knowledge Graphing Market Estimates And Forecasts, By Type (2020-2032) (USD Billion)
12.4.8.5 China Semantic Knowledge Graphing Market Estimates And Forecasts, By Task Type (2020-2032) (USD Billion)
12.4.9 India
12.4.9.1 India Semantic Knowledge Graphing Market Estimates And Forecasts, By Data Source (2020-2032) (USD Billion)
12.4.9.2 India Semantic Knowledge Graphing Market Estimates And Forecasts, By Industry Vertical (2020-2032) (USD Billion)
12.4.9.3 India Semantic Knowledge Graphing Market Estimates And Forecasts, By Application (2020-2032) (USD Billion)
12.4.9.4 India Semantic Knowledge Graphing Market Estimates And Forecasts, By Type (2020-2032) (USD Billion)
12.4.9.5 India Semantic Knowledge Graphing Market Estimates And Forecasts, By Task Type (2020-2032) (USD Billion)
12.4.10 Japan
12.4.10.1 Japan Semantic Knowledge Graphing Market Estimates And Forecasts, By Data Source (2020-2032) (USD Billion)
12.4.10.2 Japan Semantic Knowledge Graphing Market Estimates And Forecasts, By Industry Vertical (2020-2032) (USD Billion)
12.4.10.3 Japan Semantic Knowledge Graphing Market Estimates And Forecasts, By Application (2020-2032) (USD Billion)
12.4.10.4 Japan Semantic Knowledge Graphing Market Estimates And Forecasts, By Type (2020-2032) (USD Billion)
12.4.10.5 Japan Semantic Knowledge Graphing Market Estimates And Forecasts, By Task Type (2020-2032) (USD Billion)
12.4.11 South Korea
12.4.11.1 South Korea Semantic Knowledge Graphing Market Estimates And Forecasts, By Data Source (2020-2032) (USD Billion)
12.4.11.2 South Korea Semantic Knowledge Graphing Market Estimates And Forecasts, By Industry Vertical (2020-2032) (USD Billion)
12.4.11.3 South Korea Semantic Knowledge Graphing Market Estimates And Forecasts, By Application (2020-2032) (USD Billion)
12.4.11.4 South Korea Semantic Knowledge Graphing Market Estimates And Forecasts, By Type (2020-2032) (USD Billion)
12.4.11.5 South Korea Semantic Knowledge Graphing Market Estimates And Forecasts, By Task Type (2020-2032) (USD Billion)
12.4.12 Vietnam
12.4.12.1 Vietnam Semantic Knowledge Graphing Market Estimates And Forecasts, By Data Source (2020-2032) (USD Billion)
12.4.12.2 Vietnam Semantic Knowledge Graphing Market Estimates And Forecasts, By Industry Vertical (2020-2032) (USD Billion)
12.4.12.3 Vietnam Semantic Knowledge Graphing Market Estimates And Forecasts, By Application (2020-2032) (USD Billion)
12.4.12.4 Vietnam Semantic Knowledge Graphing Market Estimates And Forecasts, By Type (2020-2032) (USD Billion)
12.4.12.5 Vietnam Semantic Knowledge Graphing Market Estimates And Forecasts, By Task Type (2020-2032) (USD Billion)
12.4.13 Singapore
12.4.13.1 Singapore Semantic Knowledge Graphing Market Estimates And Forecasts, By Data Source (2020-2032) (USD Billion)
12.4.13.2 Singapore Semantic Knowledge Graphing Market Estimates And Forecasts, By Industry Vertical (2020-2032) (USD Billion)
12.4.13.3 Singapore Semantic Knowledge Graphing Market Estimates And Forecasts, By Application (2020-2032) (USD Billion)
12.4.13.4 Singapore Semantic Knowledge Graphing Market Estimates And Forecasts, By Type (2020-2032) (USD Billion)
12.4.13.5 Singapore Semantic Knowledge Graphing Market Estimates And Forecasts, By Task Type (2020-2032) (USD Billion)
12.4.14 Australia
12.4.14.1 Australia Semantic Knowledge Graphing Market Estimates And Forecasts, By Data Source (2020-2032) (USD Billion)
12.4.14.2 Australia Semantic Knowledge Graphing Market Estimates And Forecasts, By Industry Vertical (2020-2032) (USD Billion)
12.4.14.3 Australia Semantic Knowledge Graphing Market Estimates And Forecasts, By Application (2020-2032) (USD Billion)
12.4.14.4 Australia Semantic Knowledge Graphing Market Estimates And Forecasts, By Type (2020-2032) (USD Billion)
12.4.14.5 Australia Semantic Knowledge Graphing Market Estimates And Forecasts, By Task Type (2020-2032) (USD Billion)
12.4.15 Rest Of Asia Pacific
12.4.15.1 Rest Of Asia Pacific Semantic Knowledge Graphing Market Estimates And Forecasts, By Data Source (2020-2032) (USD Billion)
12.4.15.2 Rest Of Asia Pacific Semantic Knowledge Graphing Market Estimates And Forecasts, By Industry Vertical (2020-2032) (USD Billion)
12.4.15.3 Rest Of Asia Pacific Semantic Knowledge Graphing Market Estimates And Forecasts, By Application (2020-2032) (USD Billion)
12.4.15.4 Rest Of Asia Pacific Semantic Knowledge Graphing Market Estimates And Forecasts, By Type (2020-2032) (USD Billion)
12.4.15.5 Rest Of Asia Pacific Semantic Knowledge Graphing Market Estimates And Forecasts, By Task Type (2020-2032) (USD Billion)
12.5 Middle East And Africa
12.5.1 Middle East
12.5.1.1 Trends Analysis
12.5.1.2 Middle East Semantic Knowledge Graphing Market Estimates And Forecasts, By Country (2020-2032) (USD Billion)
12.5.1.3 Middle East Semantic Knowledge Graphing Market Estimates And Forecasts, By Data Source (2020-2032) (USD Billion)
12.5.1.4 Middle East Semantic Knowledge Graphing Market Estimates And Forecasts, By Industry Vertical (2020-2032) (USD Billion)
12.5.1.5 Middle East Semantic Knowledge Graphing Market Estimates And Forecasts, By Application (2020-2032) (USD Billion)
12.5.1.6 Middle East Semantic Knowledge Graphing Market Estimates And Forecasts, By Type (2020-2032) (USD Billion)
12.5.1.7 Middle East Semantic Knowledge Graphing Market Estimates And Forecasts, By Task Type (2020-2032) (USD Billion)
12.5.1.8 UAE
12.5.1.8.1 UAE Semantic Knowledge Graphing Market Estimates And Forecasts, By Data Source (2020-2032) (USD Billion)
12.5.1.8.2 UAE Semantic Knowledge Graphing Market Estimates And Forecasts, By Industry Vertical (2020-2032) (USD Billion)
12.5.1.8.3 UAE Semantic Knowledge Graphing Market Estimates And Forecasts, By Application (2020-2032) (USD Billion)
12.5.1.8.4 UAE Semantic Knowledge Graphing Market Estimates And Forecasts, By Type (2020-2032) (USD Billion)
12.5.1.8.5 UAE Semantic Knowledge Graphing Market Estimates And Forecasts, By Task Type (2020-2032) (USD Billion)
12.5.1.9 Egypt
12.5.1.9.1 Egypt Semantic Knowledge Graphing Market Estimates And Forecasts, By Data Source (2020-2032) (USD Billion)
12.5.1.9.2 Egypt Semantic Knowledge Graphing Market Estimates And Forecasts, By Industry Vertical (2020-2032) (USD Billion)
12.5.1.9.3 Egypt Semantic Knowledge Graphing Market Estimates And Forecasts, By Application (2020-2032) (USD Billion)
12.5.1.9.4 Egypt Semantic Knowledge Graphing Market Estimates And Forecasts, By Type (2020-2032) (USD Billion)
12.5.1.9.5 Egypt Semantic Knowledge Graphing Market Estimates And Forecasts, By Task Type (2020-2032) (USD Billion)
12.5.1.10 Saudi Arabia
12.5.1.10.1 Saudi Arabia Semantic Knowledge Graphing Market Estimates And Forecasts, By Data Source (2020-2032) (USD Billion)
12.5.1.10.2 Saudi Arabia Semantic Knowledge Graphing Market Estimates And Forecasts, By Industry Vertical (2020-2032) (USD Billion)
12.5.1.10.3 Saudi Arabia Semantic Knowledge Graphing Market Estimates And Forecasts, By Application (2020-2032) (USD Billion)
12.5.1.10.4 Saudi Arabia Semantic Knowledge Graphing Market Estimates And Forecasts, By Type (2020-2032) (USD Billion)
12.5.1.10.5 Saudi Arabia Semantic Knowledge Graphing Market Estimates And Forecasts, By Task Type (2020-2032) (USD Billion)
12.5.1.11 Qatar
12.5.1.11.1 Qatar Semantic Knowledge Graphing Market Estimates And Forecasts, By Data Source (2020-2032) (USD Billion)
12.5.1.11.2 Qatar Semantic Knowledge Graphing Market Estimates And Forecasts, By Industry Vertical (2020-2032) (USD Billion)
12.5.1.11.3 Qatar Semantic Knowledge Graphing Market Estimates And Forecasts, By Application (2020-2032) (USD Billion)
12.5.1.11.4 Qatar Semantic Knowledge Graphing Market Estimates And Forecasts, By Type (2020-2032) (USD Billion)
12.5.1.11.5 Qatar Semantic Knowledge Graphing Market Estimates And Forecasts, By Task Type (2020-2032) (USD Billion)
12.5.1.12 Rest Of Middle East
12.5.1.12.1 Rest Of Middle East Semantic Knowledge Graphing Market Estimates And Forecasts, By Data Source (2020-2032) (USD Billion)
12.5.1.12.2 Rest Of Middle East Semantic Knowledge Graphing Market Estimates And Forecasts, By Industry Vertical (2020-2032) (USD Billion)
12.5.1.12.3 Rest Of Middle East Semantic Knowledge Graphing Market Estimates And Forecasts, By Application (2020-2032) (USD Billion)
12.5.1.12.4 Rest Of Middle East Semantic Knowledge Graphing Market Estimates And Forecasts, By Type (2020-2032) (USD Billion)
12.5.1.12.5 Rest Of Middle East Semantic Knowledge Graphing Market Estimates And Forecasts, By Task Type (2020-2032) (USD Billion)
12.5.2 Africa
12.5.2.1 Trends Analysis
12.5.2.2 Africa Semantic Knowledge Graphing Market Estimates And Forecasts, By Country (2020-2032) (USD Billion)
12.5.2.3 Africa Semantic Knowledge Graphing Market Estimates And Forecasts, By Data Source (2020-2032) (USD Billion)
12.5.2.4 Africa Semantic Knowledge Graphing Market Estimates And Forecasts, By Industry Vertical (2020-2032) (USD Billion)
12.5.2.5 Africa Semantic Knowledge Graphing Market Estimates And Forecasts, By Application (2020-2032) (USD Billion)
12.5.2.6 Africa Semantic Knowledge Graphing Market Estimates And Forecasts, By Type (2020-2032) (USD Billion)
12.5.2.7 Africa Semantic Knowledge Graphing Market Estimates And Forecasts, By Task Type (2020-2032) (USD Billion)
12.5.2.8 South Africa
12.5.2.8.1 South Africa Semantic Knowledge Graphing Market Estimates And Forecasts, By Data Source (2020-2032) (USD Billion)
12.5.2.8.2 South Africa Semantic Knowledge Graphing Market Estimates And Forecasts, By Industry Vertical (2020-2032) (USD Billion)
12.5.2.8.3 South Africa Semantic Knowledge Graphing Market Estimates And Forecasts, By Application (2020-2032) (USD Billion)
12.5.2.8.4 South Africa Semantic Knowledge Graphing Market Estimates And Forecasts, By Type (2020-2032) (USD Billion)
12.5.2.8.5 South Africa Semantic Knowledge Graphing Market Estimates And Forecasts, By Task Type (2020-2032) (USD Billion)
12.5.2.9 Nigeria
12.5.2.9.1 Nigeria Semantic Knowledge Graphing Market Estimates And Forecasts, By Data Source (2020-2032) (USD Billion)
12.5.2.9.2 Nigeria Semantic Knowledge Graphing Market Estimates And Forecasts, By Industry Vertical (2020-2032) (USD Billion)
12.5.2.9.3 Nigeria Semantic Knowledge Graphing Market Estimates And Forecasts, By Application (2020-2032) (USD Billion)
12.5.2.9.4 Nigeria Semantic Knowledge Graphing Market Estimates And Forecasts, By Type (2020-2032) (USD Billion)
12.5.2.9.5 Nigeria Semantic Knowledge Graphing Market Estimates And Forecasts, By Task Type (2020-2032) (USD Billion)
12.5.2.10 Rest Of Africa
12.5.2.10.1 Rest Of Africa Semantic Knowledge Graphing Market Estimates And Forecasts, By Data Source (2020-2032) (USD Billion)
12.5.2.10.2 Rest Of Africa Semantic Knowledge Graphing Market Estimates And Forecasts, By Industry Vertical (2020-2032) (USD Billion)
12.5.2.10.3 Rest Of Africa Semantic Knowledge Graphing Market Estimates And Forecasts, By Application (2020-2032) (USD Billion)
12.5.2.10.4 Rest Of Africa Semantic Knowledge Graphing Market Estimates And Forecasts, By Type (2020-2032) (USD Billion)
12.5.2.10.5 Rest Of Africa Semantic Knowledge Graphing Market Estimates And Forecasts, By Task Type (2020-2032) (USD Billion)
12.6 Latin America
12.6.1 Trends Analysis
12.6.2 Latin America Semantic Knowledge Graphing Market Estimates And Forecasts, By Country (2020-2032) (USD Billion)
12.6.3 Latin America Semantic Knowledge Graphing Market Estimates And Forecasts, By Data Source (2020-2032) (USD Billion)
12.6.4 Latin America Semantic Knowledge Graphing Market Estimates And Forecasts, By Industry Vertical (2020-2032) (USD Billion)
12.6.5 Latin America Semantic Knowledge Graphing Market Estimates And Forecasts, By Application (2020-2032) (USD Billion)
12.6.6 Latin America Semantic Knowledge Graphing Market Estimates And Forecasts, By Type (2020-2032) (USD Billion)
12.6.7 Latin America Semantic Knowledge Graphing Market Estimates And Forecasts, By Task Type (2020-2032) (USD Billion)
12.6.8 Brazil
12.6.8.1 Brazil Semantic Knowledge Graphing Market Estimates And Forecasts, By Data Source (2020-2032) (USD Billion)
12.6.8.2 Brazil Semantic Knowledge Graphing Market Estimates And Forecasts, By Industry Vertical (2020-2032) (USD Billion)
12.6.8.3 Brazil Semantic Knowledge Graphing Market Estimates And Forecasts, By Application (2020-2032) (USD Billion)
12.6.8.4 Brazil Semantic Knowledge Graphing Market Estimates And Forecasts, By Type (2020-2032) (USD Billion)
12.6.8.5 Brazil Semantic Knowledge Graphing Market Estimates And Forecasts, By Task Type (2020-2032) (USD Billion)
12.6.9 Argentina
12.6.9.1 Argentina Semantic Knowledge Graphing Market Estimates And Forecasts, By Data Source (2020-2032) (USD Billion)
12.6.9.2 Argentina Semantic Knowledge Graphing Market Estimates And Forecasts, By Industry Vertical (2020-2032) (USD Billion)
12.6.9.3 Argentina Semantic Knowledge Graphing Market Estimates And Forecasts, By Application (2020-2032) (USD Billion)
12.6.9.4 Argentina Semantic Knowledge Graphing Market Estimates And Forecasts, By Type (2020-2032) (USD Billion)
12.6.9.5 Argentina Semantic Knowledge Graphing Market Estimates And Forecasts, By Task Type (2020-2032) (USD Billion)
12.6.10 Colombia
12.6.10.1 Colombia Semantic Knowledge Graphing Market Estimates And Forecasts, By Data Source (2020-2032) (USD Billion)
12.6.10.2 Colombia Semantic Knowledge Graphing Market Estimates And Forecasts, By Industry Vertical (2020-2032) (USD Billion)
12.6.10.3 Colombia Semantic Knowledge Graphing Market Estimates And Forecasts, By Application (2020-2032) (USD Billion)
12.6.10.4 Colombia Semantic Knowledge Graphing Market Estimates And Forecasts, By Type (2020-2032) (USD Billion)
12.6.10.5 Colombia Semantic Knowledge Graphing Market Estimates And Forecasts, By Task Type (2020-2032) (USD Billion)
12.6.11 Rest Of Latin America
12.6.11.1 Rest Of Latin America Semantic Knowledge Graphing Market Estimates And Forecasts, By Data Source (2020-2032) (USD Billion)
12.6.11.2 Rest Of Latin America Semantic Knowledge Graphing Market Estimates And Forecasts, By Industry Vertical (2020-2032) (USD Billion)
12.6.11.3 Rest Of Latin America Semantic Knowledge Graphing Market Estimates And Forecasts, By Application (2020-2032) (USD Billion)
12.6.11.4 Rest Of Latin America Semantic Knowledge Graphing Market Estimates And Forecasts, By Type (2020-2032) (USD Billion)
12.6.11.5 Rest Of Latin America Semantic Knowledge Graphing Market Estimates And Forecasts, By Task Type (2020-2032) (USD Billion)
13. Company Profiles
13.1 Amazon.com Inc.
13.1.1 Company Overview
13.1.2 Financial
13.1.3 Products/ Semi-structured Offered
13.1.4 SWOT Analysis
13.2 Baidu, Inc.
13.2.1 Company Overview
13.2.2 Financial
13.2.3 Products/ Semi-structured Offered
13.2.4 SWOT Analysis
13.3 Facebook Inc.
13.3.1 Company Overview
13.3.2 Financial
13.3.3 Products/ Semi-structured Offered
13.3.4 SWOT Analysis
13.4 Google LLC
13.4.1 Company Overview
13.4.2 Financial
13.4.3 Products/ Semi-structured Offered
13.4.4 SWOT Analysis
13.5 Microsoft Corporation
13.5.1 Company Overview
13.5.2 Financial
13.5.3 Products/ Semi-structured Offered
13.5.4 SWOT Analysis
13.6 Mitsubishi Electric Corporation
13.6.1 Company Overview
13.6.2 Financial
13.6.3 Products/ Semi-structured Offered
13.6.4 SWOT Analysis
13.7 NELL
13.7.1 Company Overview
13.7.2 Financial
13.7.3 Products/ Semi-structured Offered
13.7.4 SWOT Analysis
13.8 Semantic Web Company
13.8.1 Company Overview
13.8.2 Financial
13.8.3 Products/ Semi-structured Offered
13.8.4 SWOT Analysis
13.9 YAGO
13.9.1 Company Overview
13.9.2 Financial
13.9.3 Products/ Semi-structured Offered
13.9.4 SWOT Analysis
13.10 Yandex
13.10.1 Company Overview
13.10.2 Financial
13.10.3 Products/ Semi-structured Offered
13.10.4 SWOT Analysis
14. Use Cases and Best Practices
15. Conclusion
An accurate research report requires proper strategizing as well as implementation. There are multiple factors involved in the completion of good and accurate research report and selecting the best methodology to compete the research is the toughest part. Since the research reports we provide play a crucial role in any company’s decision-making process, therefore we at SNS Insider always believe that we should choose the best method which gives us results closer to reality. This allows us to reach at a stage wherein we can provide our clients best and accurate investment to output ratio.
Each report that we prepare takes a timeframe of 350-400 business hours for production. Starting from the selection of titles through a couple of in-depth brain storming session to the final QC process before uploading our titles on our website we dedicate around 350 working hours. The titles are selected based on their current market cap and the foreseen CAGR and growth.
The 5 steps process:
Step 1: Secondary Research:
Secondary Research or Desk Research is as the name suggests is a research process wherein, we collect data through the readily available information. In this process we use various paid and unpaid databases which our team has access to and gather data through the same. This includes examining of listed companies’ annual reports, Journals, SEC filling etc. Apart from this our team has access to various associations across the globe across different industries. Lastly, we have exchange relationships with various university as well as individual libraries.
Step 2: Primary Research
When we talk about primary research, it is a type of study in which the researchers collect relevant data samples directly, rather than relying on previously collected data. This type of research is focused on gaining content specific facts that can be sued to solve specific problems. Since the collected data is fresh and first hand therefore it makes the study more accurate and genuine.
We at SNS Insider have divided Primary Research into 2 parts.
Part 1 wherein we interview the KOLs of major players as well as the upcoming ones across various geographic regions. This allows us to have their view over the market scenario and acts as an important tool to come closer to the accurate market numbers. As many as 45 paid and unpaid primary interviews are taken from both the demand and supply side of the industry to make sure we land at an accurate judgement and analysis of the market.
This step involves the triangulation of data wherein our team analyses the interview transcripts, online survey responses and observation of on filed participants. The below mentioned chart should give a better understanding of the part 1 of the primary interview.
Part 2: In this part of primary research the data collected via secondary research and the part 1 of the primary research is validated with the interviews from individual consultants and subject matter experts.
Consultants are those set of people who have at least 12 years of experience and expertise within the industry whereas Subject Matter Experts are those with at least 15 years of experience behind their back within the same space. The data with the help of two main processes i.e., FGDs (Focused Group Discussions) and IDs (Individual Discussions). This gives us a 3rd party nonbiased primary view of the market scenario making it a more dependable one while collation of the data pointers.
Step 3: Data Bank Validation
Once all the information is collected via primary and secondary sources, we run that information for data validation. At our intelligence centre our research heads track a lot of information related to the market which includes the quarterly reports, the daily stock prices, and other relevant information. Our data bank server gets updated every fortnight and that is how the information which we collected using our primary and secondary information is revalidated in real time.
Step 4: QA/QC Process
After all the data collection and validation our team does a final level of quality check and quality assurance to get rid of any unwanted or undesired mistakes. This might include but not limited to getting rid of the any typos, duplication of numbers or missing of any important information. The people involved in this process include technical content writers, research heads and graphics people. Once this process is completed the title gets uploader on our platform for our clients to read it.
Step 5: Final QC/QA Process:
This is the last process and comes when the client has ordered the study. In this process a final QA/QC is done before the study is emailed to the client. Since we believe in giving our clients a good experience of our research studies, therefore, to make sure that we do not lack at our end in any way humanly possible we do a final round of quality check and then dispatch the study to the client.
Key Segments:
By Data Source
Structured
Unstructured
Semi-structured
By Type
Context-rich Knowledge Graphs
External-sensing Knowledge Graphs
NLP Knowledge Graphs
By Task Type
Link Prediction
Entity Resolution
Link-based Clustering
By Application
Semantic Search
QnA Machines
Information Retrieval
Electronic Reading
Others
By Industry Vertical
BFSI
Healthcare
IT & Telecom
Retail & E-commerce
Government
Others
Request for Segment Customization as per your Business Requirement: Segment Customization Request
Regional Coverage:
North America
US
Canada
Mexico
Europe
Eastern Europe
Poland
Romania
Hungary
Turkey
Rest of Eastern Europe
Western Europe
Germany
France
UK
Italy
Spain
Netherlands
Switzerland
Austria
Rest of Western Europe
Asia Pacific
China
India
Japan
South Korea
Vietnam
Singapore
Australia
Rest of Asia Pacific
Middle East & Africa
Middle East
UAE
Egypt
Saudi Arabia
Qatar
Rest of Middle East
Africa
Nigeria
South Africa
Rest of Africa
Latin America
Brazil
Argentina
Colombia
Rest of Latin America
Request for Country Level Research Report: Country Level Customization Request
Available Customization
With the given market data, SNS Insider offers customization as per the company’s specific needs. The following customization options are available for the report:
Detailed Volume Analysis
Criss-Cross segment analysis (e.g. Product X Application)
Competitive Product Benchmarking
Geographic Analysis
Additional countries in any of the regions
Customized Data Representation
Detailed analysis and profiling of additional market players
Accounts Receivable Automation Market was valued at USD 3.5 billion in 2023 and is expected to reach USD 10.5 billion by 2032 and grow at a CAGR of 13.1% from 2024- 2032.
The Data-Centric Security Market size was valued at USD 5.27 billion in 2023 and is expected to reach USD 36.64 Billion by 2032, growing at a CAGR of 24.06% over the forecast period of 2024-2032.
The Private Cloud Services Market size was valued at USD 6.1 Billion in 2023 and will reach USD 31 Billion by 2032 and grow at a CAGR of 19.8% by 2024-2032.
The Alternative Data Market Size was valued at USD 6.61 Billion in 2023 and will reach USD 398.15 Billion by 2032 and grow at a CAGR of 57.7% by 2032.
Intelligent Roadways Transportation System Market valued at USD 22.4 Bn in 2023, is expected to grow at a CAGR of 7.93% over 2024-2032 to reach USD 44.4 Bn.
The Smart Port Market Size was valued at USD 2.88 Billion in 2023 and is expected to reach USD 19.63 Billion by 2032 and growing at a CAGR of 23.82% over the forecast period 2024-2032.
Hi! Click one of our member below to chat on Phone