Get more information on Self-Healing Materials Market - Request Free Sample Report
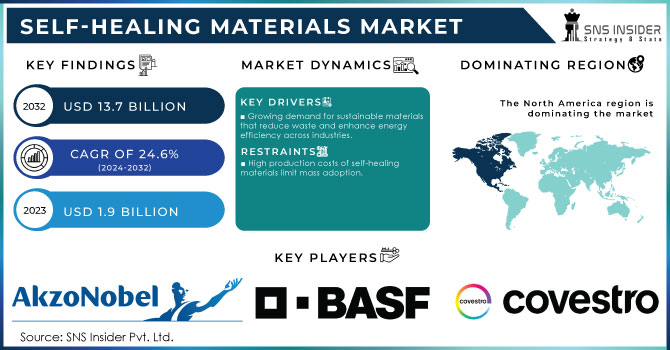
The Self-Healing Materials Market Size was valued at USD 1.9 billion in 2023, and is expected to reach USD 13.7 Billion by 2032, and grow at a CAGR of 24.6% over the forecast period 2024-2032.
The market for self-healing materials is witnessing tremendous growth since they possess remarkable strength, efficiency, and lifetime material in their mass segments such as cars, electronics, construction, and biomedical applications. Self-healing materials are developed to mend themselves automatically after injury. The recent technological advancements made in self-healing materials are improving the performance of the material thus more products are used in large quantities. One of the driving forces in the market shortly is sustainability and reduced impact on the environment, which has raised the stakes for companies to work on developing materials that would not only avoid the generation of waste but also be more energy efficient. It is especially in the electronics sector that this need is increasing due to a demand for materials that can withstand repetitive usage without degrading. Another driver is biomimicry as material development is based on mimicking nature's processes. Researchers at Binghamton University now, in May 2024, explored how fire ant's ability to self-assemble can inspire the development of adjustable self-healing materials under changing external pressures. Critical inspections of natural inspirations would therefore push research to new sources for more versatile and efficient mechanisms, especially those materials under extreme temperatures or high mechanical stress. Another sector that fuels the growth of the market is the potential of these materials to be used for wearables, sensors, and other flexible devices. Companies are investing in further research for attempts to replicate these natural processes in synthetic materials.
Additional technological advancements continue pushing forward with the growth of the self-healing materials market. A new device was developed in April 2024 which contained a molecular device that may revolutionize drug delivery systems. This application demonstrated the potential application of self-healing materials at the molecular level. This is particularly attractive for application in the healthcare sector. This type of dynamic material is such that the controlled drug release will have more direct control over a faster response from the patient therefore reducing the harmful effects of treatment. This has been a huge milestone in the biomedical field in terms of self-healing materials being considered part of a solution for improving the delivery of better patient care through advanced medical devices and systems. For example, in April 2024, scientists created a self-healing material that can be used for drug delivery systems, for example. This technology, demonstrated the capability to heal at a molecular scale, opening new and exciting possibilities in medicine in terms of more efficiently managing drugs and medical implants. Such smart materials implanted in the medical field shall have an enormous impression, especially in those areas where traditional materials used here did not satisfy longevity and biocompatibility. Moreover, this innovation presented here regarding self-healing materials propels their diversification for specific applications and therefore increases their market potential across various industries.
Furthermore, hydrogel research is just one of these examples that also demonstrates the potential of such a market. For example, in June 2023, hydrogels for flexible sensors with the dual advantages of flexibility and durability were developed. This innovation finds great interest for industries concerned with robotics, soft electronics, and biomedical devices. Hydrogels with a self-healing ability to fix themselves autonomously are critical in the design of systems that will be more reliable and much longer-lasting. With the growing application of such materials in high-elasticity sectors, like wearable electronics, it further underlines that the importance of self-healing materials would grow even more. Moreover, with increasing value propositions witnessed by self-healing materials companies presenting opportunities to increase product lifetime and lower maintenance costs, investments in this space are expected to grow, propelling market expansion.
Market Dynamics:
Drivers:
Growing demand for sustainable materials that reduce waste and enhance energy efficiency across industries.
The demand for sustainable materials that offer the maximum efficiency of energy while minimizing waste is a huge driver in the self-healing materials market. Automotive, electronic, and construction industries want to work on developing materials that improve the extended lifetime of the products while reducing their environmental footprint as well. By their intrinsic characteristics, self-healing materials thus bring answers to these disadvantages because they can, in an autonomous way, heal themselves by solving problems of wear and tear. This diminishes the tendency of being frequently replaced or maintained with accompanying diminished usage of resources and waste. For example, in the automotive field, self-healing coatings are thus developed to protect vehicles against wear and tear resulting in less frequent repainting or replacement of parts. Another similar material emerging in construction is self-healing concrete, which has enormous potential just for infrastructure. With an ability to automatically heal cracks, this can elongate the lifetime of buildings and bridges and thereby minimize repair needs. This saves raw materials and reduces energy consumption associated with manufacturing and transportation of replacement materials. In electronics, self-healing polymers are integrated into devices that could add more toughness to equipment, especially when parts are subjected to repeated mechanical stress, such as flexible displays and wearable electronics. It increases energy efficiency while following the current sustainable trend in modern manufacturing processes because it could reduce the frequent replacement of broken parts. Pressure from regulation and growing demand from the consumer to have more environmentally friendly products is pushing companies toward driving innovation toward adopting self-healing materials that are aligned with such sustainability objectives.
Increasing adoption of self-healing technologies in electronics, automotive, and medical applications for improved product durability and longevity.
The self-healing technologies in electronics, automotive, and medical applications are showing significant growth in the self-healing material market due to their potential to enhance the product's durability and increase its lifespan. In electronics, self-healing polymers are now being included in foldable phones and wearable gadgets wherein the components have to undergo repeated mechanical stress. These materials can self-heal minor damage, such as cracks or fractures, so that lifespan is extended and maintenance or replacement costs minimized. In the automotive area, self-healing materials are already incorporated into the coating and into panels of bodies of cars to be able to recover them against damage or scratches without human intervention, which apart from improving their appearance reduces long-term maintenance needs. This is particularly useful in high-performance or luxury vehicles, where a perfect appearance is crucial. In medicine, self-healing hydrogels and polymers are increasingly applied for use in wound healing care, implants, and drug delivery devices. Such materials can heal themselves within the body, increasing the time between replacements and effective function without requiring invasive procedures for replacement or repair. A self-healing hydrogel can be designed for soft robotics and implants, wherein healing in situ may be conducive to superior patient outcomes and reduce complications. For these applications, the adoption of self-healing materials increases the product lifespan, reduces downtime, and improves overall reliability, thus constituting a really useful concept in current manufacturing and technological development.
Restraint:
High production costs of self-healing materials limit mass adoption.
The significant production cost of self-healing materials is a strong barrier to mass applications in many industries. Advanced manufacturing processes may be required for such materials, say, complex polymers or nanomaterials integration, which are challenging to produce at very large scales. Thus, sophisticated technologies raise the cost of developing self-healing coatings and polymers on their own for automotive and electronics applications, cutting into their potential mass-market reach. This cost barrier places their use primarily in high-end or application-specific situations where durability and long lifetime would be justified investments, such as luxury cars or complex medical devices. In addition, the need for continued research and development to further improve the efficiency and scalability of these materials increases the cost and delays entry into consumer products where price efficiency plays a big role.
Opportunity:
Rising use of biomimicry in material innovation offers new possibilities for advanced self-healing solutions.
Biomimicry in material innovation majorly presents a great opportunity for advancing the self-healing solution because, instead of relying on natural processes found in organisms, such as self-healing plants or animals, researchers have been able to develop more efficient and responsive self-healing materials. This can be quite straightforwardly demonstrated by the work of scientists in making polymers that can autonomously repair themselves after experiencing some form of damage, mimicking a certain type of organism, such as lizards and starfish, in their regenerative capabilities. Bio-inspired materials may find promising applications in industries ranging from the self-repairing coatings of construction to advanced medical implants capable of healing inside the body. It then allows new paths for further creating material systems that are more sustainable and resilient, therefore with better performance in harsh or high-stress environments, in line with the increasing quest for innovation in sustainable long-lasting products.
Challenge:
Integrating self-healing capabilities into complex systems while maintaining material performance remains technologically demanding.
Integrating self-healing capabilities into complex systems without affecting the performance of the material is a major challenge in the self-healing material market. Technologically, it is very difficult to have self-repair with reliable consistency without compromising the mechanical, thermal, or electrical properties of the material. For example, incorporating self-healing capabilities in electronic circuits or batteries requires maintenance of conductivity and stability along with autonomous repair after damage. Matters get worse when one considers that materials applied in aerospace or automotive applications have to endure extreme conditions and that the guaranteeing of the retention of strength and durability while self-repair is performed adds to this complexity. The advanced engineering and material science innovations involved may contribute to a delay in their widespread application across highly demanding sectors.
By Product
Concrete dominated the Self-Healing Materials Market in 2023, and it accounted for around 35% of the market. The reason behind such dominance is the huge usage of concrete during construction and infrastructure work, as self-healing properties increase the durability of the said structures and lower maintenance costs. For instance, self-healing concrete can fill cracks without requiring more interventions; because healing agents can be embedded within a matrix, like bacteria or capsules made up of healing compounds that react with moisture and carbon dioxide to form calcium carbonate and thus fill the cracks. The technology is increasingly being used in bigger projects like bridges and highways, showing their practical and economic benefits.
By Form
The Intrinsic segment dominated the Self-Healing Materials Market in 2023, with an estimated market share of nearly 60%. Intrinsic self-healing materials are created with healing mechanisms embedded within their structure. Such intrinsic systems may repair damage automatically without the need for external intervention. Such a method is especially preferred due to its efficiency and reliability. For example, intrinsically self-healing polymers often come integrated with microcapsules or vascular networks that are designed to release healing agents when the material fails, thereby restoring functionality. The area in which the provided technology has a role as a key enabling technology is high-performance coatings and advanced composites, where the preservation of integrity within the material is critical to its safe and effective use.
By Technology
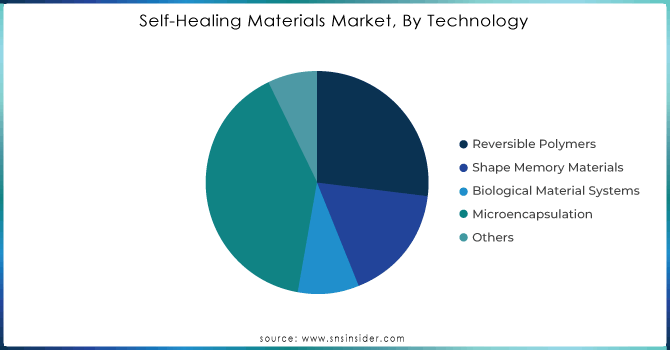
In 2023, the Microencapsulation segment had a commanding position in the Self-Healing Materials Market, accounting for an estimated market share of about 40%. Microencapsulation involves the encapsulation of healing agents in minute capsules within the material matrix, which is released into its contents after the material sustains damage. The effectiveness and flexibility offered by this technology make it very applicable. For instance, the healing agents encapsulated in microsized form can be autonomically used for repairing cracks in concretes and coatings by releasing a healing agent that reacts with moisture or air to regenerate the structural integrity of the material. This method has been valued highly in industries where material longevity and maintenance are critical, such as in the construction and automotive sectors.
Need any Customization Research on Self-Healing Materials Market - Enquiry Now
By Application
The Building & Construction segment dominated the self-healing materials market in 2023. It accounted for an estimated market share of around 45%. Such vast usage is sought primarily because the products are made up of self-healing material, and the use of such products is a matter of immense concern in infrastructure projects. That concern is mostly about the durability and the maintenance of the product. As an example, self-healing concrete and coatings are used in ever-growing amounts on roads, bridges, and buildings to autonomously mend cracks and to ensure a longer life cycle compared with traditional ones, while avoiding costly repairs and maintenance. This application is especially beneficial in increasing the lifespan of structures exposed to hostile environmental conditions as well as heavy traffic.
Regional Analysis
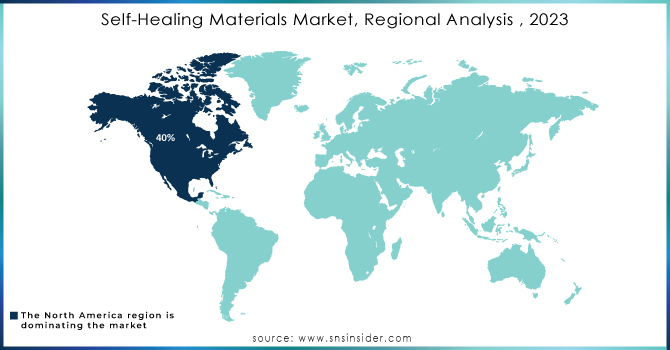
In 2023, North America dominated the Self-Healing Materials Market, accounting for about 40%. It houses some of the world's most advanced infrastructures, considerable R&D investments, and early adoption of new technologies. For instance, self-healing concrete and coatings are utilized massively today in the critical infrastructures of the United States, including highways and bridges, to enhance durability and lower the cost of maintenance. Additionally, North America has a high count of leaders within its major corporations and research organizations, which gives an added advantage to the high-scale implementation and research of self-healing materials in this region.
Moreover, the Asia-Pacific emerged as the fastest-growing region in 2023 for Self-Healing Materials, with an estimated CAGR of approximately 12% over the period. This is due to fast growth in the construction industry, increased infrastructure investment, and growing demand for advanced materials in countries like China and India. For instance, self-healing technologies that prolong life and lower maintenance prices are being incorporated into some of the major infrastructure initiatives in smart buildings and transportation networks. Thus, the robust industrial base in this region and the growing concerns about innovation and sustainability will continue to drive dynamic growth in the market for self-healing materials.
Akzo Nobel N.V. (Interpon D Series, Dulux Weathershield)
Arkema SA (Pebax, Rilsan)
Autonomic Materials, Inc. (Autonomic Healing Agent, Self-Healing Coatings)
BASF SE (Microsphere Technology, MasterBond)
Covestro AG (Baybond, Desmodur)
Critical Materials S.A. (Critical Polymer Systems, HealTech)
Dow Chemical Company (Dow Corning, DOWSIL)
DuPont (Tyvek, Kevlar)
Evonik Industries Corporation (VESTAMID, TEGOMER)
High Impact Technology, LLC (HIT Self-Healing Polymers, HIT-Chemicals)
Huntsman International LLC (Araldite, Vantico)
MacDermid Autotype Ltd. (Autotype Self-Healing Films, MacDermid Self-Healing Coatings)
Michelin Group (Michelin Self-Healing Tires, Michelin Self-Healing Rubber)
NEI Corporation (Self-Healing Coatings, NEI’s Nanotechnology Solutions)
Sensor Coating Systems Ltd. (Sensor Coatings, Self-Healing Sensors)
Solvay S.A. (Solef, Ryton)
The Goodyear Tire & Rubber Company (Goodyear Assurance, Goodyear Eagle)
Toray Industries, Inc. (Torayca, Toray’s Self-Healing Polymers)
Toyota Motor Corporation (Toyota Self-Healing Paint, Toyota Nano-Technology Coatings)
Volkswagen AG (Volkswagen Self-Healing Paint, VW Nano-Coatings)
Recent Developments
September 2024: Scientists discovered that nanoscale silver is inherently self-healing. A new research study demonstrated that the nanoscale silver particles can heal scratches and other damage automatically. This technology is promising to be applied in paints, coatings, and electronics.
July 2024: Researchers at UCF have been involved as members of a team whose discovery led to the creation of self-healing glass. Among its latest discoveries, researchers engineered a glass product capable of repairing scratches and minor damage without human intervention for a longer life span of such products in electronics and construction applications.
December 2023: Drexel University scientists have engineered bacteria-based self-healing concrete. Motivated by this new research, the introduction of this bacteria to the concrete mix can be activated under moist conditions, effectively healing cracks, which would enhance the strength and extended lifespan of the structure.
Report Attributes | Details |
---|---|
Market Size in 2023 | US$ 1.9 Billion |
Market Size by 2032 | US$ 13.7 Billion |
CAGR | CAGR of 24.6% From 2024 to 2032 |
Base Year | 2023 |
Forecast Period | 2024-2032 |
Historical Data | 2020-2022 |
Report Scope & Coverage | Market Size, Segments Analysis, Competitive Landscape, Regional Analysis, DROC & SWOT Analysis, Forecast Outlook |
Key Segments | •By Product (Concrete, Polymers, Asphalt, Coatings, Fiber-reinforced Composites, Ceramic, Metals) •By Form (Intrinsic, Extrinsic) •By Technology (Reversible Polymers, Shape Memory Materials, Biological Material Systems, Microencapsulation, Others) •By Application (Energy Generation, Building & Construction, Automotive & Transportation, Electronics & Semiconductors, Medical (Implants & devices), Others) |
Regional Analysis/Coverage | North America (US, Canada, Mexico), Europe (Eastern Europe [Poland, Romania, Hungary, Turkey, Rest of Eastern Europe] Western Europe] Germany, France, UK, Italy, Spain, Netherlands, Switzerland, Austria, Rest of Western Europe]), Asia Pacific (China, India, Japan, South Korea, Vietnam, Singapore, Australia, Rest of Asia Pacific), Middle East & Africa (Middle East [UAE, Egypt, Saudi Arabia, Qatar, Rest of Middle East], Africa [Nigeria, South Africa, Rest of Africa], Latin America (Brazil, Argentina, Colombia, Rest of Latin America) |
Company Profiles | Covestro AG, High Impact Technology, LLC., The Dow Chemical Company, Michelin Group, BASF SE, MacDermid Autotype Ltd., DuPont, Akzo Nobel N.V., Evonik Industries Corporation, Huntsman International LLC., Arkema SA and other key players |
Key Drivers | • Growing demand for sustainable materials that reduce waste and enhance energy efficiency across industries • Increasing adoption of self-healing technologies in electronics, automotive, and medical applications for improved product durability and longevity |
RESTRAINTS | • High production costs of self-healing materials limit mass adoption |
Ans: The Self-Healing Materials Market was valued at USD 1.9 billion in 2023.
Ans: The expected CAGR of the global Self-Healing Materials Market during the forecast period is 24.6%.
Ans: Increasing adoption of self-healing technologies in electronics, automotive, and medical applications for improved product durability and longevity drives the growth of the Self-Healing Materials Market.
Ans: The high production costs of self-healing materials limit mass adoption hamper the growth of the Self-Healing Materials Market.
Ans: The China led the Self-Healing Materials Market in Asia Pacific region with highest revenue share in 2023.
1. Introduction
1.1 Market Definition
1.2 Scope (Inclusion and Exclusions)
1.3 Research Assumptions
2. Executive Summary
2.1 Market Overview
2.2 Regional Synopsis
2.3 Competitive Summary
3. Research Methodology
3.1 Top-Down Approach
3.2 Bottom-up Approach
3.3. Data Validation
3.4 Primary Interviews
4. Market Dynamics Impact Analysis
4.1 Market Driving Factors Analysis
4.1.1 Drivers
4.1.2 Restraints
4.1.3 Opportunities
4.1.4 Challenges
4.2 PESTLE Analysis
4.3 Porter’s Five Forces Model
5. Statistical Insights and Trends Reporting
5.1 Production Capacity and Utilization, by Country, by Region, 2023
5.2 Feedstock Prices, by Country, by Region, 2023
5.3 Regulatory Impact, by Country, by Region, 2023
5.4 Environmental Metrics: Emissions Data, Waste Management Practices, and Sustainability Initiatives, by Region
5.5 Innovation and R&D, by Region, 2023
6. Competitive Landscape
6.1 List of Major Companies, By Region
6.2 Market Share Analysis, By Region
6.3 Product Benchmarking
6.3.1 Product specifications and features
6.3.2 Pricing
6.4 Strategic Initiatives
6.4.1 Marketing and promotional activities
6.4.2 Distribution and supply chain strategies
6.4.3 Expansion plans and new product launches
6.4.4 Strategic partnerships and collaborations
6.5 Technological Advancements
6.6 Market Positioning and Branding
7. Self-Healing Applications Market Segmentation, by Product
7.1 Chapter Overview
7.2 Concrete
7.2.1 Concrete Market Trends Analysis (2020-2032)
7.2.2 Concrete Market Size Estimates and Forecasts to 2032 (USD Million)
7.3 Polymers
7.3.1 Polymers Market Trends Analysis (2020-2032)
7.3.2 Polymers Market Size Estimates and Forecasts to 2032 (USD Million)
7.4 Asphalt
7.4.1 Asphalt Market Trends Analysis (2020-2032)
7.4.2 Asphalt Market Size Estimates and Forecasts to 2032 (USD Million)
7.5 Coatings
7.5.1 Coatings Market Trends Analysis (2020-2032)
7.5.2 Coatings Market Size Estimates and Forecasts to 2032 (USD Million)
7.6 Fiber-reinforced Composites
7.6.1 Fiber-reinforced Composites Market Trends Analysis (2020-2032)
7.6.2 Fiber-reinforced Composites Market Size Estimates and Forecasts to 2032 (USD Million)
7.7 Ceramic
7.7.1 Ceramic Market Trends Analysis (2020-2032)
7.7.2 Ceramic Market Size Estimates and Forecasts to 2032 (USD Million)
7.8 Metals
7.8.1 Metals Market Trends Analysis (2020-2032)
7.8.2 Metals Market Size Estimates and Forecasts to 2032 (USD Million)
8. Self-Healing Applications Market Segmentation, by Form
8.1 Chapter Overview
8.2 Intrinsic
8.2.1 Intrinsic Market Trends Analysis (2020-2032)
8.2.2 Intrinsic Market Size Estimates and Forecasts to 2032 (USD Million)
8.3 Extrinsic
8.3.1 Extrinsic Market Trends Analysis (2020-2032)
8.3.2 Extrinsic Market Size Estimates and Forecasts to 2032 (USD Million)
9. Self-Healing Applications Market Segmentation, by Technology
9.1 Chapter Overview
9.2 Reversible Polymers
9.2.1 Reversible Polymers Market Trends Analysis (2020-2032)
9.2.2 Reversible Polymers Market Size Estimates and Forecasts to 2032 (USD Million)
9.3 Shape Memory Applications
9.3.1 Shape Memory Applications Market Trends Analysis (2020-2032)
9.3.2 Shape Memory Applications Market Size Estimates and Forecasts to 2032 (USD Million)
9.4 Biological Application Systems
9.4.1 Biological Application Systems Market Trends Analysis (2020-2032)
9.4.2 Biological Application Systems Market Size Estimates and Forecasts to 2032 (USD Million)
9.5 Microencapsulation
9.5.1 Microencapsulation Market Trends Analysis (2020-2032)
9.5.2 Microencapsulation Market Size Estimates and Forecasts to 2032 (USD Million)
9.6 Others
9.6.1 Others Market Trends Analysis (2020-2032)
9.6.2 Others Market Size Estimates and Forecasts to 2032 (USD Million)
10. Self-Healing Applications Market Segmentation, by Application
10.1 Chapter Overview
10.2 Energy Generation
10.2.1 Energy Generation Market Trends Analysis (2020-2032)
10.2.2 Energy Generation Market Size Estimates and Forecasts to 2032 (USD Million)
10.3 Building & Construction
10.3.1 Building & Construction Market Trends Analysis (2020-2032)
10.3.2 Building & Construction Market Size Estimates and Forecasts to 2032 (USD Million)
10.4 Automotive & Transportation
10.4.1 Automotive & Transportation Market Trends Analysis (2020-2032)
10.4.2 Automotive & Transportation Market Size Estimates and Forecasts to 2032 (USD Million)
10.5 Electronics & Semiconductors
10.5.1 Electronics & Semiconductors Market Trends Analysis (2020-2032)
10.5.2 Electronics & Semiconductors Market Size Estimates and Forecasts to 2032 (USD Million)
10.6 Medical (Implants & devices)
10.6.1 Medical (Implants & devices) Market Trends Analysis (2020-2032)
10.6.2 Medical (Implants & devices) Market Size Estimates and Forecasts to 2032 (USD Million)
10.7 Others
10.7.1 Others Market Trends Analysis (2020-2032)
10.7.2 Others Market Size Estimates and Forecasts to 2032 (USD Million)
11. Regional Analysis
11.1 Chapter Overview
11.2 North America
11.2.1 Trends Analysis
11.2.2 North America Self-Healing Applications Market Estimates and Forecasts, by Country (2020-2032) (USD Million)
11.2.3 North America Self-Healing Applications Market Estimates and Forecasts, by Product (2020-2032) (USD Million)
11.2.4 North America Self-Healing Applications Market Estimates and Forecasts, by Form (2020-2032) (USD Million)
11.2.5 North America Self-Healing Applications Market Estimates and Forecasts, by Technology (2020-2032) (USD Million)
11.2.6 North America Self-Healing Applications Market Estimates and Forecasts, by Application (2020-2032) (USD Million)
11.2.7 USA
11.2.7.1 USA Self-Healing Applications Market Estimates and Forecasts, by Product (2020-2032) (USD Million)
11.2.7.2 USA Self-Healing Applications Market Estimates and Forecasts, by Form (2020-2032) (USD Million)
11.2.7.3 USA Self-Healing Applications Market Estimates and Forecasts, by Technology (2020-2032) (USD Million)
11.2.7.4 USA Self-Healing Applications Market Estimates and Forecasts, by Application (2020-2032) (USD Million)
11.2.8 Canada
11.2.8.1 Canada Self-Healing Applications Market Estimates and Forecasts, by Product (2020-2032) (USD Million)
11.2.8.2 Canada Self-Healing Applications Market Estimates and Forecasts, by Form (2020-2032) (USD Million)
11.2.8.3 Canada Self-Healing Applications Market Estimates and Forecasts, by Technology (2020-2032) (USD Million)
11.2.8.4 Canada Self-Healing Applications Market Estimates and Forecasts, by Application (2020-2032) (USD Million)
11.2.9 Mexico
11.2.9.1 Mexico Self-Healing Applications Market Estimates and Forecasts, by Product (2020-2032) (USD Million)
11.2.9.2 Mexico Self-Healing Applications Market Estimates and Forecasts, by Form (2020-2032) (USD Million)
11.2.9.3 Mexico Self-Healing Applications Market Estimates and Forecasts, by Technology (2020-2032) (USD Million)
11.2.9.4 Mexico Self-Healing Applications Market Estimates and Forecasts, by Application (2020-2032) (USD Million)
11.3 Europe
11.3.1 Eastern Europe
11.3.1.1 Trends Analysis
11.3.1.2 Eastern Europe Self-Healing Applications Market Estimates and Forecasts, by Country (2020-2032) (USD Million)
11.3.1.3 Eastern Europe Self-Healing Applications Market Estimates and Forecasts, by Product (2020-2032) (USD Million)
11.3.1.4 Eastern Europe Self-Healing Applications Market Estimates and Forecasts, by Form (2020-2032) (USD Million)
11.3.1.5 Eastern Europe Self-Healing Applications Market Estimates and Forecasts, by Technology (2020-2032) (USD Million)
11.3.1.6 Eastern Europe Self-Healing Applications Market Estimates and Forecasts, by Application (2020-2032) (USD Million)
11.3.1.7 Poland
11.3.1.7.1 Poland Self-Healing Applications Market Estimates and Forecasts, by Product (2020-2032) (USD Million)
11.3.1.7.2 Poland Self-Healing Applications Market Estimates and Forecasts, by Form (2020-2032) (USD Million)
11.3.1.7.3 Poland Self-Healing Applications Market Estimates and Forecasts, by Technology (2020-2032) (USD Million)
11.3.1.7.4 Poland Self-Healing Applications Market Estimates and Forecasts, by Application (2020-2032) (USD Million)
11.3.1.8 Romania
11.3.1.8.1 Romania Self-Healing Applications Market Estimates and Forecasts, by Product (2020-2032) (USD Million)
11.3.1.8.2 Romania Self-Healing Applications Market Estimates and Forecasts, by Form (2020-2032) (USD Million)
11.3.1.8.3 Romania Self-Healing Applications Market Estimates and Forecasts, by Technology (2020-2032) (USD Million)
11.3.1.8.4 Romania Self-Healing Applications Market Estimates and Forecasts, by Application (2020-2032) (USD Million)
11.3.1.9 Hungary
11.3.1.9.1 Hungary Self-Healing Applications Market Estimates and Forecasts, by Product (2020-2032) (USD Million)
11.3.1.9.2 Hungary Self-Healing Applications Market Estimates and Forecasts, by Form (2020-2032) (USD Million)
11.3.1.9.3 Hungary Self-Healing Applications Market Estimates and Forecasts, by Technology (2020-2032) (USD Million)
11.3.1.9.4 Hungary Self-Healing Applications Market Estimates and Forecasts, by Application (2020-2032) (USD Million)
11.3.1.10 Turkey
11.3.1.10.1 Turkey Self-Healing Applications Market Estimates and Forecasts, by Product (2020-2032) (USD Million)
11.3.1.10.2 Turkey Self-Healing Applications Market Estimates and Forecasts, by Form (2020-2032) (USD Million)
11.3.1.10.3 Turkey Self-Healing Applications Market Estimates and Forecasts, by Technology (2020-2032) (USD Million)
11.3.1.10.4 Turkey Self-Healing Applications Market Estimates and Forecasts, by Application (2020-2032) (USD Million)
11.3.1.11 Rest of Eastern Europe
11.3.1.11.1 Rest of Eastern Europe Self-Healing Applications Market Estimates and Forecasts, by Product (2020-2032) (USD Million)
11.3.1.11.2 Rest of Eastern Europe Self-Healing Applications Market Estimates and Forecasts, by Form (2020-2032) (USD Million)
11.3.1.11.3 Rest of Eastern Europe Self-Healing Applications Market Estimates and Forecasts, by Technology (2020-2032) (USD Million)
11.3.1.11.4 Rest of Eastern Europe Self-Healing Applications Market Estimates and Forecasts, by Application (2020-2032) (USD Million)
11.3.2 Western Europe
11.3.2.1 Trends Analysis
11.3.2.2 Western Europe Self-Healing Applications Market Estimates and Forecasts, by Country (2020-2032) (USD Million)
11.3.2.3 Western Europe Self-Healing Applications Market Estimates and Forecasts, by Product (2020-2032) (USD Million)
11.3.2.4 Western Europe Self-Healing Applications Market Estimates and Forecasts, by Form (2020-2032) (USD Million)
11.3.2.5 Western Europe Self-Healing Applications Market Estimates and Forecasts, by Technology (2020-2032) (USD Million)
11.3.2.6 Western Europe Self-Healing Applications Market Estimates and Forecasts, by Application (2020-2032) (USD Million)
11.3.2.7 Germany
11.3.2.7.1 Germany Self-Healing Applications Market Estimates and Forecasts, by Product (2020-2032) (USD Million)
11.3.2.7.2 Germany Self-Healing Applications Market Estimates and Forecasts, by Form (2020-2032) (USD Million)
11.3.2.7.3 Germany Self-Healing Applications Market Estimates and Forecasts, by Technology (2020-2032) (USD Million)
11.3.2.7.4 Germany Self-Healing Applications Market Estimates and Forecasts, by Application (2020-2032) (USD Million)
11.3.2.8 France
11.3.2.8.1 France Self-Healing Applications Market Estimates and Forecasts, by Product (2020-2032) (USD Million)
11.3.2.8.2 France Self-Healing Applications Market Estimates and Forecasts, by Form (2020-2032) (USD Million)
11.3.2.8.3 France Self-Healing Applications Market Estimates and Forecasts, by Technology (2020-2032) (USD Million)
11.3.2.8.4 France Self-Healing Applications Market Estimates and Forecasts, by Application (2020-2032) (USD Million)
11.3.2.9 UK
11.3.2.9.1 UK Self-Healing Applications Market Estimates and Forecasts, by Product (2020-2032) (USD Million)
11.3.2.9.2 UK Self-Healing Applications Market Estimates and Forecasts, by Form (2020-2032) (USD Million)
11.3.2.9.3 UK Self-Healing Applications Market Estimates and Forecasts, by Technology (2020-2032) (USD Million)
11.3.2.9.4 UK Self-Healing Applications Market Estimates and Forecasts, by Application (2020-2032) (USD Million)
11.3.2.10 Italy
11.3.2.10.1 Italy Self-Healing Applications Market Estimates and Forecasts, by Product (2020-2032) (USD Million)
11.3.2.10.2 Italy Self-Healing Applications Market Estimates and Forecasts, by Form (2020-2032) (USD Million)
11.3.2.10.3 Italy Self-Healing Applications Market Estimates and Forecasts, by Technology (2020-2032) (USD Million)
11.3.2.10.4 Italy Self-Healing Applications Market Estimates and Forecasts, by Application (2020-2032) (USD Million)
11.3.2.11 Spain
11.3.2.11.1 Spain Self-Healing Applications Market Estimates and Forecasts, by Product (2020-2032) (USD Million)
11.3.2.11.2 Spain Self-Healing Applications Market Estimates and Forecasts, by Form (2020-2032) (USD Million)
11.3.2.11.3 Spain Self-Healing Applications Market Estimates and Forecasts, by Technology (2020-2032) (USD Million)
11.3.2.11.4 Spain Self-Healing Applications Market Estimates and Forecasts, by Application (2020-2032) (USD Million)
11.3.2.12 Netherlands
11.3.2.12.1 Netherlands Self-Healing Applications Market Estimates and Forecasts, by Product (2020-2032) (USD Million)
11.3.2.12.2 Netherlands Self-Healing Applications Market Estimates and Forecasts, by Form (2020-2032) (USD Million)
11.3.2.12.3 Netherlands Self-Healing Applications Market Estimates and Forecasts, by Technology (2020-2032) (USD Million)
11.3.2.12.4 Netherlands Self-Healing Applications Market Estimates and Forecasts, by Application (2020-2032) (USD Million)
11.3.2.13 Switzerland
11.3.2.13.1 Switzerland Self-Healing Applications Market Estimates and Forecasts, by Product (2020-2032) (USD Million)
11.3.2.13.2 Switzerland Self-Healing Applications Market Estimates and Forecasts, by Form (2020-2032) (USD Million)
11.3.2.13.3 Switzerland Self-Healing Applications Market Estimates and Forecasts, by Technology (2020-2032) (USD Million)
11.3.2.13.4 Switzerland Self-Healing Applications Market Estimates and Forecasts, by Application (2020-2032) (USD Million)
11.3.2.14 Austria
11.3.2.14.1 Austria Self-Healing Applications Market Estimates and Forecasts, by Product (2020-2032) (USD Million)
11.3.2.14.2 Austria Self-Healing Applications Market Estimates and Forecasts, by Form (2020-2032) (USD Million)
11.3.2.14.3 Austria Self-Healing Applications Market Estimates and Forecasts, by Technology (2020-2032) (USD Million)
11.3.2.14.4 Austria Self-Healing Applications Market Estimates and Forecasts, by Application (2020-2032) (USD Million)
11.3.2.15 Rest of Western Europe
11.3.2.15.1 Rest of Western Europe Self-Healing Applications Market Estimates and Forecasts, by Product (2020-2032) (USD Million)
11.3.2.15.2 Rest of Western Europe Self-Healing Applications Market Estimates and Forecasts, by Form (2020-2032) (USD Million)
11.3.2.15.3 Rest of Western Europe Self-Healing Applications Market Estimates and Forecasts, by Technology (2020-2032) (USD Million)
11.3.2.15.4 Rest of Western Europe Self-Healing Applications Market Estimates and Forecasts, by Application (2020-2032) (USD Million)
11.4 Asia Pacific
11.4.1 Trends Analysis
11.4.2 Asia Pacific Self-Healing Applications Market Estimates and Forecasts, by Country (2020-2032) (USD Million)
11.4.3 Asia Pacific Self-Healing Applications Market Estimates and Forecasts, by Product (2020-2032) (USD Million)
11.4.4 Asia Pacific Self-Healing Applications Market Estimates and Forecasts, by Form (2020-2032) (USD Million)
11.4.5 Asia Pacific Self-Healing Applications Market Estimates and Forecasts, by Technology (2020-2032) (USD Million)
11.4.6 Asia Pacific Self-Healing Applications Market Estimates and Forecasts, by Application (2020-2032) (USD Million)
11.4.7 China
11.4.7.1 China Self-Healing Applications Market Estimates and Forecasts, by Product (2020-2032) (USD Million)
11.4.7.2 China Self-Healing Applications Market Estimates and Forecasts, by Form (2020-2032) (USD Million)
11.4.7.3 China Self-Healing Applications Market Estimates and Forecasts, by Technology (2020-2032) (USD Million)
11.4.7.4 China Self-Healing Applications Market Estimates and Forecasts, by Application (2020-2032) (USD Million)
11.4.8 India
11.4.8.1 India Self-Healing Applications Market Estimates and Forecasts, by Product (2020-2032) (USD Million)
11.4.8.2 India Self-Healing Applications Market Estimates and Forecasts, by Form (2020-2032) (USD Million)
11.4.8.3 India Self-Healing Applications Market Estimates and Forecasts, by Technology (2020-2032) (USD Million)
11.4.8.4 India Self-Healing Applications Market Estimates and Forecasts, by Application (2020-2032) (USD Million)
11.4.9 Japan
11.4.9.1 Japan Self-Healing Applications Market Estimates and Forecasts, by Product (2020-2032) (USD Million)
11.4.9.2 Japan Self-Healing Applications Market Estimates and Forecasts, by Form (2020-2032) (USD Million)
11.4.9.3 Japan Self-Healing Applications Market Estimates and Forecasts, by Technology (2020-2032) (USD Million)
11.4.9.4 Japan Self-Healing Applications Market Estimates and Forecasts, by Application (2020-2032) (USD Million)
11.4.10 South Korea
11.4.10.1 South Korea Self-Healing Applications Market Estimates and Forecasts, by Product (2020-2032) (USD Million)
11.4.10.2 South Korea Self-Healing Applications Market Estimates and Forecasts, by Form (2020-2032) (USD Million)
11.4.10.3 South Korea Self-Healing Applications Market Estimates and Forecasts, by Technology (2020-2032) (USD Million)
11.4.10.4 South Korea Self-Healing Applications Market Estimates and Forecasts, by Application (2020-2032) (USD Million)
11.4.11 Vietnam
11.4.11.1 Vietnam Self-Healing Applications Market Estimates and Forecasts, by Product (2020-2032) (USD Million)
11.4.11.2 Vietnam Self-Healing Applications Market Estimates and Forecasts, by Form (2020-2032) (USD Million)
11.4.11.3 Vietnam Self-Healing Applications Market Estimates and Forecasts, by Technology (2020-2032) (USD Million)
11.4.11.4 Vietnam Self-Healing Applications Market Estimates and Forecasts, by Application (2020-2032) (USD Million)
11.4.12 Singapore
11.4.12.1 Singapore Self-Healing Applications Market Estimates and Forecasts, by Product (2020-2032) (USD Million)
11.4.12.2 Singapore Self-Healing Applications Market Estimates and Forecasts, by Form (2020-2032) (USD Million)
11.4.12.3 Singapore Self-Healing Applications Market Estimates and Forecasts, by Technology (2020-2032) (USD Million)
11.4.12.4 Singapore Self-Healing Applications Market Estimates and Forecasts, by Application (2020-2032) (USD Million)
11.4.13 Australia
11.4.13.1 Australia Self-Healing Applications Market Estimates and Forecasts, by Product (2020-2032) (USD Million)
11.4.13.2 Australia Self-Healing Applications Market Estimates and Forecasts, by Form (2020-2032) (USD Million)
11.4.13.3 Australia Self-Healing Applications Market Estimates and Forecasts, by Technology (2020-2032) (USD Million)
11.4.13.4 Australia Self-Healing Applications Market Estimates and Forecasts, by Application (2020-2032) (USD Million)
11.4.14 Rest of Asia Pacific
11.4.14.1 Rest of Asia Pacific Self-Healing Applications Market Estimates and Forecasts, by Product (2020-2032) (USD Million)
11.4.14.2 Rest of Asia Pacific Self-Healing Applications Market Estimates and Forecasts, by Form (2020-2032) (USD Million)
11.4.14.3 Rest of Asia Pacific Self-Healing Applications Market Estimates and Forecasts, by Technology (2020-2032) (USD Million)
11.4.14.4 Rest of Asia Pacific Self-Healing Applications Market Estimates and Forecasts, by Application (2020-2032) (USD Million)
11.5 Middle East and Africa
11.5.1 Middle East
11.5.1.1 Trends Analysis
11.5.1.2 Middle East Self-Healing Applications Market Estimates and Forecasts, by Country (2020-2032) (USD Million)
11.5.1.3 Middle East Self-Healing Applications Market Estimates and Forecasts, by Product (2020-2032) (USD Million)
11.5.1.4 Middle East Self-Healing Applications Market Estimates and Forecasts, by Form (2020-2032) (USD Million)
11.5.1.5 Middle East Self-Healing Applications Market Estimates and Forecasts, by Technology (2020-2032) (USD Million)
11.5.1.6 Middle East Self-Healing Applications Market Estimates and Forecasts, by Application (2020-2032) (USD Million)
11.5.1.7 UAE
11.5.1.7.1 UAE Self-Healing Applications Market Estimates and Forecasts, by Product (2020-2032) (USD Million)
11.5.1.7.2 UAE Self-Healing Applications Market Estimates and Forecasts, by Form (2020-2032) (USD Million)
11.5.1.7.3 UAE Self-Healing Applications Market Estimates and Forecasts, by Technology (2020-2032) (USD Million)
11.5.1.7.4 UAE Self-Healing Applications Market Estimates and Forecasts, by Application (2020-2032) (USD Million)
11.5.1.8 Egypt
11.5.1.8.1 Egypt Self-Healing Applications Market Estimates and Forecasts, by Product (2020-2032) (USD Million)
11.5.1.8.2 Egypt Self-Healing Applications Market Estimates and Forecasts, by Form (2020-2032) (USD Million)
11.5.1.8.3 Egypt Self-Healing Applications Market Estimates and Forecasts, by Technology (2020-2032) (USD Million)
11.5.1.8.4 Egypt Self-Healing Applications Market Estimates and Forecasts, by Application (2020-2032) (USD Million)
11.5.1.9 Saudi Arabia
11.5.1.9.1 Saudi Arabia Self-Healing Applications Market Estimates and Forecasts, by Product (2020-2032) (USD Million)
11.5.1.9.2 Saudi Arabia Self-Healing Applications Market Estimates and Forecasts, by Form (2020-2032) (USD Million)
11.5.1.9.3 Saudi Arabia Self-Healing Applications Market Estimates and Forecasts, by Technology (2020-2032) (USD Million)
11.5.1.9.4 Saudi Arabia Self-Healing Applications Market Estimates and Forecasts, by Application (2020-2032) (USD Million)
11.5.1.10 Qatar
11.5.1.10.1 Qatar Self-Healing Applications Market Estimates and Forecasts, by Product (2020-2032) (USD Million)
11.5.1.10.2 Qatar Self-Healing Applications Market Estimates and Forecasts, by Form (2020-2032) (USD Million)
11.5.1.10.3 Qatar Self-Healing Applications Market Estimates and Forecasts, by Technology (2020-2032) (USD Million)
11.5.1.10.4 Qatar Self-Healing Applications Market Estimates and Forecasts, by Application (2020-2032) (USD Million)
11.5.1.11 Rest of Middle East
11.5.1.11.1 Rest of Middle East Self-Healing Applications Market Estimates and Forecasts, by Product (2020-2032) (USD Million)
11.5.1.11.2 Rest of Middle East Self-Healing Applications Market Estimates and Forecasts, by Form (2020-2032) (USD Million)
11.5.1.11.3 Rest of Middle East Self-Healing Applications Market Estimates and Forecasts, by Technology (2020-2032) (USD Million)
11.5.1.11.4 Rest of Middle East Self-Healing Applications Market Estimates and Forecasts, by Application (2020-2032) (USD Million)
11.5.2 Africa
11.5.2.1 Trends Analysis
11.5.2.2 Africa Self-Healing Applications Market Estimates and Forecasts, by Country (2020-2032) (USD Million)
11.5.2.3 Africa Self-Healing Applications Market Estimates and Forecasts, by Product (2020-2032) (USD Million)
11.5.2.4 Africa Self-Healing Applications Market Estimates and Forecasts, by Form (2020-2032) (USD Million)
11.5.2.5 Africa Self-Healing Applications Market Estimates and Forecasts, by Technology (2020-2032) (USD Million)
11.5.2.6 Africa Self-Healing Applications Market Estimates and Forecasts, by Application (2020-2032) (USD Million)
11.5.2.7 South Africa
11.5.2.7.1 South Africa Self-Healing Applications Market Estimates and Forecasts, by Product (2020-2032) (USD Million)
11.5.2.7.2 South Africa Self-Healing Applications Market Estimates and Forecasts, by Form (2020-2032) (USD Million)
11.5.2.7.3 South Africa Self-Healing Applications Market Estimates and Forecasts, by Technology (2020-2032) (USD Million)
11.5.2.7.4 South Africa Self-Healing Applications Market Estimates and Forecasts, by Application (2020-2032) (USD Million)
11.5.2.8 Nigeria
11.5.2.8.1 Nigeria Self-Healing Applications Market Estimates and Forecasts, by Product (2020-2032) (USD Million)
11.5.2.8.2 Nigeria Self-Healing Applications Market Estimates and Forecasts, by Form (2020-2032) (USD Million)
11.5.2.8.3 Nigeria Self-Healing Applications Market Estimates and Forecasts, by Technology (2020-2032) (USD Million)
11.5.2.8.4 Nigeria Self-Healing Applications Market Estimates and Forecasts, by Application (2020-2032) (USD Million)
11.5.2.9 Rest of Africa
11.5.2.9.1 Rest of Africa Self-Healing Applications Market Estimates and Forecasts, by Product (2020-2032) (USD Million)
11.5.2.9.2 Rest of Africa Self-Healing Applications Market Estimates and Forecasts, by Form (2020-2032) (USD Million)
11.5.2.9.3 Rest of Africa Self-Healing Applications Market Estimates and Forecasts, by Technology (2020-2032) (USD Million)
11.5.2.9.4 Rest of Africa Self-Healing Applications Market Estimates and Forecasts, by Application (2020-2032) (USD Million)
11.6 Latin America
11.6.1 Trends Analysis
11.6.2 Latin America Self-Healing Applications Market Estimates and Forecasts, by Country (2020-2032) (USD Million)
11.6.3 Latin America Self-Healing Applications Market Estimates and Forecasts, by Product (2020-2032) (USD Million)
11.6.4 Latin America Self-Healing Applications Market Estimates and Forecasts, by Form (2020-2032) (USD Million)
11.6.5 Latin America Self-Healing Applications Market Estimates and Forecasts, by Technology (2020-2032) (USD Million)
11.6.6 Latin America Self-Healing Applications Market Estimates and Forecasts, by Application (2020-2032) (USD Million)
11.6.7 Brazil
11.6.7.1 Brazil Self-Healing Applications Market Estimates and Forecasts, by Product (2020-2032) (USD Million)
11.6.7.2 Brazil Self-Healing Applications Market Estimates and Forecasts, by Form (2020-2032) (USD Million)
11.6.7.3 Brazil Self-Healing Applications Market Estimates and Forecasts, by Technology (2020-2032) (USD Million)
11.6.7.4 Brazil Self-Healing Applications Market Estimates and Forecasts, by Application (2020-2032) (USD Million)
11.6.8 Argentina
11.6.8.1 Argentina Self-Healing Applications Market Estimates and Forecasts, by Product (2020-2032) (USD Million)
11.6.8.2 Argentina Self-Healing Applications Market Estimates and Forecasts, by Form (2020-2032) (USD Million)
11.6.8.3 Argentina Self-Healing Applications Market Estimates and Forecasts, by Technology (2020-2032) (USD Million)
11.6.8.4 Argentina Self-Healing Applications Market Estimates and Forecasts, by Application (2020-2032) (USD Million)
11.6.9 Colombia
11.6.9.1 Colombia Self-Healing Applications Market Estimates and Forecasts, by Product (2020-2032) (USD Million)
11.6.9.2 Colombia Self-Healing Applications Market Estimates and Forecasts, by Form (2020-2032) (USD Million)
11.6.9.3 Colombia Self-Healing Applications Market Estimates and Forecasts, by Technology (2020-2032) (USD Million)
11.6.9.4 Colombia Self-Healing Applications Market Estimates and Forecasts, by Application (2020-2032) (USD Million)
11.6.10 Rest of Latin America
11.6.10.1 Rest of Latin America Self-Healing Applications Market Estimates and Forecasts, by Product (2020-2032) (USD Million)
11.6.10.2 Rest of Latin America Self-Healing Applications Market Estimates and Forecasts, by Form (2020-2032) (USD Million)
11.6.10.3 Rest of Latin America Self-Healing Applications Market Estimates and Forecasts, by Technology (2020-2032) (USD Million)
11.6.10.4 Rest of Latin America Self-Healing Applications Market Estimates and Forecasts, by Application (2020-2032) (USD Million)
12. Company Profiles
12.1 Covestro AG
12.1.1 Company Overview
12.1.2 Financial
12.1.3 Products/ Services Offered
12.1.4 SWOT Analysis
12.2 High Impact Technology, LLC.
12.2.1 Company Overview
12.2.2 Financial
12.2.3 Products/ Services Offered
12.2.4 SWOT Analysis
12.3 The Dow Chemical Company
12.3.1 Company Overview
12.3.2 Financial
12.3.3 Products/ Services Offered
12.3.4 SWOT Analysis
12.4 Michelin Group
12.4.1 Company Overview
12.4.2 Financial
12.4.3 Products/ Services Offered
12.4.4 SWOT Analysis
12.5 BASF SE
12.5.1 Company Overview
12.5.2 Financial
12.5.3 Products/ Services Offered
12.5.4 SWOT Analysis
12.6 MacDermid Autotype Ltd.
12.6.1 Company Overview
12.6.2 Financial
12.6.3 Products/ Services Offered
12.6.4 SWOT Analysis
12.7 DuPont
12.7.1 Company Overview
12.7.2 Financial
12.7.3 Products/ Services Offered
12.7.4 SWOT Analysis
12.8 Akzo Nobel N.V.
12.8.1 Company Overview
12.8.2 Financial
12.8.3 Products/ Services Offered
12.8.4 SWOT Analysis
12.9 Evonik Industries Corporation
12.9.1 Company Overview
12.9.2 Financial
12.9.3 Products/ Services Offered
12.9.4 SWOT Analysis
12.10 Huntsman International LLC.
12.10.1 Company Overview
12.10.2 Financial
12.10.3 Products/ Services Offered
12.10.4 SWOT Analysis
12.11 Arkema SA
12.11.1 Company Overview
12.11.2 Financial
12.11.3 Products/ Services Offered
12.11.4 SWOT Analysis
13. Use Cases and Best Practices
14. Conclusion
An accurate research report requires proper strategizing as well as implementation. There are multiple factors involved in the completion of good and accurate research report and selecting the best methodology to compete the research is the toughest part. Since the research reports we provide play a crucial role in any company’s decision-making process, therefore we at SNS Insider always believe that we should choose the best method which gives us results closer to reality. This allows us to reach at a stage wherein we can provide our clients best and accurate investment to output ratio.
Each report that we prepare takes a timeframe of 350-400 business hours for production. Starting from the selection of titles through a couple of in-depth brain storming session to the final QC process before uploading our titles on our website we dedicate around 350 working hours. The titles are selected based on their current market cap and the foreseen CAGR and growth.
The 5 steps process:
Step 1: Secondary Research:
Secondary Research or Desk Research is as the name suggests is a research process wherein, we collect data through the readily available information. In this process we use various paid and unpaid databases which our team has access to and gather data through the same. This includes examining of listed companies’ annual reports, Journals, SEC filling etc. Apart from this our team has access to various associations across the globe across different industries. Lastly, we have exchange relationships with various university as well as individual libraries.
Step 2: Primary Research
When we talk about primary research, it is a type of study in which the researchers collect relevant data samples directly, rather than relying on previously collected data. This type of research is focused on gaining content specific facts that can be sued to solve specific problems. Since the collected data is fresh and first hand therefore it makes the study more accurate and genuine.
We at SNS Insider have divided Primary Research into 2 parts.
Part 1 wherein we interview the KOLs of major players as well as the upcoming ones across various geographic regions. This allows us to have their view over the market scenario and acts as an important tool to come closer to the accurate market numbers. As many as 45 paid and unpaid primary interviews are taken from both the demand and supply side of the industry to make sure we land at an accurate judgement and analysis of the market.
This step involves the triangulation of data wherein our team analyses the interview transcripts, online survey responses and observation of on filed participants. The below mentioned chart should give a better understanding of the part 1 of the primary interview.
Part 2: In this part of primary research the data collected via secondary research and the part 1 of the primary research is validated with the interviews from individual consultants and subject matter experts.
Consultants are those set of people who have at least 12 years of experience and expertise within the industry whereas Subject Matter Experts are those with at least 15 years of experience behind their back within the same space. The data with the help of two main processes i.e., FGDs (Focused Group Discussions) and IDs (Individual Discussions). This gives us a 3rd party nonbiased primary view of the market scenario making it a more dependable one while collation of the data pointers.
Step 3: Data Bank Validation
Once all the information is collected via primary and secondary sources, we run that information for data validation. At our intelligence centre our research heads track a lot of information related to the market which includes the quarterly reports, the daily stock prices, and other relevant information. Our data bank server gets updated every fortnight and that is how the information which we collected using our primary and secondary information is revalidated in real time.
Step 4: QA/QC Process
After all the data collection and validation our team does a final level of quality check and quality assurance to get rid of any unwanted or undesired mistakes. This might include but not limited to getting rid of the any typos, duplication of numbers or missing of any important information. The people involved in this process include technical content writers, research heads and graphics people. Once this process is completed the title gets uploader on our platform for our clients to read it.
Step 5: Final QC/QA Process:
This is the last process and comes when the client has ordered the study. In this process a final QA/QC is done before the study is emailed to the client. Since we believe in giving our clients a good experience of our research studies, therefore, to make sure that we do not lack at our end in any way humanly possible we do a final round of quality check and then dispatch the study to the client.
Key Segments:
By Product
Concrete
Polymers
Asphalt
Coatings
Fiber-reinforced Composites
Ceramic
Metals
By Form
Intrinsic
Extrinsic
By Technology
Reversible Polymers
Shape Memory Materials
Biological Material Systems
Microencapsulation
Others
By Application
Energy Generation
Building & Construction
Automotive & Transportation
Electronics & Semiconductors
Medical (Implants & devices)
Others
Request for Segment Customization as per your Business Requirement: Segment Customization Request
Regional Coverage:
North America
US
Canada
Mexico
Europe
Eastern Europe
Poland
Romania
Hungary
Turkey
Rest of Eastern Europe
Western Europe
Germany
France
UK
Italy
Spain
Netherlands
Switzerland
Austria
Rest of Western Europe
Asia Pacific
China
India
Japan
South Korea
Vietnam
Singapore
Australia
Rest of Asia Pacific
Middle East & Africa
Middle East
UAE
Egypt
Saudi Arabia
Qatar
Rest of Middle East
Africa
Nigeria
South Africa
Rest of Africa
Latin America
Brazil
Argentina
Colombia
Rest of Latin America
Request for Country Level Research Report: Country Level Customization Request
Available Customization
With the given market data, SNS Insider offers customization as per the company’s specific needs. The following customization options are available for the report:
Product Analysis
Criss-Cross segment analysis (e.g. Product X Application)
Product Matrix which gives a detailed comparison of product portfolio of each company
Geographic Analysis
Additional countries in any of the regions
Company Information
Detailed analysis and profiling of additional market players (Up to five)
The Polymer Solar Cells Market Size was valued at USD 0.10 billion in 2023 and is expected to reach USD 0.52 billion by 2031 and grow at a CAGR of 21.6% over the forecast period 2024-2031.
The Bio-based Polycarbonate Market Size was valued at USD 70.16 Mn in 2023 and will reach USD 139.42 Mn by 2032 and grow at a CAGR of 9.11% by 2024-2032
Base Oil Market Size was valued at USD 20.86 billion in 2023. It is projected to reach USD 33.20 billion by 2032 and grow at a CAGR of 5.3% over the forecast period 2024-2032.
The Air Handling Units Market Size was valued at USD 12.64 billion in 2023, and is expected to reach USD 20.10 billion by 2032, and grow at a CAGR of 5.29% over the forecast period 2024-2032.
The Acrylic Polymer Market Size was valued at USD 610 million in 2023, and is expected to reach USD 883.4 million by 2032, and grow at a CAGR of 4.2% over the forecast period 2024-2032.
The Rubber Additives Market Size was valued at USD 8.5 billion in 2023 and is expected to reach USD 12.2 billion by 2032 and grow at a CAGR of 4.0% over the forecast period 2024-2032.
Hi! Click one of our member below to chat on Phone